 Open Access Article
Transformation behavior of potassium during pyrolysis of biomass
Chen Chen ,
Zhongyang Luo,
Chunjiang Yu,
Tao Wang* and
Hengli Zhang
State Key Laboratory of Clean Energy Utilization, Zhejiang University, Hangzhou 310027, China. E-mail: oatgnaw@zju.edu.cn; Fax: +86-571-87951616; Tel: +86-571-87952205
First published on 19th June 2017
Abstract
The present work studied the transformation behavior of K involving the change of water-insoluble K and K2CO3 during biomass pyrolysis. KCl-loaded cellulose samples were used as fuels with the aim to determine the key reactions involved during K transformation. For comparision, KCl-loaded char samples were used as fuels to eliminate the effect of organics in cellulose on K transformation. The total amounts of K, and water-soluble K, Cl−, and CO32− in the fuels and in the obtained solid residues were quantified. The quantification results indicated that, during the pyrolysis of the KCl-loaded cellulose, the reactions between KCl and active functional groups which are produced from organic matter in cellulose during pyrolysis lead to a certain amount of water-insoluble K formed above 300 °C and the water-insoluble K was transformed into K2CO3 above 600 °C. The reactions between KCl and the organic matter in the cellulose were governed by both the availability of active functional groups produced during cellulose pyrolysis and the amount of KCl. The presence of O2 promoted the generation of K2CO3.
1. Introduction
Biomass is a promising renewable energy source that is expected to play an important role in future fuel supply owing to its wide distribution, carbon neutrality, and limited environmental impact characteristics.1 However, natural biomass, especially that derived from agricultural residues, typically contains high amounts of potassium (K).2,3 During biomass thermal conversion, K and Cl are easily released into the gas phase, thereby causing serious operational issues (e.g., fouling, deposition, and high-temperature corrosion) on heat-transfer surfaces.2,4 Thus, investigating the transformation of K during biomass thermal conversion is of crucial importance.K is the most abundant cation in biomass, being crucial for plant nutrition, growth, tropisms, enzyme homeostasis, and osmoregulation.5,6 Previous studies7,8 have concluded that the majority of K in biomass (>80%) is water-soluble, thereby suggesting that this element is present as freely moving ions in cells or transport channels in natural biomass. Cl, being usually present in biomass with high amounts, can be removed to a large extent (>90%) by leaching.8,9 The other usually water-soluble anions in biomass are CO32−/HCO3− and SO42−.9 The previous study of Chen et al.9 has found that the inorganic salts, rich in K and Cl, deposit as salt particles and dispersedly distribute in dry rice straw. The contents of K and Cl in plants depend on the plant species, the growth conditions, and the handling process after harvest.8 The typical K and Cl contents of common biomass such as wood, rice straw, and wheat straw are 0.1–2.2 wt% and 0.02–0.67 wt%, respectively, as reported in the literature.3,8–16
The transformation behavior of K during biomass thermal conversion depends on the temperature which can be divided into two zones, above and below 700 °C. Johansen et al.11 and van Lith et al.17 found that about 10% of K was released below 700 °C, which was generally identified as the result of organic K decomposition. At temperatures higher than 700 °C, large amounts of K were released as KCl, since the vapor pressure of this compound significantly increased.3,8,10,18,19 On the other hand, K2CO3 may be generated through organic K decomposition at high temperature.20 At temperatures above 800 °C, K2CO3 would be decomposed3,8,18 with the release of K atoms or KOH.21 However, the pathway of the formation of K2CO3 during biomass thermal conversion remains unclear and thus represents a critical research need.
According to the well-known low-temperature Cl release mechanism,12,22 KCl reacts with active functional groups on the char matrix to release HCl according to the following reaction:
| Char-COOH(s) + KCl(s) → Char-COOK(s) + HCl(g) | (1) |
Notably, this reaction may lead to the formation of K which is firmly bound to the char matrix. A few researchers22–25 have found that the organic matter in biomass influence the transformation behavior of K during biomass thermal conversion. However, the interactions between the organic matter of biomass and KCl during biomass thermal conversion have been rarely investigated in detail.
The aim of the present study is to investigate K transformation mechanisms during biomass pyrolysis involving the generation of K firmly bound to the char matrix and K2CO3. With this aim, KCl-loaded cellulose samples were used as fuels to determine the key reactions involved during K transformation. The effects of the residence time and the atmosphere on the K transformation were also studied.
2. Experimental
2.1 Sample preparation
Microcrystalline cellulose (C104841, particle size: 90 μm, Aladdin Industries Corporation, Shanghai, China) was used and its properties are shown in Table 1. The cellulose was first washed with ultrapure water at room temperature to remove water-soluble compounds and subsequently dried at 35 °C for 5 h.26 The dried cellulose was loaded with KCl via wet impregnation at varying K element contents, i.e., 0.3, 1.0, 2.0, and 5.0 wt%, to prepare four different samples (MC0.3, MC1, MC2, and MC5, respectively). The impregnation process involved the preparation of a KCl aqueous solution and a blending of solution with cellulose to prepare a cellulose–water slurry. The slurry was stirred for 24 h and subsequently dried at 35 °C for 8 h. The obtained dry solid matter was ground with an agate mortar and sieved to a particle size (lower than 90 μm) to obtain the KCl-loaded cellulose samples for subsequent experiments. The K contents in the four KCl-loaded cellulose samples were determined three times to ensure reliable K loading results. A water-washed non-KCl-loaded sample (MC0) was also subjected to the impregnation process.| Proximate ananlysis | Ultimate analysis | ||||||
|---|---|---|---|---|---|---|---|
| V | FC | A | C | H | O | N | S |
| 94.6 | 5.4 | — | 44.0 | 6.3 | 49.7 | — | — |
For the sake of comparison, the MC0 sample was pyrolyzed at 600 °C for 30 min and subsequently loaded with KCl to prepare KCl-loaded char samples (CR) as fuels so that the effect of organics in cellulose on K transformation in the CR can be neglected. The K element content was set as 13 wt% according to the solid yields and the K contents of the KCl-loaded cellulose samples.
2.2 Experimental procedures
Table 2 lists the experimental conditions used in the present study. Pyrolysis was performed in a laboratory-scale tube reactor at temperatures ranging from 200 to 900 °C. The details of the reactor can be found in our previous work.9 In a typical pyrolysis experiment, 0.5 g of KCl-loaded cellulose or char samples were used. The reactor was preheated and purged with N2, and the sample boat was subsequently inserted into the water-cooled chamber of the reactor. When the reactor reached the set temperature, the sample boat was inserted into the hot zone of the reactor for pyrolysis under a N2 flow rate of 1.5 NL min−1. After 30 min of reaction, the sample was placed again into the water-cooled chamber and cooled to 60 °C under N2 purge. The sample was subsequently weighed and stored in a dry and cool environment. Additional experiments were conducted to investigate the influence of the residence time and the atmosphere. The MC2 samples were pyrolyzed for 60 min and combusted (2 vol% O2 in N2, total flow rate: 1.5 NL min−1) for 30 min at 400 and 800 °C. The concentration of O2 was chosen as 2 vol% to minimize the temperature overshoot (<15 °C, measured above the samples). The microscopic morphology and the inorganic matter distribution of the solid residue samples obtained after pyrolysis of MC0, MC2, and MC5 were studied by scanning electron microscopy coupled with energy-dispersive spectroscopy (SEM/EDS, HITACHI SU-70).| Experimental condition name | Samples | Atmosphere | Residence time (min) | Temperature (°C) |
|---|---|---|---|---|
| MC0 | MC0 | N2 | 30 | 200–900 |
| MC0.3 | MC0.3 | N2 | 30 | 200–900 |
| MC1 | MC1 | N2 | 30 | 200–900 |
| MC2 | MC2 | N2 | 30 | 200–900 |
| MC5 | MC5 | N2 | 30 | 200–900 |
| CR | CR | N2 | 30 | 200–900 |
| MC2 60 min | MC2 | N2 | 60 | 400, 800 |
| MC2 combustion | MC2 | 2 vol% O2 in N2 balance | 30 | 400, 800 |
The amount of K transformed and released was quantified by weight measurements and chemical analysis. The total concentrations of K in the samples were quantified through an acid digestion process. In this process, 50 mg of the samples were dissolved by pressurized microwave digestion in a mixture of 9 mL of HNO3 and 1 mL of H2O2 at 180 °C for 15 min. After the digestion process, the obtained acid solution was diluted for inductively coupled plasma-atomic emission spectrometry (ICP-AES, Thermo iCAP6300) analysis to determine the total concentration of K. Three kinds of standard K solutions (i.e., 1, 5, and 10 ppm) were used for ICP-AES analysis. To ensure measurement accuracy, all the samples tested by ICP-AES were diluted to obtain concentrations within 1–10 ppm. Each group of experiments was repeated 3 times, and the standard deviation was lower than 3% in all cases.
The concentrations of water-soluble K, Cl−, and CO32− in the solid residue samples were analyzed by a water extraction process. In a typical water extraction process, 50 mg of the samples were dissolved in ultrapure water with a sample-to-water ratio of 0.5 g L−1 and stirred for 8 h at 60 °C. As in the case of the total K measurements, the concentration of K in the water solutions was determined by ICP-AES. The concentrations of Cl− and CO32− in the water solutions were determined by ion chromatography (IC, DIONEX ICS-2000) with NaOH solution as the eluent. Each group of experiments was repeated 3 times, and the standard deviation was lower than 3% in all cases.
3. Results
3.1 Microscopic morphology of the solid residues obtained after pyrolysis
The solid residues obtained after pyrolysis at 400 °C were selected to observe the micro-topography of the inorganic matter.9 With the aim to gain insight into the disappearance of the inorganic matter, samples pyrolyzed at 900 °C were also selected for these studies. Fig. 1 shows the microscopic morphology of the obtained solid residues after pyrolysis of MC0, MC2, and MC5 at 400 and 900 °C. And Table 3 shows the EDS results at the positions detailed in Fig. 1(2).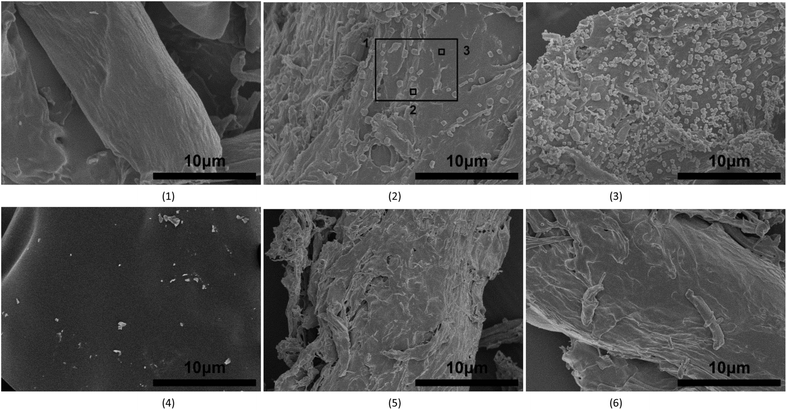 | ||
| Fig. 1 SEM images of the solid residues obtained after pyrolysis at 400 and 900 °C: (1) MC0 400 °C, (2) MC2 400 °C, (3) MC5 400 °C, (4) MC0 900 °C, (5) MC2 900 °C, and (6) MC5 900 °C. | ||
| C | O | Cl | K | |
|---|---|---|---|---|
| 1 | 84 | 12 | 1.6 | 1.9 |
| 2 | 86 | 9 | 2.6 | 2.6 |
| 3 | 84 | 14 | 1.0 | 1.4 |
As shown in Fig. 1, rough particles (0.2–1.0 μm in size) uniformly distributed over the entire solid residues obtained by pyrolysis of MC2 and MC5 at 400 °C, with the sample derived from MC5 showing the largest number of particles. These rough particles were not found in the solid residues obtained by pyrolysis of MC2 and MC5 at 900 °C, and MC0 at 400 °C and 900 °C. As detailed in Table 3, higher K and Cl concentrations were found at position 2 (Fig. 1(2), point analysis on one particle) as compared to position 3 (point analysis on no particle). Hence, these above results indicated that the rough particles were inorganic particles enriched in K and Cl. The micro-distribution and particle sizes of the inorganic matter particles obtained herein were similar to those showed on the cell wall of rice straw char.9 Thus, K transformation during pyrolysis of the KCl-loaded cellulose samples through wet impregnation in the present work are comparable with those of natural biomass. In addition, as shown in Fig. 1, the surface of the solid residues obtained after pyrolysis of MC2 and MC5 were rough and partly broken but that of MC0 was smooth, indicating that reaction between KCl and cellulose may make surface of char rough.
3.2 Transformation of K after pyrolysis
Table 4 shows the total K, and water-soluble K, Cl−, and CO32− concentrations of the original fuel samples (MC0, MC0.3, MC1, MC2, MC5, and CR) samples. The results show that the concentration of total K was similar to that of the water-soluble K and the mole ratio of total K to water-soluble Cl− was 1 in all cases. Remarkably, no CO32− was found in the water solution, thereby indicating that the totality of the K and Cl− in the MC0.3, MC1, MC2, MC5, and CR samples remained in the form of KCl after the wet impregnation process.| Total K | Water-soluble K | Water-soluble Cl− | Water-soluble CO32− | |
|---|---|---|---|---|
| MC0 | 0.000 | 0.000 | 0.000 | 0.000 |
| MC0.3 | 0.301 | 0.302 | 0.273 | 0.000 |
| MC1 | 0.999 | 1.000 | 0.913 | 0.000 |
| MC2 | 2.001 | 2.001 | 1.825 | 0.000 |
| MC5 | 5.002 | 5.002 | 4.561 | 0.000 |
| CR | 13.120 | 13.121 | 11.921 | 0.000 |
The K retention percentages in the solid phase after pyrolysis of MC0.3, MC1, MC2, MC5 and CR samples for 30 min were calculated using the following equation:
 | (2) |
As shown in Fig. 2, a small fraction of K was released into the gas phase below 700 °C. The retention of K by MC0.3, MC1, MC2, and MC5 significantly decreased at pyrolysis temperatures over 600 °C and reached 43.9–51.4% at 800 °C. In the case of CR, the K retention ratio started to decrease above 700 °C. The main difference between the KCl-loaded cellulose fuels samples and CR fuels samples is the former contain organic matter of cellulose but the later do not. The different K retention behavior of the KCl-loaded cellulose samples and CR revealed that the organic matter in cellulose has an impact on the K transformation during pyrolysis.
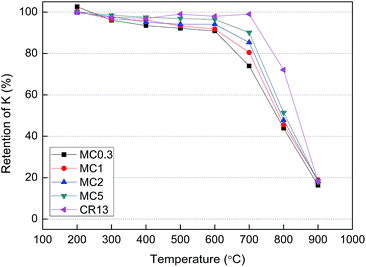 | ||
| Fig. 2 Percentage of K retained in the solid phase as a function of the pyrolysis temperature for the different fuel samples after pyrolysis for 30 min. | ||
Fig. 3 shows the ratio of water-soluble K to total K in the solid residues obtained after pyrolysis for 30 min. The ratios remained below 96% for the MC0.3, MC1, MC2, and MC5 samples after pyrolysis at 300–600 °C, indicating that water-insoluble K was formed in the solid residues at these temperatures. The ratios reached a minimum at 400 °C. It can be estimated that about 52, 27, 19, and 8% of the total K in the original MC0.3, MC1, MC2, and MC5 samples became water-insoluble after pyrolysis at 400 °C, respectively. Additionally, as shown in Fig. 3, the water-soluble K to total K ratio of the solid residue obtained after pyrolysis of CR remained nearly unchanged in the entire range of temperature studied herein (200–900 °C).
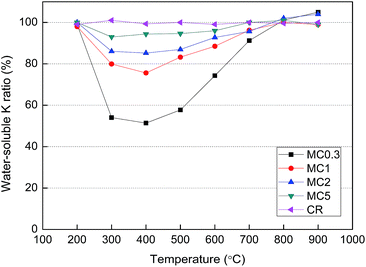 | ||
| Fig. 3 Water-soluble K to total K ratio of the solid residues obtained after pyrolysis of the samples for 30 min. | ||
The retention of water-soluble Cl− after pyrolysis of the MC0.3, MC1, MC2, MC5, and CR samples for 30 min was calculated using the following equation:
 | (3) |
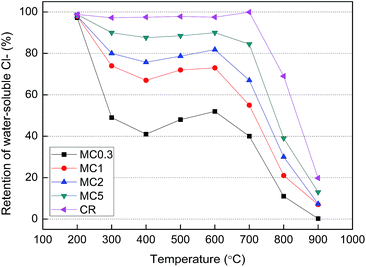 | ||
| Fig. 4 Water-soluble Cl− retention of the solid residues obtained after pyrolysis of the different fuel samples for 30 min. | ||
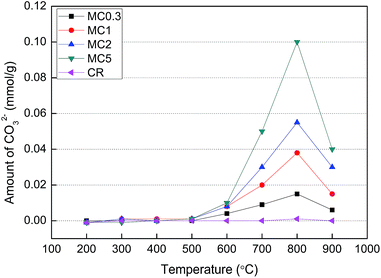
Fig. 5 represents the amount of CO32− of the solid residues obtained after pyrolysis of the samples for 30 min. Since the eluent used during IC was a NaOH solution, the concentrations of CO32− directly obtained by this technique actually corresponded to the sum of the concentrations of HCO3− and CO32− in the detected water solution. As KHCO3 decomposes to form K2CO3 at temperatures above 200 °C,18 no KHCO3 was found in the solid residues. Instead, the only matter present was K2CO3 and therefore the concentrations of CO32− obtained from IC analysis were representative of the actual CO32− concentrations in the solid residues.
These results shown in Fig. 5 indicated that a certain amount of CO32− was generated during pyrolysis of MC0.3, MC1, MC2, and MC5 at temperatures higher than 600 °C. The amount of CO32− in these samples reached a maximum at 800 °C. In addition, the amount of CO32− increased with the increased content of K in the KCl-loaded cellulose samples. In the case of the CR sample, no CO32− was found within the entire temperature range of the present study (200–900 °C). These results indicated that the generation of CO32− was likely related to the organics in the cellulose. The generation pathway of CO32− during pyrolysis of the cellulose samples was discussed in Section 4.2.
3.3 Influence of the residence time and the atmosphere
Table 5 shows the retention of K and Cl−, the water-soluble K to total K ratio, and the amount of CO32− data for the MC2 sample after thermal conversion at different residence times and atmospheres. These four parameters remained nearly unchanged while increasing the residence time from 30 to 60 min after pyrolysis at 400 °C. On the other hand, after pyrolysis at 800 °C, the retention of K and water-soluble Cl− decreased with the increase of the residence time whereas the water-soluble K to total K ratio and the amount of CO32− remained constant.| Experimental conditionsa | P-400-30 | P-800-30 | P-400-60 | P-800-60 | C-400-30 | C-800-30 |
|---|---|---|---|---|---|---|
| a P is pyrolysis; 30 or 60 indicates the residence time in min; C is combustion. | ||||||
| Retention of K (%) | 95.1 | 47.8 | 95.0 | 35.1 | 94.7 | 33.7 |
| Water-soluble K (%) | 85.2 | 102.0 | 85.1 | 101.2 | 90.3 | 100.1 |
| Retention of water-soluble Cl− (%) | 76.8 | 30.4 | 76.6 | 15.6 | 78.7 | 10.1 |
| Amount of CO32− (mmol g−1) | 0 | 0.055 | 0 | 0.056 | 0 | 0.070 |
As shown in Table 5, those four parameters remained nearly unchanged while the atmosphere changed from inert to oxidizing at 400 °C. The retention of K and water-soluble Cl− values under an oxidizing atmosphere were lower than those obtained under an inert atmosphere at 800 °C. The amount of CO32− under an oxidizing atmosphere was larger as compared to that obtained under an inert atmosphere at 800 °C (0.070 vs. 0.055 mmol g−1).
4. Discussion
In the present work, the water-soluble K mainly includes KCl and K2CO3 while the water-insoluble K mainly includes organic K and char K (i.e., K strongly bound to the char matrix).22,27 As K is the only inorganic cation, water-soluble Cl− and CO32− can be assumed to be in the forms of KCl and K2CO3 in the obtained solid residues.27,28 Therefore, the main chemical forms of K found herein can be classified into four kinds: (1) KCl, (2) K2CO3, (3) water-insoluble K, and (4) K released into the gas phase.The results of the CR sample in Table 4 and Fig. 2–5 showed that the K in the solid residues obtained after pyrolysis at 200–900 °C remained in the form of KCl, and no water-insoluble K or K2CO3 were generated. These results indicated that, during the pyrolysis of the CR sample, only KCl evaporation occurred.
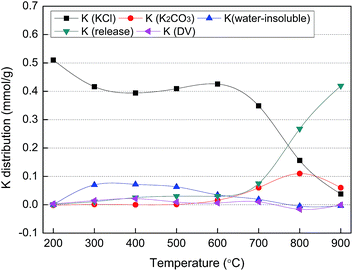
The K distribution in the solid residues obtained after pyrolysis of the MC2 sample (representative of the KCl-loaded cellulose samples) for 30 min was illustrated in Fig. 6 based on the data in Table 4 and Fig. 2–5. The number of moles of water-soluble Cl− and CO32− were equal to those of K in the form of KCl and K2CO3 in the obtained solid residue, respectively. The amount of K released was equal to the initial amount of K in the samples minus the amount of K retained. With the aim to perform a K balance, the differences between the initial K content in the samples and the sum of the amounts of the above four K chemical forms were calculated for all the samples and symbolized as K(DV). All the samples showed relatively low K(DV) values, thereby indicating that the four chemical forms considered herein accounted for almost all the chemical forms of K present during the pyrolysis treatment. Also, the low K(DV) values revealed that the errors were maintained within an acceptable range.
The initial amount of K in the MC2 sample was 0.513 mmol g−1 and all of it was in the form of KCl, as revealed by the results of the original samples shown in Table 4. As shown in Fig. 6, during the pyrolysis of MC2, K element was transformed into KCl, K2CO3, water-insoluble K, and released K as a function of temperature. The temperature can be divided into two regions: low temperature (200–600 °C) and high temperature (700–900 °C) regions.
4.1 K transformation at low temperatures
The results shown in Fig. 6 indicated that the transformation of K from KCl to water-insoluble K during the cellulose samples pyrolysis took place at 300–600 °C, but this transformation was not observed for the CR sample. Thus, the transformation of K in the form of KCl into water-insoluble K is likely to be occurred through reaction (1) in which K atom in KCl replaces H atom in the active functional groups (e.g., carboxylic or phenolic groups) which are produced from pyrolysis of organic matter in cellulose29 and at the same time water-insoluble K is produced. As shown in Table 5, the effect of the residence time on the K transformation behavior was negligible when pyrolysis was carried out at 400 °C. Since the process of cellulose pyrolysis was completed at 30 min, no more active functional groups would be available to react with KCl at longer residence times.The net solid yield ratio (after eliminating the water-soluble K and Cl− in the solid samples) was calculated as follows:
 | (4) |
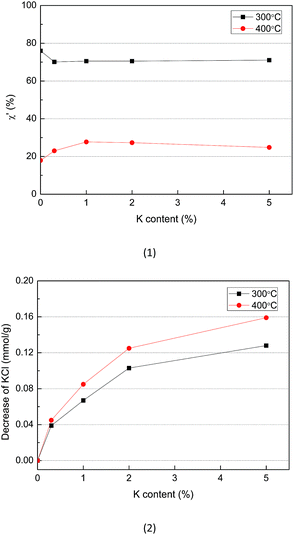 | ||
| Fig. 7 Solid yield ratio (1) and amount of KCl reacted (2) during pyrolysis of KCl-loaded cellulose samples at 300 and 400 °C. | ||
4.2 K transformation at high temperatures
As shown in Fig. 6, during the pyrolysis of the MC2 sample at 600 °C, the amount of K2CO3 increased with the decrease of water-insoluble K. This tendency was more pronounced at 700 and 800 °C. The results indicated that the water-insoluble K may be transformed into K2CO3 as the temperature increased. The amount of K in the form of KCl and K2CO3 at 800 °C was 0.16 mmol g−1 and 0.11 mmol g−1, respectively, which indicated that part of the initial K (in the form of KCl) in the MC2 fuel was converted to K2CO3 during pyrolysis. The relative amount of K element in form of KCl converted to K2CO3 in the MC0.3, MC1, MC2, MC5 fuel samples during pyrolysis at 800 °C (as compared to the initial K element amount in the fuels) was estimated as 39%, 29%, 21%, and 16%, respectively.Based on our results, a possible mechanism of K2CO3 generation was proposed. First, KCl reacts with the organic functional groups (e.g., carboxylic or phenolic groups) which are produced from pyrolysis of organic matter in cellulose to form water-insoluble K. At temperature exceeding 600 °C, water-insoluble K subsequently decomposes to form K2CO3. According to the data from Table 5, the oxidizing atmosphere was found to favor the generation of K2CO3 at 800 °C. It is known that water-insoluble K can be decomposed either into potassium atoms and oxygen in gas phase or into K2CO3.11 The oxidizing atmosphere can inhibit the release of oxygen and enhance the formation of K2CO3.
Fig. 2 demonstrated that significant amounts of K were released at temperatures higher than 600 and 700 °C during pyrolysis of the KCl-loaded cellulose samples and the CR sample, respectively. The K in the KCl-loaded cellulose samples was mainly released via KCl vaporization, K2CO3 decomposition or water-insoluble K decomposition above 700 °C. The relatively lower temperature of K release for KCl-loaded cellulose samples can be explained in terms of the K2CO3 generated during pyrolysis decreasing the melting point of the K salts.32 In contrast, no K2CO3 was found for the CR sample at 700 °C. In addition, longer residence time enhanced K release during pyrolysis of the MC2 sample at 800 °C (Table 5) because KCl was continuously vaporized. When compared with an inert atmosphere at 800 °C, the higher amounts of K release under an oxidizing atmosphere (Table 5) were likely caused by the reduction of the diffusion resistance of the char matrix.
5. Conclusions
The transformation behavior of K involving the conversion of water-insoluble K and K2CO3 during pyrolysis of biomass was quantitatively investigated by using KCl-loaded cellulose as fuels in the present work. The results of the microscopic morphology indicated that the micro-distribution status and particle sizes of the inorganic matter particles in the KCl-loaded cellulose samples were similar to those of natural rice straw. Four different chemical forms of K were studied: (1) KCl, (2) K2CO3, (3) water-insoluble K, and (4) K released into the gas phase. The results indicated that, during the pyrolysis of the CR sample, only KCl evaporation occurred. During pyrolysis of the KCl-loaded cellulose samples, a certain amount of water-insoluble K was formed at temperatures above 300 °C. The reaction transforming KCl into water-insoluble K was found to be governed by both the availability of active functional groups produced during cellulose pyrolysis and the amount of KCl. The water-insoluble K decomposed to form K2CO3 above 600 °C. Furthermore, the results indicated that this newly generated K2CO3 promoted K release into the gas phase. We suggest that the transformation of KCl into water-insoluble K and K2CO3 should be emphasized for the further research of K transformation during the thermal conversion of biomass.Acknowledgements
The authors wish to gratefully acknowledge the financial support received from the National Natural Science Foundation of China (51661125012).References
- R. Saidur, E. A. Abdelaziz, A. Demirbas, M. S. Hossain and S. Mekhilef, Renewable Sustainable Energy Rev., 2011, 15, 2262–2289 CrossRef CAS.
- A. A. Khan, W. de Jong, P. J. Jansens and H. Spliethoff, Fuel Process. Technol., 2009, 90, 21–50 CrossRef CAS.
- P. A. Jensen, F. J. Frandsen, K. Dam-Johansen and B. Sander, Energy Fuels, 2000, 14, 1280–1285 CrossRef CAS.
- L. Li, C. Yu, F. Huang, J. Bai, M. Fang and Z. Luo, Energy Fuels, 2012, 26, 6008–6014 CrossRef CAS.
- M. W. Szczerba, D. T. Britto and H. J. Kronzucker, J. Plant Physiol., 2009, 166, 447–466 CrossRef CAS PubMed.
- R. A. Leigh and R. Jones, New Phytol., 1984, 97, 1–13 CrossRef CAS.
- S. B. Liaw and H. Wu, Ind. Eng. Chem. Res., 2013, 52, 4280–4289 CrossRef CAS.
- J. N. Knudsen, P. A. Jensen and K. Dam-Johansen, Energy Fuels, 2004, 18, 1385–1399 CrossRef CAS.
- C. Chen, C. Yu, H. Zhang, X. Zhai and Z. Luo, Fuel, 2016, 167, 180–187 CrossRef CAS.
- S. C. van Lith, P. A. Jensen, F. J. Frandsen and P. Glarborg, Energy Fuels, 2008, 22, 1598–1609 CrossRef CAS.
- J. M. Johansen, J. G. Jakobsen, F. J. Frandsen and P. Glarborg, Energy Fuels, 2011, 25, 4961–4971 CrossRef CAS.
- S. B. Saleh, J. P. Flensborg, T. K. Shoulaifar, Z. Sárossy, B. B. Hansen, H. Egsgaard, N. DeMartini, P. A. Jensen, P. Glarborg and K. Dam-Johansen, Energy Fuels, 2014, 28, 3738–3746 CrossRef CAS.
- H. Wu, M. S. Bashir, P. A. Jensen, B. Sander and P. Glarborg, Fuel, 2013, 113, 632–643 CrossRef CAS.
- J. M. Johansen, M. Aho, K. Paakkinen, R. Taipale, H. Egsgaard, J. G. Jakobsen, F. J. Frandsen and P. Glarborg, Proc. Combust. Inst., 2013, 34, 2363–2372 CrossRef CAS.
- Z. Zhang, Q. Song, Q. Yao and R. Yang, Energy Fuels, 2012, 26, 1892–1899 CrossRef CAS.
- P. A. Tchoffor, K. O. Davidsson and H. Thunman, Energy Fuels, 2013, 27, 7510–7520 CrossRef CAS.
- S. C. van Lith, V. Alonso-Ramírez, P. A. Jensen, F. J. Frandsen and P. Glarborg, Energy Fuels, 2006, 20, 964–978 CrossRef CAS.
- H. Zhao, Q. Song, X. Wu and Q. Yao, Energy Fuels, 2015, 29, 6404–6411 CrossRef CAS.
- J. R. Dodson, A. J. Hunt, V. L. Budarin, A. S. Matharu and J. H. Clark, RSC Adv., 2011, 1, 523–530 RSC.
- H. Fatehi, Y. He, Z. Wang, Z. S. Li, X. S. Bai, M. Alden and K. F. Cen, Proc. Combust. Inst., 2015, 35, 2389–2396 CrossRef CAS.
- T. Sorvajärvi, N. DeMartini, J. Rossi and J. Toivonen, Appl. Spectrosc., 2014, 68, 179–184 CrossRef PubMed.
- H. Chen, X. Chen, Z. Qiao and H. Liu, Fuel, 2016, 167, 31–39 CrossRef CAS.
- D. Keown, G. Favas, J. Hayashi and C. Li, Bioresour. Technol., 2005, 96, 1570–1577 CrossRef CAS PubMed.
- J. Long, H. Song, X. Jun, S. Sheng, S. Lun-shi, X. Kai and Y. Yao, Bioresour. Technol., 2012, 116, 278–284 CrossRef CAS PubMed.
- C. Du, L. Liu and P. Qiu, RSC Adv., 2017, 7, 10397–10406 RSC.
- M. U. Rahim, X. Gao and H. Wu, Proc. Combust. Inst., 2015, 35, 2891–2896 CrossRef CAS.
- H. Watanabe, K. Shimomura and K. Okazaki, Proc. Combust. Inst., 2015, 35, 2423–2430 CrossRef CAS.
- A. Kosminski, D. P. Ross and J. B. Agnew, Fuel Process. Technol., 2006, 87, 943–952 CrossRef CAS.
- A. Anca-Couce, Prog. Energy Combust. Sci., 2016, 53, 41–79 CrossRef.
- A. Jensen, K. Dam-Johansen, M. A. Wójtowicz and M. A. Serio, Energy Fuels, 1998, 12, 929–938 CrossRef CAS.
- T. Khazraie Shoulaifar, N. DeMartini, O. Karlstr and M. Hupa, Fuel, 2016, 165, 544–552 CrossRef CAS.
- FactSage salt database, http://www.crct.polymtl.ca/FACT/documentation/.
| This journal is © The Royal Society of Chemistry 2017 |

