 Open Access Article
Construction of 3D metal–organic frameworks bearing heteropolyoxometalate units and multi-azole molecules and exploration of their photocatalytic activities†
Chunhua Gongab,
Xianghua Zenga,
Li Xina,
Junyong Zhang*a and
Jingli Xie a
a
aCollege of Biological, Chemical Science and Engineering, Jiaxing University, Jiaxing 314001, P. R. China. E-mail: zhangjy@mail.zjxu.edu.cn
bState Key Laboratory of Structural Chemistry, Fujian Institute of Research on the Structure of Matter, Chinese Academy of Sciences, Fuzhou 350002, P. R. China
First published on 24th July 2017
Abstract
Taking advantage of multi-azole molecules as organic linkers, two novel 3D metal–organic frameworks consisting of heteropolyoxometalate building blocks, i.e., [Cu5(1,4-ttb)4(CrMo6(OH)6O18)(H2O)8]·10H2O (1) and [Cu4(1,4-ttb)4(SiW12O40)(H2O)8]·4H2O (2) (1,4-ttb = 1-(tetrazo-5-yl)-4-(triazo-1-yl)benzene) have been fabricated and characterized via X-ray single-crystal diffraction, FT-IR spectroscopy, powder X-ray diffraction (PXRD) and TG analyses. Compounds 1 and 2 both possess pillared-layer 3D frameworks which were based on POM units and different Cu–tetrazolate motifs. Compound 1 is a (2,6,6)-connected 3D framework constructed from the 2D networks {Cu5(1,4-ttb)4(H2O)8}n through connected CrMo6 polyoxoanions with (32.42.52.68.8)(34.44.54.63) topology. Compound 2 is a (2,3,5)-connected 3D framework constructed from the 2D wave layers {Cu4(1,4-ttb)4(H2O)8} through connected SiW12 polyoxoanions with (4.82)2(42.64.82.102)(8) topology. Magnetism studies of compound 1 reveal the dominant antiferromagnetic coupling between the Cu(II) ions. The electrochemistry properties of compound 2 were studied. Intriguingly, compounds 1 and 2 display considerable photocatalytic activities for the degradation of several organic dyes.
Introduction
Polyoxometalates (POMs) have attracted overwhelming interest because of the richness of structural characters and potential applications in catalysis, photochemistry and electrochemistry.1 As basic inorganic oxygen-cluster units, POMs have large amounts of terminal O atoms (Ot) and bridging O atoms (Ob), and could act as building blocks to construct fascinating metal–organic frameworks (MOFs) with new functional properties.2 By introducing the rigid ligands to serve as bridging units, namely organic ligands combine with inorganic oxygen-cluster units, it is anticipated that significantly POM-based framework materials could be achieved due to the variety of coordination sites of this type of ligand. In this regard, the selection of bridging ligands is still the key factor in the effective synthesis of POM-based MOFs. Multi-azole organic molecules with more adjacent coordination sites, such as triazole and tetrazole derivatives, can link metal ions and promote the formation of multinuclear metal clusters, and the generation of multinuclear metal clusters may also endow compounds a number of significant intrinsic properties such as magnetic properties and multifunctional properties. Among them, 1-(tetrazo-5-yl)-4-(triazo-1-yl)benzene (1,4-ttb) has been exploited to construct a series of metal–organic coordination compounds.3 However, to the best of our knowledge, the combination of this type of rigid ligand and POMs units remains scarce. Peng's group has obtained some particularly interesting POMs-based MOFs by using the rigid 5-(4-imidazol-1-yl-phenyl)-2H-tetrazole as linkers, and they studied the fluorescence and electrochemical properties of the compounds.4 Sun's group used rigid ligands such as 5′-(pyridin-2-yl)-1H,2′H-3,3′-bi(1,2,4-triazole), 1-(tetrazo-5-yl)-4-(triazo-1-yl)benzene and 3,3′,5,5′-tetramethyl-4,4-bipyrazole and synthesized four Preyssler P5W30-based MOFs, and the magnetism property, electrocatalytic abilities toward the reduction of hydrogen peroxide and the catalytic activities in the cyanosilylation of aldehydes reaction were investigated.5 These results have demonstrated the potential of constructing POMs-based MOFs by virtue of 1,4-ttb ligand, and exploring the diversity of structural characters of POMs under different experimental conditions, and furthermore, enabling the formation of a series of promising functional materials.Herein we reported two novel copper-based compounds with 1,4-ttb ligand and different hetero-POMs, namely, [Cu5(1,4-ttb)4(CrMo6(OH)6O18)(H2O)8]·10H2O (1) and [Cu4(1,4-ttb)4(SiW12O40)(H2O)8]·4H2O (2). Those two compounds both display POM-based pillared-layer 3D frameworks modified by different Cu–tetrazolate motifs. Compound 1 is a (2,6,6)-connected 3D framework constructed from the 2D networks {Cu5(1,4-ttb)4(H2O)8}n through connected CrMo6 polyoxoanions with (32.42.52.68.8)(34.44.54.63) topology. Compound 2 is a (2,3,5)-connected 3D framework constructed from the 2D wave layers {Cu4(1,4-ttb)4(H2O)8} through connected SiW12 polyoxoanions with (4.82)2(42.64.82.102)(8) topology. The magnetic property of compound 1 and the electrochemistry property of compound 2 were explored. In addition, in the aqueous solution of three organic dyes, the photodegradation effect of 1 and 2 were investigated, and intriguingly, they display considerable photocatalytic activities.
Experimental
Materials and general methods
All the chemicals were received as reagent grade and used without any further purification. Na3[CrMo6(OH)6O18]·8H2O were synthesized according to literatures.6 The IR spectra were obtained on a Varian 640 FT-IR spectrometer with KBr pellet in 400–4000 cm−1 region. Powder X-ray diffraction (PXRD) was performed on a DX-2600 spectrometer. The thermal gravimetric analyses (TGA) were carried out in flowing N2 on a SDT 2960 differential thermal analyzer with a rate of 10 °C min−1. Variable-temperature direct current (DC) magnetic susceptibility data down to 2 K on microcrystalline samples were carried out on a Quantum Design MPMP-XL7 superconducting quantum interference device (SQUID) magnetometer equipped with a 7 T DC magnet. Cyclic voltammograms were obtained with a CHI 440A electrochemical workstation at room temperature. Platinum wire was used as a counter electrode and Ag/AgCl electrode was as a reference electrode. Chemically bulk-modified carbon paste electrode (CPE) was used as the working electrode. The UV experiments were carried out on a Thermo EV 201CP.Notably, the successful synthesis of 1, rely on the finding that the addition of 1,4-diazabicyclo[2.2.2]octane (DABCO) can affect the synthetic process. Although the DABCO is not involved into the final product, it may play the role as the template during the reaction process which are supported by several initial experiments: (1) in absence of DABCO, no crystalline materials of 1 could be observed; (2) decrease the amount of DABCO to one-quarter or one-half of the original value only lead to very few tiny crystalline 1.
X-ray crystallographic study
X-ray diffraction analysis data for compounds 1–2 were collected with an Oxford Diffraction Gemini R Ultra diffractometer with graphite-monochromated Mo-Kα (λ = 0.71073 Å) at 296 K. All structures were solved by direct methods and refined on F2 by full-matrix least-squares methods using the SHELXTL package.8 In the structure of compound 1, the solvate water molecules are heavily disordered over multiple positions, and this electron density was modeled using a squeeze routine implemented in PLATON.9 A summary of the crystal data and structure refinements of compounds 1–2 are provided in Table 1. Selected bond lengths and angles are listed in Table S1 in the ESI.† Crystallographic data for compounds 1–2 have been deposited in the Cambridge Crystallographic Data Center, their crystal structures can be obtained with CCDC reference numbers 1497463 and 1497464, respectively.| Compound 1 | Compound 2 | |
|---|---|---|
| a R1 = Σ||Fo| − |Fc||/Σ|Fo|.b wR2 = Σ[w(Fo2 − Fc2)2]/Σ[w(Fo2)2]1/2. | ||
| Empirical formula | C36H30N28O31Cu5CrMo6 | C36H48N28O52Cu4SiW12 |
| Formula weight | 2296.22 | 4193.47 |
| Crystal system | Triclinic | Monoclinic |
| Space group | P![[1 with combining macron]](https://www.rsc.org/images/entities/char_0031_0304.gif) |
P21/n |
| a (Å) | 12.8771(6) | 10.8478(3) |
| b (Å) | 13.4775(6) | 13.1152(3) |
| c (Å) | 13.5993(5) | 27.6434(6) |
| α (°) | 107.916(4) | 90.00 |
| β (°) | 103.921(3) | 98.886(2) |
| γ (°) | 112.783(4) | 90.00 |
| V (Å3) | 1888.46(15) | 3885.65(16) |
| Z | 1 | 2 |
| Dc (g cm−3) | 2.019 | 3.584 |
| μ (mm−1) | 2.567 | 18.886 |
| F (000) | 1111.0 | 3788.0 |
| Reflections collected | 13![[thin space (1/6-em)]](https://www.rsc.org/images/entities/char_2009.gif) 711 711 |
17![[thin space (1/6-em)]](https://www.rsc.org/images/entities/char_2009.gif) 362 362 |
| Independent reflections | 6634 | 6846 |
| Rint | 0.0179 | 0.0266 |
| GOOF | 1.060 | 1.050 |
| R1, wR2[I ≥ 2σ(I)] | 0.0317, 0.0813 | 0.0868, 0.1857 |
| R1, wR2[all data] | 0.0367, 0.0841 | 0.0903, 0.1870 |
Results and discussion
Description of the crystal structures
![[1 with combining macron]](https://www.rsc.org/images/entities/char_0031_0304.gif) , and the crystal structure consists of one [CrMo6(OH)6O18]3− (abbreviated as CrMo6) polyoxoanion, four 1,4-ttb ligands, five copper ions, eight coordination water molecules and ten crystallization water molecules. Bond valence sum calculations10 show that all molybdenum atoms are in the +6 oxidation state, and copper atoms are in the +2 oxidation state.
, and the crystal structure consists of one [CrMo6(OH)6O18]3− (abbreviated as CrMo6) polyoxoanion, four 1,4-ttb ligands, five copper ions, eight coordination water molecules and ten crystallization water molecules. Bond valence sum calculations10 show that all molybdenum atoms are in the +6 oxidation state, and copper atoms are in the +2 oxidation state.As shown in Fig. 1, there are three crystallographically independent Cu ions with two kinds of coordination modes in the structure of compound 1. Cu1 ion is six-coordinated in a octahedral geometry by two O atoms from two CrMo6 polyoxoanions and four N atoms from 1,4-ttb ligands. Similarly, Cu2 ion is six-coordinated in a distorted octahedral geometry by two N atoms from two 1,4-ttb ligands and four O atoms from water molecules. While Cu3 ion is five-coordinated by three N atoms from two tetraazole and a trizole in three different 1,4-ttb ligands and two O atoms from two water molecules to form a square pyramidal geometry. The bond lengths ranges of Cu–O and Cu–N are 1.915(3)–2.307(3) Å and 1.955(3)–2.137(5) Å, respectively (Table S1†).
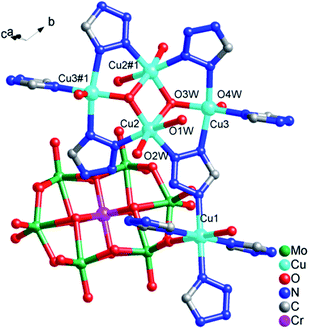 | ||
| Fig. 1 The coordination modes of Cu ions in compound 1. The hydrogen atoms are omitted for clarity. Symmetry codes: #1 1 − x, 2 − y, −z. | ||
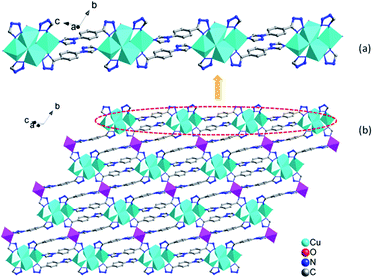
In 1, four Cu ions (two Cu2, two Cu3 ions) are aggregated by tetrazolyl groups, forming a tetra-nuclear subunit. The tetra-nuclear subunits are linked together via 1,4-ttb ligands, forming an infinite {Cu4(1,4-ttb)4}n chains (Fig. 2a). Furthermore, these chains are bridged via Cu1 ions coordinated by two N atoms from the remaining triazole groups from adjacent chains to form an interesting 2D network {Cu5(1,4-ttb)4}n (Fig. 2b).
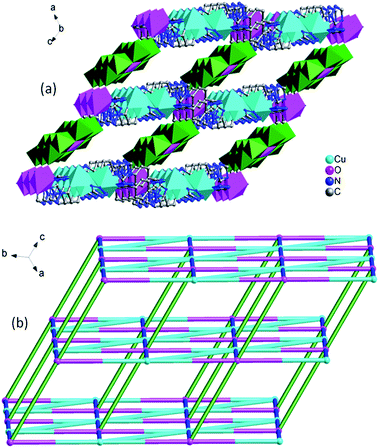
The 3D framework structure of compound 1 is constructed from the 2D networks through covalently connected CrMo6 polyoxoanion (Fig. 3a). Each CrMo6 polyoxoanion from a framework offers two terminal oxygen atoms to coordinate to Cu1 ions from neighboring networks. Considering {Cu4(1,4-ttb)4}n chain and Cu1 ion as six-connected nodes, the CrMo6 polyoxoanion as two-connected nodes, as a result, compound 1 is a (2,6,6)-connected 3D framework with (32.42.52.68.8)(34.44.54.63) topology (Fig. 3b).
In compound 2, there are two crystallographically independent Cu ions (Fig. 4). Cu1 is coordinated by four N atoms from four 1,4-ttb ligands, one O atom from one SiW12 polyoxoanion and one O atom from water molecule. Cu2 is five-coordinated by two N atoms from two 1,4-ttb ligands and three O atoms from three water molecules. The corresponding bond lengths ranges of Cu–O and Cu–N are 1.95(3)–2.367(18) Å and 1.96(2)–2.10(2) Å, respectively (Table S1†).
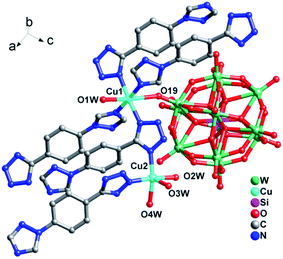 | ||
| Fig. 4 Ball/stick/polyhedral view of the asymmetric unit of compound 2. The hydrogen atoms and crystallization water molecule are omitted for clarity. | ||
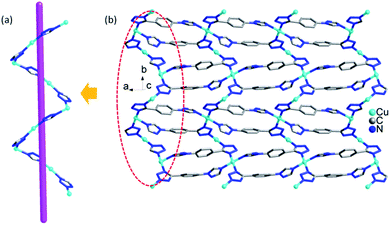
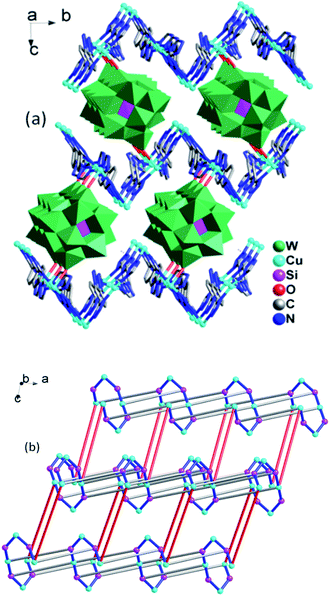
In compound 2, the 1D left-hand chain is formed from Cu ions bridged by tetrazolyl groups from 1,4-ttb ligand (Fig. 5a). Furthermore, the chains are connected by the 1,4-ttb ligand to generate a 2D wave layer (Fig. 5b). Finally, each SiW12 polyoxoanion offers two O atoms to connect Cu ions from two neighboring layer to extend the layers into a 3D framework structure (Fig. 6a). Considering Cu2 ions as two-connected nodes, the 1,4-ttb ligand as three-connected nodes, the Cu1 ions as five-connected nodes, as a result, compound 2 is a (2,3,5)-connected 3D framework with (4.82)2(42.64.82.102)(8) topology (Fig. 6b).
FT-IR spectra, powder X-ray diffraction (PXRD) and TG analyses
The IR spectra of compound 1 and 2 are shown in Fig. S1.† For compound 1, the bands at 947, 916, 839, 643 and 562 cm−1 could be ascribed to the characteristic peaks of υas (Mo–O), υas (Cr–O), υas (Mo–O–Mo), υas (Mo–O–Cr). For compound 2, the bands at 967, 921, 842, 651 and 564 cm−1 could be ascribed to the characteristic peaks of υas (Si–O), υas (W–O), υas (W–O–W). The absorption peaks at 1609–1159 cm−1 for 1 and 1689–1196 cm−1 for 2 are assigned to the vibrations of C–N, C![[double bond, length as m-dash]](https://www.rsc.org/images/entities/char_e001.gif) C, N
C, N![[double bond, length as m-dash]](https://www.rsc.org/images/entities/char_e001.gif) N of 1,4-ttb ligand. In addition, a broad band around 3400 cm−1 should be attributed to the vibration of O–H in water molecules.
N of 1,4-ttb ligand. In addition, a broad band around 3400 cm−1 should be attributed to the vibration of O–H in water molecules.
To testify the phase purities of compound 1 and 2, PXRD experiments were carried out. As shown in Fig. S2,† the diffraction peaks of both simulated and experimental patterns match well in the key positions, which indicate that the powders of the two compounds are single phase. The intensity differences can be owed to the different orientation of the powder samples.
The thermal stabilities of compounds 1 and 2 were measured in flowing N2 from room temperature to 800 °C with a heating rate of 10 °C min−1. As shown in Fig. S3,† both curves show two-step weight loss processes. In compound 1, the first weight loss of 8.51% (calc. 8.62%) occurs before 182 °C, which is attributed to the loss of water molecules. For compound 2, it starts to lose weight at 173 °C with the weight loss of 3.08% (calc. 3.43%), which is corresponding to the loss of water molecules. The second weight losses of compounds 1 and 2 are ascribed to the decomposition of 1,4-ttb ligands.
Magnetic property of compound 1
The variable-temperature magnetic susceptibility of 1 was measured from 1.8 to 310 K at 2000 Oe, owing to the butterfly trinuclear complex units. As shown in Fig. 7, the χmT value at 300 K was 3.02 emu mol−1 K, which was larger than the spin-only value of 1.52 emu mol−1 K for the uncorrelated four Cu(II) (S = 1/2) with g = 2.00. Upon cooling, with decreasing temperature, the χmT value gradually decreases and reaches a minimum value of 1.31 emu mol−1 K at 3 K and then slightly increases to 1.36 emu mol−1 K at 1.8 K. The χmT vs. T plot in the temperature range of 3–300 K indicates dominant antiferromagnetic coupling between the Cu(II) ions.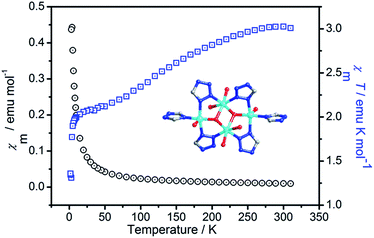 | ||
| Fig. 7 Temperature-dependent magnetic susceptibility of compound 1 in the temperature range of 2–300 K under an applied field of 2000 Oe. | ||
Electrochemical property of 2-CPE
The electrochemical property of 2-CPE has been investigated in detail in 0.5 M Na2SO4 + 0.1 M H2SO4 aqueous solution. In the potential range from −800 to −100 mV, there are three pairs of reversible redox peaks (I–I′, II–II′, III–III′) for compound 2 (Fig. 8a), which could be assigned to the redox process of SiW12 anion.11 The mean peak potentials E1/2 = (Ecp + Eap)/2 are −230, −480 and −730 mV, respectively. In addition, when the scan rates vary ranges of 50–500 mV s−1, the peak potentials change gradually: the cathodic peak potentials shift toward the negative direction and the corresponding anodic peak potentials to the positive direction. As shown in Fig. 8b, the peak currents are proportional to the scan rates, which shows that the redox process of 2-CPE are surface-controlled.12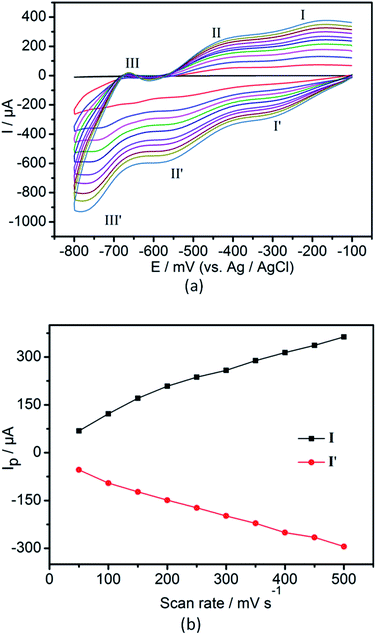 | ||
| Fig. 8 (a) Cyclic voltammogram of 2-CPE in 0.5 M Na2SO4 + 0.1 M H2SO4 aqueous solution. Potentials measured vs. Ag/AgCl (from inside to out: 50, 100, 150, 200, 250, 300, 350, 400, 450, 500 mV s−1). | ||
Photocatalytic activity
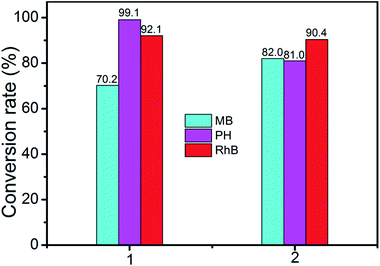
A wide range of POMs-based MOFs possess photocatalytic activities in the degradations of organic dyes under light irradiation.13 Hence, we also investigated the photocatalytic performance of compounds 1 and 2 for the photodegradation of methylene blue (MB), pararosaniline hydrochloride (PH), and rhodamine B (RhB) with UV irradiation through a typical process: compounds 1 (15 mg) and 2 (15 mg) were respectively added into the 50 mL aqueous solution of MB, Ph, and RhB, then the obtained suspensions were magnetically stirred in the dark for about 15 min to ensure the equilibrium of working solution (for control experiments under the same reaction conditions without any catalyst). The solution was then exposed to UV irradiation from a 100 W Hg lamp (λ = 365 nm). The solution was kept stirring during irradiation. At given time intervals, 3 mL of sample was taken out for analysis.Compared to the blank experiments under the same conditions, it is obvious that the absorption peak of MB, PH, and RhB decreased significantly as time goes by in the presence of compounds 1 and 2 (Fig. 9 and Fig. S4†). As shown in Fig. S5,† changes of the concentration of MB, PH, and RhB solution were plotted versus irradiation time. The conversions rate of dyes can be expressed as α = (C0 − Ct)/C0, where C0 represents the UV-vis intensity of dye at the original reaction time (t = 0), Ct is the UV-vis absorption intensity at a certain irradiation time (t). As shown in Fig. 10, the conversion rate of MB is 70.2% for 1 and 82.0% for 2 after irradiation for 3 h. The conversion of PH is 99.1% for 1 and 81% for 2. The conversion of RhB is 92.1% for 1 and 90.4% for 2. The results demonstrate that compounds 1 and 2 are good candidates for photocatalytic degradation of MB, PH and RhB.
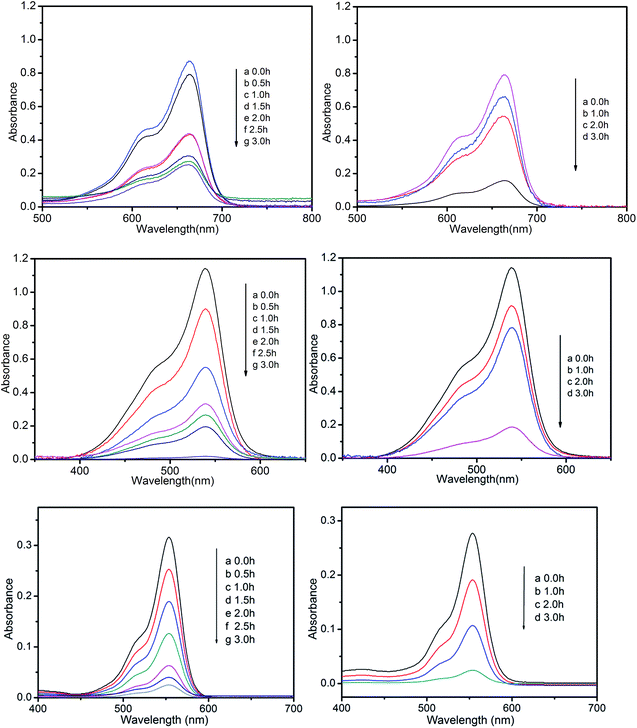 | ||
| Fig. 9 Photocatalytic decomposition of MB, PH, and RhB solution under UV with the use of compounds 1 (left) and 2 (right). | ||
Conclusions
In conclusion, two new heteropolyoxometalates-directed 3D metal–organic frameworks were synthesized by hydrothermal method. Compounds 1 and 2 both display POM-based pillared-layer 3D frameworks modified by different Cu–tetrazolate motifs. In the structures, compound 1 is a (2,6,6)-connected 3D framework constructed from the 2D networks {Cu5(1,4-ttb)4(H2O)8}n through connected CrMo6 polyoxoanions with (32.42.52.68.8)(34.44.54.63) topology. Compound 2 is a (2,3,5)-connected 3D framework constructed from the 2D wave layers {Cu4(1,4-ttb)4(H2O)8} through connected SiW12 polyoxoanions with (4.82)2(42.64.82.102)(8) topology. The magnetic measurement of compound 1 indicates the presence of dominant antiferromagnetic coupling between magnetic centers. The electrochemistry property of compound 2 is studied. In addition, compounds 1 and 2 display excellent photocatalytic activities for the degradation of several organic dyes. This work provides useful information for the design and construction of multifunctional heteropolyoxometalates-directed 3D metal–organic frameworks with various architectures.Acknowledgements
Financial support from the National Natural Science Foundation of China (21371078, 21401077) and the open research fund of FJIRSM, CAS (20170034) is gratefully acknowledged.Notes and references
- (a) W. Salomon, G. Paille, M. Gomez-Mingot, P. Mialane, J. Marrot, C. Roch-Marchal, G. Nocton, C. Mellot-Draznieks, M. Fontecave and A. Dolbecq, Cryst. Growth Des., 2017, 17, 600 CrossRef; (b) S. J. Folkman and R. G. Finke, ACS Catal., 2017, 7, 7 CrossRef CAS; (c) D. Ravelli, S. Protti and M. Fagnoni, Acc. Chem. Res., 2016, 49, 2232 CrossRef CAS PubMed; (d) R. Kawahara, R. Osuga, J. N. Kondo, N. Mizuno and S. Uchida, Dalton Trans., 2017, 46, 3105 RSC; (e) R. Khoshnavazi, L. Bahrami, F. Havasi and E. Naseri, RSC Adv., 2017, 7, 11510 RSC; (f) T. K. N. Luong, I. Govaerts, J. Robben, P. Shestakova and T. N. Parac-Vogt, Chem. Commun., 2017, 53, 617 RSC; (g) J. Fielden, J. M. Sumliner, N. N. Han, Y. V. Geletii, X. Xiang, D. G. Musaev, T. Q. Lian and C. L. Hill, Chem. Sci., 2015, 6, 5531 RSC.
- (a) A. Proust, B. Matt, R. Villanneau, G. Guillemot, P. Gouzerh and G. Izzet, Chem. Soc. Rev., 2012, 41, 7605 RSC; (b) S. Sadjadi and M. M. Heravi, Curr. Org. Chem., 2016, 20, 1404 CrossRef CAS; (c) J. J. Walsha, A. M. Bondb, R. J. Forstera and T. E. Keyesa, Coord. Chem. Rev., 2016, 306, 217 CrossRef.
- (a) Y. F. Hui, C. L. Kang, T. Tian, S. Dang, J. Ai, C. Liu, H. R. Tian, Z. M. Sun and C. Y. Gao, CrystEngComm, 2017, 19, 1564 RSC; (b) M. Song, B. Mu and R. D. Huang, J. Solid State Chem., 2017, 246, 1 CrossRef CAS; (c) X. L. Hu, X. X. Yang, X. Q. He and Z. M. Sun, Inorg. Chem. Commun., 2017, 77, 35 CrossRef CAS.
- (a) X. Wang, J. Peng, K. Alimajea and Z. Y. Shi, CrystEngComm, 2012, 14, 8509 RSC; (b) Z. Y. Shi, Z. Y. Zhang, J. Peng, X. Yua and X. Wang, CrystEngComm, 2013, 15, 7199 RSC; (c) Z. Y. Shi, J. Peng, Z. Y. Zhang, X. Yu, K. Alimaje and X. Wang, Inorg. Chem. Commun., 2013, 33, 105 CrossRef CAS.
- T. P. Hu, Y. Q. Zhao, Z. Jagličić, K. Yu, X. P. Wang and D. Sun, Inorg. Chem., 2015, 54, 7415 CrossRef CAS PubMed.
- (a) A. Beni, A. Dei, S. Laschi, M. Rizzitano and L. Sorace, Chem.– Eur. J., 2008, 14, 1804 CrossRef CAS PubMed; (b) A. Perloff, Inorg. Chem., 1970, 9, 2228 CrossRef CAS.
- X. L. Wang, Z. H. Kang, E. B. Wang and C. W. Hu, Mater. Lett., 2002, 56, 393 CrossRef CAS.
- G. M. Sheldrick, Acta Crystallogr., Sect. A: Found. Crystallogr., 2008, 64, 112 CrossRef CAS PubMed.
- J. T. Shi, K. F. Yue, B. Liu, C. S. Zhou, Y. L. Liu, Z. G. Fang and Y. Y. Wang, CrystEngComm, 2014, 16, 3097 RSC.
- I. D. Brown and D. Altermatt, Acta Crystallogr., Sect. B: Struct. Sci., 1985, 41, 244 CrossRef.
- (a) X. L. Wang, H. L. Hu, A. X. Tian, H. Y. Lin and J. Li, Inorg. Chem., 2010, 49, 10299 CrossRef CAS PubMed; (b) X. L. Wang, J. Li, A. X. Tian, D. Zhao, G. C. Liu and H. Y. Lin, Cryst. Growth Des., 2011, 11, 3456 CrossRef CAS.
- X. L. Wang, F. F. Sui, H. Y. Lin, J. W. Zhang and G. C. Liu, Cryst. Growth Des., 2014, 14, 3438 CAS.
- (a) C. H. Gong, X. H. Zeng, C. F. Zhu, J. H. Shu, P. X. Xiao, H. Xu, L. C. Liu, J. Y. Zhang, Q. D. Zeng and J. L. Xie, RSC Adv., 2016, 6, 106248 RSC; (b) X. P. Sun, Z. J. Liang, P. T. Ma, R. Ban, M. S. Jiang, D. D. Zhang, J. P. Wang and J. Y. Niu, Dalton Trans., 2015, 44, 17544 RSC; (c) P. P. Zhu, L. J. Sun, N. Sheng, J. Q. Sha, G. D. Liu, L. Yu, H. B. Qiu and S. X. Li, Cryst. Growth Des., 2016, 16, 3215 CrossRef CAS; (d) Y. M. Chen, Y. H. Yu, H. Z. Zhang, G. F. Hou, J. S. Gao and P. F. Yan, CrystEngComm, 2016, 18, 6389 RSC.
Footnote |
| † Electronic supplementary information (ESI) available: Table of selected bond lengths and angles, IR, PXRD, TG, and additional figures. CCDC 1497463 and 1497464. For ESI and crystallographic data in CIF or other electronic format see DOI: 10.1039/c7ra05210c |
| This journal is © The Royal Society of Chemistry 2017 |

