 Open Access Article
An experimental study on the effects of freeze–thaw cycles on phosphorus adsorption–desorption processes in brown soil
Qingzhi Wangab,
Jiankun Liu*b and
Lingqing Wang *c
*c
aQinghai Research Institute of Transportation, Qinghai 810016, China
bBeijing Jiaotong University, School of Civil Engineering, Beijing 100044, China. E-mail: jkliu@bjtu.edu.cn
cInstitute of Geographical Sciences and Natural Resources Research, Chinese Academy of Sciences, Beijing 100101, China. E-mail: wanglq@igsnrr.ac.cn
First published on 28th July 2017
Abstract
Freeze–thaw cycles (FTCs) can strongly influence the physical and chemical properties of soils in cold regions, which can in turn affect the adsorption–desorption characteristics of phosphorus (P) in the soil. In this study, a series of one-dimensional laboratory freeze–thaw experiments were conducted to determine the adsorption–desorption behavior of P in soil. Results showed that greater numbers of FTCs were associated with a decrease in the adsorption capacity of P in soil. Langmuir and Freundlich equations were adopted to fit the isothermal adsorption curves of P in soil. Values of the critical fitting constant indicated that FTCs weakened the absorption capacity of P in soil. At identical concentrations of exogenous P, the P desorption ratio for soil samples treated with FTCs was greater compared with the ratio measured in untreated soil.
1. Introduction
Seasonal freeze–thaw cycles (FTCs) in soil are common events in the cold regions of middle latitudes. The regions affected by FTCs account for 50% of the world's land area.1–3 Repeated FTCs can produce strong effects on soil physical properties, such as soil density, moisture distribution, and aggregate stability.4,5 Meanwhile, fluctuations in soil temperature and soil structural damage induced by FTCs may result in changes to the soil environment and nutrient dynamics.3,6There has been increasing interest recently regarding how changes in soil freeze–thaw cycles initiated by global warming may influence soil nutrient dynamics and microbial activity or composition.7,8 The impacts of FTC on soil include migration of moisture, redistribution of temperature fields, and changes in soil structures, as well as changes in microbial activity and mineralization rates of organic matter.9–11 The extent of FTC impacts on soil physical and chemical properties depends on factors such as the freezing–thawing cycle times, temperature, moisture content and organic matter content.12–14 Previous studies have observed significant increases in dissolved organic carbon release from soils of various ecosystems following FTCs.8,15,16
Phosphorus (P) is a major limiting factor for plant growth and the rate of P uptake and utilization by plants largely determines the final crop yield. The surface soil environment is sensitive to climate change and is highly sensitive to changes in permafrost and seasonally frozen ground cover. Alternative freezing and thawing of soils in cold regions may influence the rates of P cycling in soils due to the physicochemical and/or biological effects.5,17,18 The freeze–thaw events may increase the rate of P loss and potentially impact soil P availability and ecosystem productivity.19–22
Most previous research has focused on the physical and mechanical properties of frozen soils, and the effects of freeze–thaw cycling on P dynamics are still poorly understood. The extent of the effects of freeze–thaw cycles on soil processes has also not been studied in detail. Effects on soils may accumulate or dissipate with repeated cycles, as P cycling is often disguised by relatively faster P sorption into soil particles. In this study, a controlled incubation experiment was designed to study the impact of FTCs of varying amplitude on the adsorption and desorption of P in soil. The results of this study provide a framework for understanding the influence of FTC mechanisms on soil ecological processes in seasonally frozen regions.
2. Materials and methods
2.1. Soil samples
The brown soil samples were collected from the northeastern region of China in Benxi City, Liaoning Province (41°22′51′′N and 123°48′04′′E). This area is characterized by a continental climate of a northern temperate zone and experiences an annual mean temperature of 7.4 °C and annual precipitation of 821 mm. Winter in this region extends from November to the following March, with a 50 year average minimum winter temperature of −10.3 °C. The spring thaw period ranges from March to April, with a mean temperature of 8.1 °C. The soil is classified as Haplic Alisol according to the FAO-UNESCO soil legend. Some relevant properties of the soils are presented in Table 1.| Soil particle size (%) | Organic matter% | Total P | Olsen P | pH | Fe | Al | Ca | ||
|---|---|---|---|---|---|---|---|---|---|
| <0.002 mm | 0.002–0.02 mm | >0.02 mm | mg kg−1 | g kg−1 | |||||
| 26.7 | 23.5 | 49.8 | 11.5 | 668.3 | 23.7 | 6.7 | 26.9 | 30.8 | 5.5 |
2.2. Freeze–thaw experiment
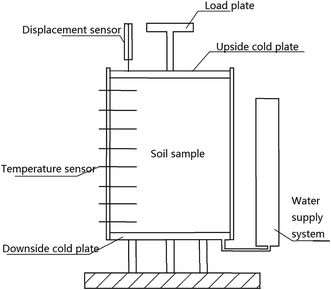
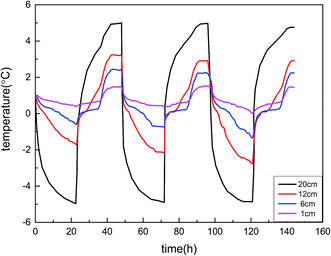
The FTC experimental apparatus was comprised of a sample cell, upside and downside cold plates, constant temperature cold baths, cotton insulation, temperature sensors, and a data acquisition system, as shown in Fig. 1. The sample cell was constructed of glass with internal a dimension of 20 cm (height) × 15 cm (diameter). Two cold plates were placed in the upside (cold side) and downside (warm side) of the soil sample. Each cold plate was connected to a constant temperature cold bath in order to simulate unidirectional freezing conditions observed in the field. The insulation cotton was wrapped around the sample cell in order to reduce heat exchange between samples and external environment. The temperature of the constant temperature cold bath was controlled to an accuracy of 0.1 °C by a computer. Constant temperature antifreeze was circulated around the upside and downside cold plates with the cold bath to maintain a specific soil sample temperature. During the experiments, the temperature sensors were installed inside the samples. Since the environmental temperature was critical to the accuracy of the tests, experiments were conducted in a homoeothermic room with a dimension of 3.0 m (length) × 3.0 m (width) × 2.2 m (height). The temperature inside the room was maintained at 1 °C.The results of standard heave compaction test showed that the maximum dry density was 2.2 g cm−3 and the optimum mass water content was about 10%. Thus, we chose 10% mass water content to get the best compaction. During the FTCs experiments, there was obvious frost heave amount and the thawing settlement appeared when the temperature was −5 to +5 °C. The internal temperature of the samples (mass water content 10%, cooling temperature −5 °C, and compactness 0.95) varied with time during the freezing–thaw process, which was tracked by a temperature data taker (DT80), and the frost heave amount and thawing settlement were tracked by a displacement meter.
The FTC experiments involved two processes: a freezing process and a thawing process. At first, the two cold baths were set to 1 °C for 8 hours to ensure that the internal temperature of the samples reached thermal balance and the temperature field becomes stable, at which point the freezing process was initiated. During the freezing process, the upside bath plate was set to the required cooling temperature (−5 °C) by adjusting the constant temperature cold bath. After 24 hours, the thawing process was initiated at a temperature of +5 °C and also maintained for 24 hours. Different repetitive multiple FTC cycles were used at the following times: 0, 1, 3, 5 and 10 (labeled F0, F1, F3, F5 and F10). After the freezing–thawing process, the samples were removed immediately, analyzed for moisture distribution, and used in the subsequent P adsorption–desorption experiments.
2.3. Isothermal adsorption–desorption experiment
At the conclusion of FTC experiments, 5.000g of each soil sample passed through a 2 mm nylon sieve were distributed among 10 centrifuge tubes and 50 ml KH2PO4 solution containing different amounts of P (0, 2, 4, 10, 20, 30, 40, 60, 80, and 100 mg L−1) were added to each tube.23 The solutions were treated with a drop of chloroform to prevent bacterial growth. Soil suspensions were then shaken on a horizontal shaker for 24 h at 25 ± 1 °C. Subsequently, each of the solutions was separated from the solid phase by centrifugation at 5000 rpm for 10 min.24 The supernatants were decanted, filtered through 0.45 μm filters, and stored at 4 °C prior to analysis. After the adsorption experiments, 50 ml of CaCl2 solution (0.01 mol L−1, pH 7.0) were added to displace adsorbed P. The soil suspensions were shaken for 1 h at (25 ± 1) °C in a constant temperature shaker, separated by centrifugation at 5000 rpm for 10 min, filtered through a 0.45 mm membrane filter, and then analyzed spectrophotometrically for P content on a Tu-1810 UV-visible spectrophotometer (Beijing Purkinje General Instrument Co., Ltd., China) using the phosphomolybdate blue method (Murphy and Riley, 1962; He et al., 1998; Zheng et al., 2013).25–27 All measurements were carried out in duplicate.2.4. Data analysis
Adsorption isotherms models such as Langmuir and Freundlich describe solute adsorption by solids in aqueous solution at constant temperature and pressure. The P adsorption data for the soils used in this study were fit to the following adsorption equations:Langmuir adsorption equation:28
| C/Q = C/Qm + 1/(K1Qm), | (1) |
Freundlich adsorption equation:29
lg![[thin space (1/6-em)]](https://www.rsc.org/images/entities/char_2009.gif) Q = lg Q = lg![[thin space (1/6-em)]](https://www.rsc.org/images/entities/char_2009.gif) K2 + 1/n K2 + 1/n![[thin space (1/6-em)]](https://www.rsc.org/images/entities/char_2009.gif) lg lg![[thin space (1/6-em)]](https://www.rsc.org/images/entities/char_2009.gif) C, C,
| (2) |
3. Result and discussion
3.1. The freezing–thawing process
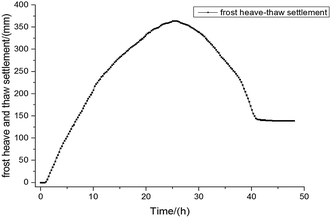
Fig. 2 showed the time history curve of soil temperature variation during the frost–thawing processes in the soil. The temperature ranged from −5 °C to +5 °C, and the temperature in the bottom kept at +1 °C. The duration of freezing process was 12 h, and the duration of thawing was 12 h. It can be seen that during the repeated frost–thawing process, the temperature of soil presents a periodic process, and at the same time, the internal temperature of showed a gradient increasing or decreasing with increases of depth.The extent of frost heave–thaw settlement over time is shown in Fig. 3. The fringe is a region of impeded flow caused by partial filling of soil pores by ice. The soil skeleton within the fringe expands when pressure in the ice exceeds the overburden pressure required to initiate separation of the soil skeleton. With sufficient ice pressure, the soil skeleton separates and a new ice lens forms. As shown in Fig. 3, at the beginning of the freezing, namely during the quick freezing and transition zones, soil frost heave deformation rapidly increased during this period. After ca. 20 hours, the migration of moisture to the ice lens decreased due to insufficient moisture supply in the closed system, as well as the low permeability of the frozen fringe, and the amount of frost heave stabilized. Upon thawing, the ice disappears and the soil skeleton must adapt itself to a new equilibrium void ratio. At first, the settling rate decreased rapidly and then plateaued after ca. 40 hours. These observations suggest that the ice within the frost front melted and filled the void completely, halting any further settling.
3.2. The isothermal adsorption characteristics of phosphorus with FTC
The adsorption characteristics of P in soil with different FTC numbers are shown in Fig. 4. The adsorption quantity of P increased with increasing equilibrium concentration. The variation rule of P adsorption were similar for different freeze–thaw cycles numbers. A distinct turning point in the isothermal adsorption curve was observed, which divided adsorption process into a rapid rise stage and slow rise stage. At lower equilibrium concentrations, the adsorption ratio was greater, indicating that most P in the solution had been adsorbed. When the equilibrium concentration increased, the P adsorption capacity became stable. P sorption capacity varies among soil types and depends on one or more soil properties.23 Previous studies demonstrated that P sorption is associated with various soil constituents, such as soil pH, organic matter (OM), aluminum (Al), iron (Fe) and calcium (Ca) in mineral form.30–32 These soil properties are often inter-related and had been identified to be important factors affecting the adsorption–desorption of soil P through different mechanisms.5,30,33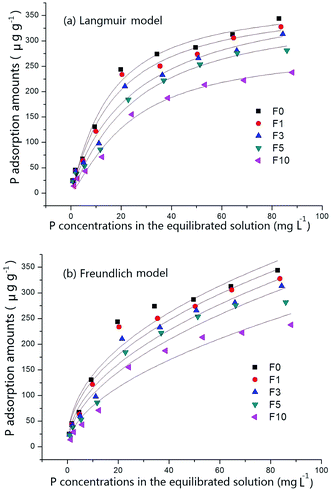 | ||
| Fig. 4 Langmuir and Freundlich isotherm model fitted for the adsorption of phosphorus with different freeze–thaw cycles. | ||
Compared with the untreated soil sample, the isothermal adsorption curve was smoother after FTC. The slope of the isothermal adsorption decreased significantly with increasing alternate FTC number, indicating that the P adsorption ability was weakened, which became more prominent with increasing FTC number. These results are generally consistent with previous studies that the freeze–thaw treated samples always adsorbed less P than the untreated samples, and the capacity of P adsorption decreased as the number of FTCs increased.10,13,34 Bechmann et al.20 reported that repeated freezing and thawing significantly increased water-extractable P and resulted in significantly elevated concentrations of dissolved P in runoff from manured soils. These observations may explain the adsorption mechanisms of P in soil: specific adsorption induced by exchange of ligands and non-specific adsorption caused by electrostatic attraction.32,35 During the freezing process, the moisture intake from the unfrozen zone likely occurred in the zone around the frost front where the moisture later crystallized. During the thawing process, the crystalized ice melted. These phenomena inevitably cause intense physical expansion and structural damage to the soil samples, in turn altering the size and stability of soil aggregates, specific surface area, and surface potential.14,22 The binding force between lower-energy sites and P became weaker, thus reducing the capacity of P adsorption in soil after FTCs.36
As shown in Fig. 4, the untreated soil (F0) had the highest maximum P adsorption. This soil likely possessed more stable physical and chemical properties and microbial activity in the absence of FTC.14,16 Since the P adsorption sites remained unsaturated and there was sufficient exogenous P, the adsorption capacity approached maximum value. Changes in temperature resulted in changes in soil structure, including changes in aggregate size, metal chelation, and mass death of original microorganisms, along with a significant decrease in P adsorption.10,20 As the FTC number increased, the soil physical and chemical properties and microbial activity stabilized, remaining microbes that had adapted to the environment consumed P compounds as energy source.19,34,37 This in turn led to a decrease in P adsorption capacity. It is also likely that P adsorption varied after FTC due to the greater amount of solid state ionic compounds released into soil solution following repeated FTC, which caused compacting of soil aggregates. These ions competed for adsorption sites around soil particles with P, possibly replacing the original P adsorbed on the surface of soil particles.
3.3. The isothermal adsorption equations and related parameters
Adsorption is closely related to nutrient retention and release. In order to identify the P adsorption mechanism in soil after FTC, Langmuir and Freundlich models were fit to the isothermal adsorption data (Table 2, Fig. 4). Fig. 4 illustrates that the experimental data of P adsorption were in good agreement with the Langmuir model and the Freundlich model. The correlation coefficients of the two equations ranged from 0.913 to 0.981, indicating that these two equations can accurately describe the isothermal adsorption characteristics of P in the tested soil.| Langmuir | Freundlich | |||||||
|---|---|---|---|---|---|---|---|---|
| Qm mg kg−1 | K1 L mg−1 | MBC L kg−1 | ΔG0 kg mol−1 | R2 | K2 | 1/n | R2 | |
| F0 | 400.48 | 0.061 | 24.29 | −18.69 | 0.971 | 31.77 | 0.577 | 0.974 |
| F1 | 389.11 | 0.056 | 21.70 | −18.47 | 0.972 | 29.48 | 0.580 | 0.976 |
| F3 | 377.93 | 0.048 | 18.14 | −18.09 | 0.948 | 27.06 | 0.577 | 0.981 |
| F5 | 364.43 | 0.042 | 15.21 | −17.76 | 0.913 | 23.38 | 0.591 | 0.981 |
| F10 | 333.67 | 0.030 | 9.99 | −16.93 | 0.921 | 13.44 | 0.686 | 0.981 |
The maximum adsorption amount (Qm) obtained from the Langmuir model reflects the size of the P pool.38,39 Soil can only provide nutrients to plants if the P pool reaches a certain capacity. Qm is also used to evaluate the risk of phosphorus releasing. At higher values of Qm, environmental risk is considered to be lower. The untreated soil (F0) isotherm provided the maximum Qm, and minimum Qm after 10 FTCs. Qm was found to decrease with increasing of FTC number. The amount and ratio of P adsorption also decreased significantly. Furthermore, the K and MBC values also decreased with increasing FTC number, suggesting that the binding ability of soil for P was weakened after FTC.
The adsorption equilibrium constant K1 is an important parameter which reflects soil affinity for P. The value of K1 decreased with increasing of FTC number (Table 2), suggesting that P adsorption in soil gradually decreased. The maximum soil buffer capacity, MBC, is a product of Qm and K1, and indicates the soil adsorption strength and capacity.40 Larger MBC values suggest stronger soil P adsorption. MBC values decreased with increasing FTC number, indicating that the continuous cycle of freezing and thawing reduced the P adsorption capacity.
Generally speaking, the physical adsorption free energy is less than the chemical adsorption energy.38 The former is approximately −20 kJ mol−1 to 0 kJ mol−1, while the latter ranges from −20 kJ mol−1 to 80 kJ mol−1.38,41 The ΔG0 values were less than 0, indicating that the adsorption was a spontaneous process (Table 2). The absolute value of ΔG0 absolutely decreased, suggesting that P adsorption capacity also decreased.
The Freundlich K2 and 1/n constants were defined as adsorption capacity and intensity respectively.42 The Freundlich K2 values decreased with the increasing alternate FTC number, indicating that the soil solid phases had a lower affinity for P. All freeze–thaw treatments increased the 1/n value compared to the control treatment F0 (Table 2). The F10 treatment produced the highest value which was significantly higher than the untreated soil F0.
3.4. The influence of FTC on soil phosphorus desorption characteristics
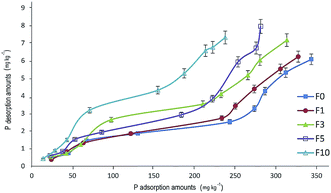
Desorption of phosphorus in soil is a reversible process which is directly related to the re-use of absorbed P and the bioavailability of soil.43 As shown in Fig. 5, desorption showed an increasing trend with increasing amounts of adsorbed P. In contrast with the adsorption isotherms, P desorption curves did not reach an equilibrium stage. This behavior may be attributed to specific adsorption of P at the sites of soil colloids which possess a greater binding energy.44 Phosphorus does not easily desorb, however the soil colloids' adsorptive sites are gradually saturated at higher equilibrium concentrations, which tends to reduce the binding energy.45 At equivalent amounts of P adsorption, P desorption was higher in the soil treated with FTC compared with untreated soil (F0), and also increased with increasing FTC number. These results indicate that FTC had a considerable effect on P desorption, as well as soil physical and chemical properties. Upon an increase in exogenous P, the desorption ratio tended to increase with increasing FTC number. When the exogenous P concentration was the same, the desorption ratio in soil after FTC was higher compared with that of untreated soil. P desorption in soil is closely related to adsorption (Table 3). The desorption and adsorption capacities were positively correlated with FTC number and exogenous P concentration.| Freeze–thaw cycles | y = a + bx | R2 | |
|---|---|---|---|
| a | b | ||
| F0 | 0.0014 | 0.0151 | 0.892 |
| F1 | −0.0883 | 0.0167 | 0.919 |
| F3 | −0.0158 | 0.0205 | 0.952 |
| F5 | −0.1843 | 0.0239 | 0.903 |
| F10 | 0.2616 | 0.0289 | 0.978 |
4. Conclusions
P adsorption trends were similar in both untreated soil and soils treated with different numbers of FTCs. Phosphorus adsorption capacity increased with increasing equilibrium P concentrations in solution. Compared with untreated soil, P isothermal adsorption curves were smoother, suggesting that phosphorus adsorption ability was weakened following FTC. This effect became more pronounced with increasing FTC number. FTC also produced an obvious effect on the desorption behavior. At identical exogenous phosphorus concentrations, the desorption ratio was greater in FTC-treated soil compared with untreated soil.Acknowledgements
This research is supported by the National Natural Science Foundation of China (No. 51378057).References
- H. T. Koponen, T. Jaakkola, M. M. Keinänen-Toivola, S. Kaipainen, J. Tuomainen, K. Servomaa and P. J. Martikainen, Soil Biol. Biochem., 2006, 38, 1861–1871 CrossRef CAS.
- J. Qi, P. A. Vermeer and G. Cheng, Permafr. periglac. process., 2006, 17, 245–252 CrossRef.
- R. Urakawa, H. Shibata, M. Kuroiwa, Y. Inagaki, R. Tateno, T. Hishi and M. Nakata, Soil Biol. Biochem., 2014, 74, 82–94 CrossRef CAS.
- K. S. Larsen, S. Jonasson and A. Michelsen, Appl. Soil Ecol., 2002, 21, 187–195 CrossRef.
- H. A. Henry, Soil Biol. Biochem., 2007, 39, 977–986 CrossRef CAS.
- K. Hentschel, W. Borken and E. Matzner, J. Plant Nutr. Soil Sci., 2008, 171, 699–706 CrossRef CAS.
- C. J. Bronick and R. Lal, Geoderma, 2005, 124, 3–22 CrossRef CAS.
- E. A. G. Schuur, J. Bockheim, J. G. Canadell, E. Euskirchen, C. B. Field, S. V. Goryachkin and G. Mazhitova, BioScience, 2008, 58, 701–714 CrossRef.
- X. Feng, L. L. Nielsen and M. J. Simpson, Soil Biol. Biochem., 2007, 39, 2027–2037 CrossRef CAS.
- M. Freppaz, B. L. Williams, A. C. Edwards, R. Scalenghe and E. Zanini, Appl. Soil Ecol., 2007, 35(1), 247–255 CrossRef.
- M. Oelbermann, M. English and S. L. Schiff, Can. J. Soil Sci., 2008, 88, 31–44 CrossRef CAS.
- Y. Yanai, K. Toyota and M. Okazaki, Soil Sci. Plant Nutr., 2004, 50, 821–829 CrossRef.
- H. Fan, D. Huang, L. Zhou and Y. Jia, Acta Agric. Scand., Sect. B, 2014, 64(1), 24–32 CAS.
- Y. J. Chai, X. B. Zeng, L. Y. Bai, S. M. Su and T. Huang, Soil Use Manage., 2014, 30, 507–516 CrossRef.
- A. Herrmann and E. Witter, Soil Biol. Biochem., 2002, 34, 1495–1505 CrossRef CAS.
- P. Grogan, A. Michelsen, P. Ambus and S. Jonasson, Soil Biol. Biochem., 2004, 36, 641–654 CrossRef CAS.
- J. Liu, F. Wu, W. Yang, P. Shi, A. Wang, Y. Yang and Z. Wu, Acta Ecol. Sin., 2013, 33, 32–37 CrossRef.
- P. Wei, W. Ouyang, F. Hao, X. Gao and X. Yu, Sci. Total Environ., 2016, 553, 607–616 CrossRef CAS PubMed.
- R. D. Fitzhugh, C. T. Driscoll, P. M. Groffman, G. L. Tierney, T. J. Fahey and J. P. Hardy, Biogeochemistry, 2001, 56, 215–238 CrossRef CAS.
- M. E. Bechmann, P. J. Kleinman, A. N. Sharpley and L. S. Saporito, J. Environ. Qual., 2005, 34, 2301–2309 CrossRef CAS PubMed.
- E. Matzner and W. Borken, Eur. J. Soil Sci., 2008, 59, 274–284 CrossRef.
- J. Yang, W. Zhou, J. Liu and X. Hu, Soil Biol. Biochem., 2014, 75, 202–210 CrossRef CAS.
- X. Yan, D. Wang, H. Zhang, G. Zhang and Z. Wei, Agric., Ecosyst. Environ., 2013, 175, 47–53 CrossRef.
- L. Wang and T. Liang, Chemosphere, 2014, 103, 148–155 CrossRef CAS PubMed.
- J. Murphy and J. P. Riley, Anal. Chim. Acta, 1962, 27, 31–36 CrossRef CAS.
- Z. L. He, V. C. Baligar, D. C. Martens and K. D. Ritchey, Soil Sci. Soc. Am. J., 1998, 62(6), 1538–1541 CrossRef CAS.
- H. Zheng, Z. Wang, X. Deng, S. Herbert and B. Xing, Geoderma, 2013, 206, 32–39 CrossRef CAS.
- I. Langmuir, J. Am. Chem. Soc., 1918, 40(9), 1361–1403 CrossRef CAS.
- H. M. F. Freundlich, J. Phys. Chem., 1906, 57, 385–470 CAS.
- P. Hinsinger, Plant Soil, 2001, 237, 173–195 CrossRef CAS.
- R. McDowell and L. Condron, Commun. Soil Sci. Plant Anal., 2001, 32, 2531–2547 CrossRef CAS.
- A. Rajput, Q. A. Panhwar, U. A. Naher, S. Rajput, E. Hossain and J. Shamshuddin, Am. J. Agr. Econ., 2014, 9, 251 CAS.
- Y. Gao and A. Mucci, Chem. Geol., 2003, 199, 91–109 CrossRef CAS.
- A. J. Messiga, N. Ziadi, C. Morel and L. E. Parent, Can. J. Soil Sci., 2010, 90, 419–428 CrossRef.
- Y. Zhao, Y. Wang, R. M. Cruse and X. Chen, Can. J. Soil Sci., 2012, 92, 567–571 CrossRef.
- J. D. Jabro, W. M. Iversen, R. G. Evans, B. L. Allen and W. B. Stevens, Soil Sci. Soc. Am. J., 2014, 78, 737–744 CrossRef CAS.
- G. P. Wang, J. S. Liu, H. Y. Zhao, J. D. Wang and J. B. Yu, Geoderma, 2007, 138, 153–161 CrossRef CAS.
- S. E. Hale, V. Alling, V. Martinsen, J. Mulder, G. D. Breedveld and G. Cornelissen, Chemosphere, 2013, 91, 1612–1619 CrossRef CAS PubMed.
- W. Wang, X. Shu, Q. Zhang and R. Guénon, Plant Soil, 2015, 386, 263–272 CrossRef CAS.
- C. G. Rossi, D. M. Heil, N. B. Bonumà and J. R. Williams, Environ. Model. Softw., 2012, 38, 40–49 CrossRef.
- C. H. Wu, J. Hazard. Mater., 2007, 144, 93–100 CrossRef CAS PubMed.
- M. N. Shafqat and G. M. Pierzynski, Chemosphere, 2014, 99, 72–80 CrossRef CAS PubMed.
- P. Zou, J. Fu and Z. Cao, J. Soils Sediments, 2011, 11, 249–259 CrossRef CAS.
- J. P. Gustafsson, L. B. Mwamila and K. Kergoat, Geoderma, 2012, 189, 304–311 CrossRef.
- S. C. Agudelo, N. O. Nelson, P. L. Barnes, T. D. Keane and G. M. Pierzynski, J. Environ. Qual., 2011, 40, 144–152 CrossRef CAS PubMed.
| This journal is © The Royal Society of Chemistry 2017 |

