 Open Access Article
Micromixing enhanced synthesis of HRPIBs catalyzed by EADC/bis(2-chloroethyl)ether complex
Shan Zhu a,
Yangcheng Lu*a and
Rudolf Faust*b
aState Key Laboratory of Chemical Engineering, Department of Chemical Engineering, Tsinghua University, Beijing 100084, China. E-mail: luyc@tsinghua.edu.cn
bPolymer Science Program, Department of Chemistry, University of Massachusetts Lowell, One University Avenue, Lowell, Massachusetts 01854, USA. E-mail: Rudolf_Faust@uml.edu
First published on 24th May 2017
Abstract
In this work, a micromixing module was utilized in the polymerization of isobutylene (IB) initiated by tert-butyl chloride (t-BuCl) and catalyzed by ethylaluminum dichloride (EADC)/bis(2-chloroethyl)ether (CEE) complex for the synthesis of highly reactive polyisobutylene (HRPIB). Better micromixing performance resulted in HRPIB with narrower molecular weight distribution, where the PDI could be decreased from 3.5 without micromixing module to 2.5 or less. The polymerization rate also increased while the molecular weight and content of exo-olefin end groups of HRPIBs could be adjusted conveniently by the ratio of CEE to EADC and monomer concentration. A dynamic mechanism was proposed to explain the effects of micromixing on the enhanced HRPIB synthesis.
Introduction
Highly reactive polyisobutylenes (HRPIBs) containing a high content of exo-olefin end groups (≥60 mol%, preferably ≥75 mol%) and specific molecular weight range (Mn = 500–5000) have drawn attention both from industry and academia in recent years because of their wide applications as precursors in ashless dispersants and gasoline additives.1–5 Comparing with the low reactivity of tri- and tetra-substituted olefin ends in conventional PIBs, the exo-olefin end group in HRPIBs is highly reactive for further functionalization.6–9 For instance, the HRPIBs could react with maleic anhydride to give polyisobutenylsuccinic anhydrides and subsequently react with oligoalkylenimines to yield polyisobutenylsuccinimides ashless dispersants directly instead of chlorination–dehydrochlorination that is necessary with conventional PIBs.10–12Commercial HRPIBs can be produced by a single-step process via cationic polymerization of isobutylene (IB) in hexane using BF3 complexes with either alcohols and/or ethers as coinitiators.13–15 Considering the high volatility and corrosiveness of BF3, many efforts have been reported aimed at replacing BF3.16–18 Vierle adopted Mn(II) complexes as initiators to synthesize HRPIBs.19 Bochmann synthesized HRPIBs using a zinc-based initiator system.20 Voit adopted M(II) complexes (M = Mn, Cu, Zn, Mo) as catalysts to synthesize HRPIBs.21–23 Kostjuk and Wu independently reported HRPIBs synthesized in CH2Cl2 or CH2Cl2–hexane mixture using a cost-effective initiation system consisting of AlCl3 with dialkyl ether, such as di-n-butyl ether (Bu2O) and diisopropyl ether (iPr2O).24–26 In following, researchers investigated similar initiating systems, such as FeCl3·dialkyl ether, GaCl3·dialkyl ether etc.27–29 In all the above systems, CH2Cl2 was introduced to prepare the initiation solutions due to the limited solubility of the above Lewis acid complexes in hexanes. More recently, some groups employed the soluble complex of ethylaluminum dichloride (EADC) and bis(2-chloroethyl)ether (CEE) as catalyst, tert-butyl chloride (t-BuCl) as initiator, to overcome the limitations in the previous methods.30–34 The HRPIBs with high content of exo-olefin end groups (>80%), adjustable molecular weight and almost 100% conversion within 20 minutes could be attained in hexanes. However, the products exhibit broad molecular weight distribution (PDI) due to the poor performances of batch reactor in transfer and dynamic control. From this point of view, introducing a micromixing module capable of enhancing transfer and strictly controlling residence time is an attractive solution,35 which has been exploited in many polymerization processes to optimize the operation conditions and products.36–39
In this work, we introduced a micromixing module composed of a T-shaped mixer and delay tube before the tank reactor, and investigated how this affects the polymerization of IB initiated by t-BuCl and catalyzed by EADC·CEE complex in hexanes. The dependences of reaction rate and product properties on mixing conditions, temperature, CEE/EADC ratio and monomer concentration were systematically studied to search the potentials for fast synthesis of HRPIBs with easily adjustable molecular weight under room temperature.
Experimental section
Materials
Hexanes (Sigma-Aldrich, ≥98.5%) were refluxed over sulfuric acid (H2SO4) for 48 h, then washed with 10% potassium hydroxide (KOH) aqueous solution, and finally washed with distilled water until the aqueous layer was neutral. The hexanes were pre-dried by vigorously mixing with anhydrous sodium sulfate (Na2SO4) for 30 min and then refluxed over calcium hydride (CaH2) for 48 h. Then the hexanes were distilled onto CaH2, refluxed again for 24 h, and freshly distilled. Isobutylene (IB, Matheson Tri Gas) was dried by passing it through in-line gas-purifier columns packed with BaO/Drierite and then liquefied into a 1 L cylinder at −30 °C. tert-Butyl chloride (t-BuCl, 98%, TCI America), CaH2 (92%, 1–20 mm granules, Alfa Aesar) were used as received. Ethylaluminum dichloride (EADC, 1.0 M solution in hexane), bis(2-chloroethyl)ether (CEE, 99%), KOH (90%), H2SO4 (95.0–98.0%) and Na2SO4 (>99.0%, anhydrous, powder) were purchased from Sigma-Aldrich and used directly without any further purification.Preparation of complex solution and initiator solution
EADC·CEE complex solution and initiator solution (t-BuCl + hexanes) were prepared just before polymerization in a glovebox (MBraun, Inc. Stratham, NH). For the EADC·CEE complex, required amount of ether was added to EADC (1 M in hexane) to form a Lewis acid/ether complex under stirring. Then, a certain amount of hexanes was added to the complex to make the fully soluble complex solution. For the initiator solution, a certain amount of t-BuCl was added into hexanes to form a solution.Polymerization of IB
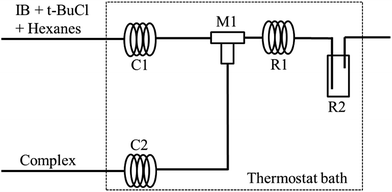
The polymerization of IB was carried out in a micromixing system composed of a T-shaped micromixers (M1 for the mixing of t-BuCl + IB + hexanes solution and EADC·CEE complex solution), two precooling coiled tubes (C1 and C2, inner diameter 900 μm), a microtube reactor (R1, inner diameter 900 μm) and a tank reactor (R2) as shown in Fig. 1. Two syringe pumps were used to deliver t-BuCl + IB + hexanes solution and EADC·CEE complex solution, respectively. IB was transferred as liquid from the bottom of the IB cylinder into the syringe to mix with t-BuCl + hexane and then pumped into the reaction system under a pressure of about 20 psi. The polymerization was conducted in R1 and R2. After a certain residence time, methanol was added into R2 to terminate the polymerization.Characterization
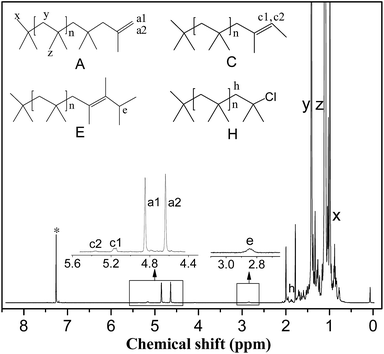
| Mn,NMR = 56.11 × {(y/2)/[(a1 + a2)/2 + c1 + c2 + e + (h/2)]} |
Results and discussion
IB polymerization at 0 °C under different mixing conditions
For fast reactions, the mixing of reactants commonly has great influence on the products' properties. Considering the features of cationic polymerization of IB catalyzed by EADC·CEE complex in hexanes, the mixing conditions would be important. As for the polymerization, previous work concluded that the polymerization temperature of 0 °C and the CEE/EADC = 1.5 are the optimized conditions for the reaction conducted in a batch reactor.27,28 Therefore, under these reference conditions we first investigated the influence of mixing conditions. The results are shown in Table 1.| Entry | Time (min) | Conv.b (%) | Mn,NMR (g mol−1) | Mn (GPC) | PDI | Exo (%) | Tri + Endo (%) | Tetra (%) | [PIB]c (mmol L−1) |
|---|---|---|---|---|---|---|---|---|---|
| a [EADC·CEE] = 0.01 M; [t-BuCl] = 0.01 M; [IB] = 1 M; for entries 1–12: F(complex) = 4 mL min−1; F(t-BuCl + hexanes + IB) = 6 mL min−1.b Gravimetric conversion.c [PIB] = [IB] × 56 × Conv./Mn,NMR.d Cross-flow mixing, ID (tee joint) = 0.1 mm.e Cross-flow mixing, ID (tee joint) = 0.5 mm.f Impingement mixing, ID (tee joint) = 0.5 mm.g Tank reactor. | |||||||||
| 1d | 2 | 20 | 1300 | 1400 | 1.95 | 91.6 | 4.7 | 3.7 | 8.6 |
| 2d | 5 | 49 | 1100 | 1050 | 1.98 | 86.1 | 7.0 | 6.9 | 24.9 |
| 3d | 10 | 88 | 900 | 1000 | 2.12 | 83.5 | 8.6 | 7.9 | 54.8 |
| 4d | 20 | 100 | 700 | 800 | 2.50 | 80.8 | 9.2 | 10.0 | 80.0 |
| 5e | 2 | 21 | 1700 | 1800 | 2.20 | 85.6 | 7.2 | 7.2 | 6.9 |
| 6e | 5 | 46 | 1100 | 1300 | 2.26 | 87.8 | 6.5 | 5.7 | 23.4 |
| 7e | 10 | 80 | 900 | 1100 | 2.25 | 84.7 | 8.8 | 6.5 | 49.8 |
| 8e | 20 | 100 | 700 | 800 | 2.80 | 82.3 | 9.5 | 8.2 | 80.0 |
| 9f | 2 | 16 | 1700 | 1900 | 2.75 | 85.1 | 9.3 | 5.6 | 5.3 |
| 10f | 5 | 36 | 1200 | 1400 | 2.85 | 85.3 | 7.8 | 6.9 | 16.8 |
| 11f | 10 | 69 | 900 | 1100 | 2.80 | 83.4 | 10.0 | 6.6 | 42.9 |
| 12f | 20 | 95 | 600 | 700 | 3.20 | 81.6 | 10.4 | 8.0 | 88.7 |
| 13g | 2 | 14 | 2500 | 2700 | 3.60 | 81.4 | 10.5 | 8.1 | 3.1 |
| 14g | 5 | 32 | 1700 | 1900 | 3.70 | 83.5 | 9.0 | 7.5 | 10.5 |
| 15g | 10 | 66 | 1500 | 1600 | 3.40 | 82.7 | 9.9 | 7.4 | 24.6 |
| 16g | 20 | 90 | 1200 | 1300 | 3.50 | 84.1 | 9.2 | 6.7 | 42.0 |
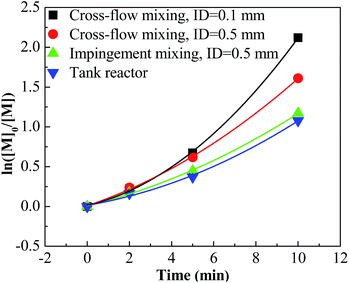
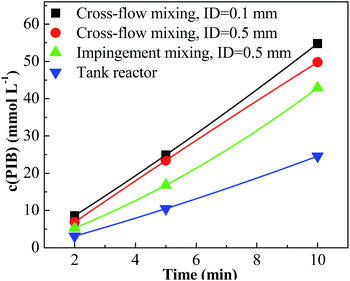
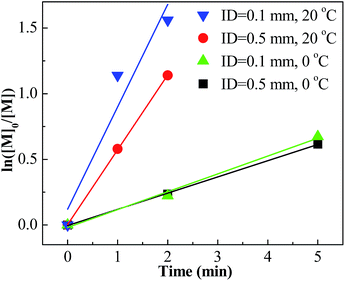
For entries 1–4 in Table 1, a higher polymerization and narrower PDI were attained with the tee joint of ID = 0.1 mm, which were much better than that attained with tee joint of ID = 0.5 mm (entries 5–8) and batch reactor (entries 13–16). The results showed that better mixing could accelerate the polymerization and decrease the PDI of products. Comparing the conversion and PDI in entries 5–8 and 9–12 with different mixing methods of cross-flow mixing and impingement, the cross-flow mixing was more beneficial to achieve fast and controlled polymerization. Fig. 3 shows the plots of ln([M]0/[M]) vs. time. The slopes of these curves reflect the active center concentration. The comparison of various slopes indicates that better mixing conditions correspond to higher active center concentration. An explanation is that timely monomer supply with better mixing could promote the utilization of carbenium ions and inhibit the conversion from active carbenium ions to dormant oxonium ions. The difference of various curves is more distinct when the time is long and the monomer conversion is high. At that stage, the effect of monomer transfer on apparent reaction kinetics is amplified. The plots of PIB concentration vs. time with different mixing conditions are shown in Fig. 4. The high PIB concentration with better mixing shows that the increasing of active center concentration with enhancing micromixing favors chain transfer. Moreover, better mixing also increases the rate of β-proton elimination and decrease the Mn. Better mixing would result in more uniform reaction environment and products. So all PDIs of HRPIBs in entries 1–12 attained with micromixing enhanced system were around 2.5, much narrower than that in the tank reactor. Overall, high polymerization rate and narrow PDI could be attained by improving the mixing conditions.
IB polymerization at 20 °C under different mixing conditions
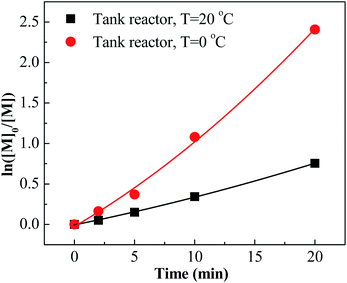
Conducting the polymerization of IB at room temperature is technically and economically beneficial. Therefore, the polymerization at 20 °C with different mixing conditions was investigated. The results are listed in Table 2. Entries 17–24 show that the polymerizations at 20 °C were accelerated greatly when introducing the micromixing module. For an example, 68% conversion could be attained within 1 minute with the tee-joint of ID = 0.1 mm. In contrast, the polymerization in the tank reactor at 20 °C was slow. The comparison is presented more clearly by plotting ln([M]0/[M]) vs. time, as shown in Fig. 5 and 6. Fig. 5 indicates that the active center concentration at 20 °C was much higher than that at 0 °C, revealing that at high temperature the equilibrium constant of oxonium/carbenium ion equilibrium is higher. The higher active center concentration along with higher β-proton elimination rate at higher temperature resulted in the much lower molecular weights at 20 °C. Besides, temperature has a greater effect on the rate of isomerization relative to that of β-proton elimination, so the content of exo-olefin decreases a little with the increase of temperature.| Entry | Time (min) | Conv.b (%) | Mn,NMR (g mol−1) | Mn (GPC) | PDI | Exo (%) | Tri + Endo (%) | Tetra (%) | [PIB]c (mmol L−1) |
|---|---|---|---|---|---|---|---|---|---|
| a [EADC·CEE] = 0.01 M; [t-BuCl] = 0.01 M; [IB] = 1 M; for entries 17–24: F(complex) = 4 mL min−1; F(t-BuCl + hexanes + IB) = 6 mL min−1.b Gravimetric conversion.c [PIB] = [IB] × 56 × Conv./Mn,NMR.d Cross-flow mixing, ID (tee joint) = 0.1 mm.e Cross-flow mixing, ID (tee joint) = 0.5 mm.f Tank reactor. | |||||||||
| 17d | 1 | 68 | 700 | 900 | 1.95 | 73.2 | 15.5 | 11.3 | 54.4 |
| 18d | 2 | 79 | 600 | 800 | 2.02 | 73.0 | 16.2 | 10.8 | 73.7 |
| 19d | 5 | 100 | 500 | 600 | 2.25 | 68.6 | 16.4 | 15.0 | 112.0 |
| 20d | 10 | 100 | 400 | 500 | 2.50 | 67.2 | 17.7 | 15.1 | 140.0 |
| 21e | 1 | 44 | 1000 | 1200 | 2.26 | 75.6 | 12.5 | 11.9 | 24.6 |
| 22e | 2 | 68 | 900 | 1000 | 2.35 | 76.0 | 16.0 | 8.0 | 42.3 |
| 23e | 5 | 100 | 700 | 800 | 2.43 | 72.0 | 16.1 | 11.9 | 80.0 |
| 24e | 10 | 100 | 600 | 700 | 2.81 | 70.1 | 17.2 | 12.7 | 93.3 |
| 25f | 2 | 5 | |||||||
| 26f | 5 | 14 | 1700 | 1900 | 2.82 | 79.5 | 11.2 | 9.3 | 4.6 |
| 27f | 10 | 29 | 1300 | 1200 | 2.95 | 79.6 | 9.8 | 10.6 | 12.5 |
| 28f | 20 | 53 | 1000 | 1100 | 3.12 | 80.3 | 9.8 | 9.9 | 29.7 |
However, the effects of temperature on polymerization have a totally different scenario in the tank reactor. As seen in Fig. 6, the slope decreases much when increasing temperature from 0 °C to 20 °C, revealing an abrupt decrease of active center concentration.
Faust reported that the oxonium ions are unstable at 20 °C.40 Thus, in tank reactor, large part of carbenium ions have decomposed before polymerization, and polymerization is slow due to poor initiation. Correspondingly, an explanation about the high conversion of entries 17–24 is that the carbenium ions have been consumed by the monomer through chain propagation before decomposing. Timely supply of monomers once carbenium ions are generated is fundamental for fast polymerization at 20 °C, where the micromixing module could play a key role.
The regulation of IB polymerization in the system with micromixing module
Cationic polymerization processes are usually very sensitive to various reaction conditions, which brings challenges for process control but opportunities for product customization. Herein, we first investigated the influence of the CEE/EADC ratio on IB polymerization in the system with micromixing module, where the reaction conditions and course can be strictly controlled and replicated. The results are shown in Table 3. Comparing the results with different ratios of CEE/EADC in entries 5–8, 29–40, the polymerization rates were similar at CEE/EADC = 1.0–1.5 but lower at CEE/EADC = 2.0. The plots of ln([M]0/[M]) vs. time can present this more clearly, as shown in Fig. 7. We suppose that the active center concentration changes little with the ratios of CEE/EADC in the range from 1.0 to 1.5, but decreases much at CEE/EADC = 2.0. Apparently when large excess of CEE is present the oxonium/carbenium ion equilibrium is shifted toward oxonium ions. From Table 3 we also can find that the Mn decreases with the increasing of the ratio of CEE to EADC. The lower Mn with higher ratio are mainly due to the higher chain transfer rate corresponding to higher free ether concentration. The chain transfer rates could be seen more clearly in Fig. 8. Supposing that the active center concentration changes little at CEE/EADC = 1.0–1.5, the obvious change of the PIB concentration with the ratio of CEE to EADC is because the free ether in the initiation system could promote the chain transfer. Meanwhile, the free ether could promote the β-proton elimination and inhibit the isomerization, so the content of exo-olefin increased with the increasing of the ratio of CEE to EADC, as shown in Fig. 9. In general, besides of temperature, the ratio of CEE/EADC is a sensitive parameter to determine the molecular weight and content of exo-olefin of HRPIBs.| Entry | Time (min) | Conv.b (%) | Mn,NMR (g mol−1) | Mn (GPC) | PDI | Exo (%) | Tri + Endo (%) | Tetra (%) | [PIB]c (mmol L−1) |
|---|---|---|---|---|---|---|---|---|---|
| a [EADC·CEE] = 0.01 M; [t-BuCl] = 0.01 M; [IB] = 1 M; for entries 29–40: F(complex) = 4 mL min−1; F(t-BuCl + hexanes + IB) = 6 mL min−1; ID (tee joint) = 0.5 mm.b Gravimetric conversion.c [PIB] = [IB] × 56 × Conv./Mn,NMR.d CEE/EADC = 1.0.e CEE/EADC = 1.2.f CEE/EADC = 2.0. | |||||||||
| 29d | 2 | 23 | 8700 | 8800 | 2.30 | 70.0 | 23.1 | 6.9 | 1.5 |
| 30d | 5 | 44 | 5300 | 5500 | 2.26 | 68.0 | 29.0 | 3.0 | 4.6 |
| 31d | 10 | 80 | 3200 | 3100 | 2.35 | 61.8 | 29.4 | 8.8 | 14.0 |
| 32d | 20 | 100 | 2400 | 2500 | 2.75 | 60.5 | 30.2 | 9.3 | 23.3 |
| 33e | 2 | 17 | 2200 | 2500 | 2.28 | 75.0 | 13.0 | 12.0 | 4.3 |
| 34e | 5 | 43 | 1500 | 1600 | 2.32 | 77.3 | 12.1 | 10.6 | 16.1 |
| 35e | 10 | 83 | 1100 | 1200 | 2.43 | 74.3 | 16.2 | 9.5 | 42.3 |
| 36e | 20 | 100 | 800 | 900 | 2.82 | 74.2 | 14.4 | 11.4 | 70.0 |
| 37f | 2 | 9 | 2000 | 88.9 | 5.5 | 5.6 | 2.5 | ||
| 38f | 5 | 10 | 1300 | 90.1 | 4.9 | 5.0 | 4.3 | ||
| 39f | 10 | 14 | 1100 | 1200 | 2.32 | 97.2 | 2.8 | 0.0 | 7.1 |
| 40f | 20 | 36 | 900 | 1000 | 2.58 | 93.6 | 2.7 | 3.7 | 22.4 |
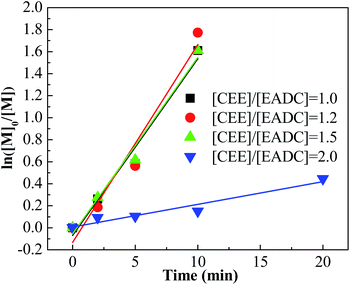 | ||
| Fig. 7 ln([M]0/[M]) vs. time plot for polymerization of IB initiated by t-BuCl/EADC·CEE at different ratios of [CEE] to [EADC] in hexanes at 0 °C. [EADC·CEE] = 0.01 M; [t-BuCl] = 0.01 M. | ||
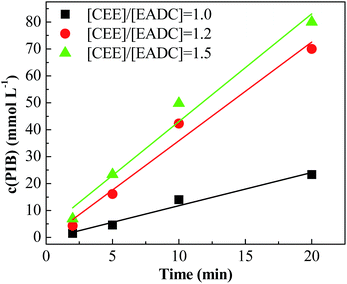 | ||
| Fig. 8 PIB concentration vs. time plot for polymerization of IB initiated by t-BuCl/EADC·CEE at different ratios of [CEE] to [EADC] in hexanes at 0 °C. [EADC·CEE] = 0.01 M; [t-BuCl] = 0.01 M. | ||
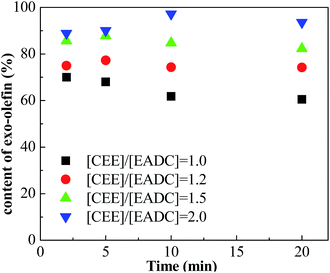 | ||
| Fig. 9 Content of exo-olefin vs. time plot for polymerization of IB initiated by t-BuCl/EADC·CEE at different ratios of [CEE] to [EADC] in hexanes at 0 °C. [EADC·CEE] = 0.01 M; [t-BuCl] = 0.01 M. | ||
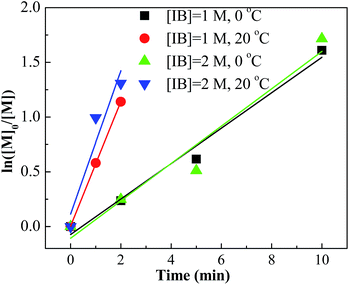
Furthermore, we investigated the influence of monomer concentration on the polymerization of IB, since both the production capacity and the Mn are highly dependent on the monomer concentration. The results are listed in Table 4. Comparing the results of entries 5–8, 41–44, the polymerization rate, PDI and content of exo-olefin were almost constant while the Mn increased with the increasing of monomer concentration. Fig. 10 summarized the plots of ln([M]0/[M]) vs. time. From the slopes of these plots, we can find that the active center concentration is almost independent of the monomer concentration under the same mixing conditions. The monomer concentration is an effective parameter to adjust molecular weight easily without other effects.
| Entry | Time (min) | Conv.b (%) | Mn,NMR (g mol−1) | Mn (GPC) | PDI | Exo (%) | Tri + Endo (%) | Tetra (%) | [PIB]c (mmol L−1) |
|---|---|---|---|---|---|---|---|---|---|
| a [EADC·CEE] = 0.01 M; [t-BuCl] = 0.01 M; [IB] = 1 M; for entries 41–48: F(complex) = 4 mL min−1; F(t-BuCl + hexanes + IB) = 6 mL min−1; ID (tee joint) = 0.5 mm.b Gravimetric conversion.c [PIB] = [IB] × 56 × Conv./Mn,NMR.d T = 0 °C.e T = 20 °C. | |||||||||
| 41d | 2 | 22 | 2200 | 2400 | 2.21 | 89.4 | 5.8 | 4.8 | 11.2 |
| 42d | 5 | 40 | 1900 | 2000 | 2.15 | 94.4 | 3.7 | 1.9 | 23.6 |
| 43d | 10 | 82 | 1100 | 1300 | 2.35 | 82.5 | 10.3 | 7.2 | 83.5 |
| 44d | 20 | 100 | 1000 | 1100 | 2.75 | 82.4 | 10.4 | 7.2 | 112.0 |
| 45e | 1 | 63 | 1000 | 1200 | 2.16 | 70.4 | 17.1 | 12.5 | 70.6 |
| 46e | 2 | 73 | 900 | 1000 | 2.30 | 65.6 | 20.5 | 13.9 | 90.8 |
| 47e | 5 | 89 | 800 | 900 | 2.42 | 67.2 | 19.2 | 13.6 | 124.6 |
| 48e | 10 | 100 | 700 | 800 | 2.84 | 63.1 | 21.3 | 15.6 | 160.0 |
Dynamic mechanism analysis
The mechanism for the polymerization of IB catalyzed by t-BuCl/EADC·CEE has been proposed by Faust and coworkers.27,28 In the mechanism described in Scheme 1, first t-BuCl is ionized by complex (EADC·CEE). The carbenium ions are in rapid dynamic equilibrium with dormant oxonium ions and the concentration of oxonium ions are much higher than that of carbenium ions. At elevated temperature (>15 °C),34 decomposition yields isobutane and ethylene by hydride transfer. With the better mixing in the micromixing enhanced system, the monomer could be supplied to the vicinity of carbenium ions timely. Part of the carbonium ions would be consumed fast by chain propagation with monomer before converting to oxonium ions. Therefore, better mixing produces more active centers to accelerate the polymerization, which is consistent with the results shown in Table 1. With poor mixing in the tank reactor, part of the carbenium ions would undergo decomposition thereby decreasing the carbenium ion concentration and decrease the polymerization rate. However, the decomposition is much slower compared to the activation/deactivation involved in the equilibrium. The chain propagation with timely supplied monomer may occur before decomposition with better mixing in the micromixing module to accelerate the polymerization.Conclusions
HRPIB with lower PDI and increased polymerization rates could be attained in the polymerization of IB initiated by t-BuCl and catalyzed by EADC/CEE complex in hexanes by introducing a micromixing module in the polymerization system. The HRPIBs with 100% conversion could be obtained within 5 min in the micromixing enhanced system at 20 °C, in comparison to only 30% conversion after 10 min in a tank reactor. The molecular weight and exo-olefin end groups content of HRPIBs could be adjusted conveniently by the ratio of CEE to EADC and monomer concentration. A dynamic mechanism for these improved results is proposed that the micromixing enhanced monomer supply could promote propagation relative to decomposition. In conclusion, applying a micromixing module in the polymerization system, the HRPIBs synthesis could be optimized and adjusted conveniently.Acknowledgements
The authors granted the financial support of the National Natural Science Foundation of China (21422603, U1662120) and China Scholarship Council.Notes and references
- P. Boerzel, K. Bronstert and F. Hovemann, DE 2702604, BASF AG, 1978.
- H. P. Rath, US 5,910,550, BASF AG, 1997Chem. Abstr., 1997, 128, 23292.
- J. M. Kerr, J. Mcmahon and J. M. Scotland, EP 0671419, BP Chemicals Ltd., 1995Chem. Abstr., 1995, 123, 314902.
- H. Mach and P. Rath, Lubr. Sci., 1999, 11, 175–185 CrossRef CAS.
- J. J. Harrison, C. M. Mijares and J. Hudson, Macromolecules, 2002, 35, 2494–2500 CrossRef CAS.
- J. D. Burrington, J. R. Johnson and J. K. Pudelski, Top. Cat., 2003, 23, 175–181 CrossRef CAS.
- I. Puskas, E. M. Banas and A. G. Nerheim, J. Polym. Sci., Polym. Symp., 1976, 56, 191–201 CrossRef CAS.
- J. J. Harrison, D. C. Young and C. L. Mayne, J. Org. Chem., 1997, 62, 693–699 CrossRef CAS PubMed.
- W. Günther, K. Maenz and D. Stadermann, Angew. Makromol. Chem., 1996, 234, 71–90 CrossRef.
- E. N. Kresge, R. H. Schatz and H. C. Wang, Encyclopedia of Polymer Science and Engineering, Wiley, New York, 1985, vol. 8, pp. 423–450 Search PubMed.
- I. Puskas and S. Meyerson, J. Org. Chem., 1984, 49, 258–262 CrossRef CAS.
- J. J. Harrison, C. M. Mijares, M. T. Cheng and J. Hudson, Macromolecules, 2002, 35, 2494–2500 CrossRef CAS.
- H. P. Rath, US 5,286,823, BASF AG, 1994.
- H. P. Rath, A. Lange and H. Mach, US 7,071,275, BASF AG, 2006.
- H. P. Rath, WO 99/64482, BASF AG, 1999.
- S. V. Kostjuk, RSC Adv., 2015, 5, 13125–13144 RSC.
- Y. Li, M. Cokoja and F. E. Kühn, Coord. Chem. Rev., 2011, 255, 1541–1557 CrossRef CAS.
- S. V. Kostjuk, H. Y. Yeong and B. Voit, J. Polym. Sci., Part A: Polym. Chem., 2013, 51, 471 CrossRef CAS.
- M. Vierle, Y. Zhang, E. Herdtweck, M. Bohnenpoll, O. Nuyken and F. E. Kühn, Angew. Chem., Int. Ed., 2003, 42, 1307–1310 CrossRef CAS PubMed.
- A. Guerrero, K. Kulbaba and M. Bochmann, Macromolecules, 2007, 40, 4124–4126 CrossRef CAS.
- A. K. Hijazi, N. Radhakrishnan, K. R. Jain, E. Herdtweck, O. Nuyken, H. M. Walter, P. Hanefeld, B. Voit and F. E. Kühn, Angew. Chem., Int. Ed., 2007, 46, 7290–7292 CrossRef CAS PubMed.
- N. Radhakrishnan, A. K. Hijazi, H. Komber, B. Voit, S. Zschoche, F. E. Kühn, O. Nuyken, M. Walter and P. J. Hanefeld, J. Polym. Sci., Part A: Polym. Chem., 2007, 45, 5636–5648 CrossRef CAS.
- H. Y. Yeong, Y. Li, F. E. Kühn and B. Voit, J. Polym. Sci., Part A: Polym. Chem., 2013, 51, 158–167 CrossRef CAS.
- I. V. Vasilenko, A. N. Frolov and S. V. Kostjuk, Macromolecules, 2010, 43, 5503–5507 CrossRef CAS.
- I. V. Vasilenko, D. I. Shiman and S. V. Kostjuk, J. Polym. Sci., Part A: Polym. Chem., 2012, 50, 750–758 CrossRef CAS.
- Q. Liu, Y. X. Wu, Y. Zhang, P. F. Yan and R. W. Xu, Polymer, 2010, 51, 5960–5969 CrossRef CAS.
- Q. Liu, Y. X. Wu, P. Yan, Y. Zhang and R. Xu, Macromolecules, 2011, 44, 1866–1875 CrossRef CAS.
- K. J. Bartelson, P. De, R. Kumar, J. Emert and R. Faust, Polymer, 2013, 54, 4858–4863 CrossRef CAS.
- R. Kumar, P. Dimitrov, K. J. Bartelson, J. Emert and R. Faust, Macromolecules, 2012, 45, 8598–8603 CrossRef CAS.
- R. Kumar, B. Zheng, K. W. Huang, J. Emert and R. Faust, Macromolecules, 2014, 47, 1959–1965 CrossRef CAS.
- S. Banerjee, B. N. Jha, P. De, J. Emert and R. Faust, Macromolecules, 2015, 48, 5474–5480 CrossRef CAS.
- I. V. Vasilenko, D. I. Shiman and S. V. Kostjuk, Polym. Chem., 2014, 5, 3855 RSC.
- D. I. Shiman, I. V. Vasilenko and S. V. Kostjuk, J. Polym. Sci., Part A: Polym. Chem., 2014, 52, 2386 CrossRef CAS.
- D. I. Shiman, I. V. Vasilenko and S. V. Kostjuk, Polymer, 2016, 99, 633 CrossRef CAS.
- N. M. Kashid and L. Kiwi-Minsker, Ind. Eng. Chem. Res., 2009, 48, 6465–6485 CrossRef.
- J. L. Steinbacher and D. T. McQuade, J. Polym. Sci., Part A: Polym. Chem., 2006, 44, 6505–6533 CrossRef CAS.
- A. Nagaki, K. Kawamura and J. Yoshida, J. Am. Chem. Soc., 2004, 126, 14702–14703 CrossRef CAS PubMed.
- T. Iwasaki, A. Nagaki and J. Yoshida, Chem. Commun., 2007, 1263–1265 RSC.
- Y. C. Lu, S. Zhu, K. Wang and G. S. Luo, Ind. Eng. Chem. Res., 2016, 55, 1215–1220 CrossRef CAS.
- T. Rajasekhar, J. Emert and R. Faust, Polym. Chem., 2017, 8, 2852–2859 RSC.
| This journal is © The Royal Society of Chemistry 2017 |

