DOI:
10.1039/C7RA05281B
(Paper)
RSC Adv., 2017,
7, 31619-31627
Hybrid CuxO–TiO2 porous hollow nanospheres: preparation, characterization and photocatalytic properties†
Received
10th May 2017
, Accepted 12th June 2017
First published on 20th June 2017
Abstract
A series of CuxO–TiO2 hollow nanospherical composites with different mass percents of copper were prepared by an impregnation method, and the TiO2 hollow nanospheres were prepared by hydrolysis of tetraethoxy titanium on the surface of spherical SiO2 nanoparticles and corrosion of SiO2 in NaOH solution. CuxO–TiO2 hollow nanospheres displayed higher photocatalytic activities towards acetaldehyde degradation to CO2 than TiO2@SiO2 nanospheres and TiO2 hollow nanospheres under UV and visible-light irradiation due to the narrowed band gap of TiO2 and enhanced charge separation after copper was introduced. In particular, the CuxO–TiO2 hollow nanospheres show high catalytic activities in degradation under visible-light irradiation.
1. Introduction
In the past decades, titanium dioxide (TiO2) has attracted increasing attention due to its extensive application such as in sensor technology,1,2 pigments,3 solar cells,4 self-cleaning coatings5 and photocatalysis.6,7 Particularly, study on the photocatalytic properties of TiO2 is the most common because of its several advantages including low cost, innocuity, chemical stability and high refractive index.8–11 However, there are some disadvantages in using TiO2, such as small surface area, phase transition, crystal growth and low quantum efficiency, which limit the photocatalytic efficiency of the catalysts.12–14
In order to overcome these problems, many investigations have been reported.15–17 Morphology control and preparation of titania-based materials are two very effectual strategies.18 One of the most efficient ways is to coat TiO2 in form of a layer on surface of core materials with high surface area, such as ZrO2, MoO3, Fe2O3 and SiO2.19,20 Silica is one of the best core materials for its well-known surface chemistry, absorption capacity, controllable preparation and it can be easily eliminated.21 Another is to synthesize TiO2 with different morphologies and microstructures to enhance the surface area of the semiconductor. Many new morphologies of TiO2 were synthesized in the past years, such as nanotubes, nanorods, and hollow spheres, etc.22 The synthesis of TiO2 hollow nanosphere is especially concerned for its large surface area, low density, and high light-harvesting efficiency.23,24
Volatile organic compound is the sources of indoor air pollution, and it is always the central issues in the environmental protection field. Among various photocatalytic oxidations over semiconductors, TiO2 photocatalyst possesses the function of air purification. Despite of good photocatalytic activities, TiO2 is only effective to degrade some photosensitive organic compounds under ultraviolet (UV) irradiation with strong intensity. However, the intensity of UV-light from common filament lamp is below several μW cm−3, which is one thousand times low to the sunlight.25 So the catalyst cannot reach the desired effect to get rid of the indoor contaminated gases. Therefore, development of visible-light-sensitive photocatalysts based on TiO2 is necessary.
Another, due to high prices and scarce of the noble metal, attention has been given to search an alternative catalytic component to replace the noble metal. Such as, copper or copper oxide is better substitute component because of their low cost and wide use. In 2009, TiO2 powder grafted by Cu+ ions was found to be sensitive to visible light by Irie and his co-workers,26 which lighted up the hope to TiO2 on its applications in daily life. They studied the photocatalytic activity of Cu/TiO2 under visible light irradiation. Huang et al. prepared the CuO/TiO2 by the deposition–precipitation (DP) and investigated its catalytic behavior.27 Also, Gnanasekaran et al. did many research to expand the absorption of TiO2 to the visible light range for improving the photocatalytic efficiency.28,29 Although photocatalytic efficiency of TiO2 is improved markedly, catalytic efficiency of the catalyst is still unsatisfying. Based on these works, we determine to use high specific surface area porous TiO2 hollow spheres as the carrier of loading copper, and study their catalytic activities by degradation of acetaldehyde gas.
In this paper, TiO2@SiO2 core–shell nanosphere was prepared by using silica gel nanosphere as hard template, and TiO2 hollow nanosphere was obtained after SiO2 was etched by NaOH solution with a certain concentration. Cu2+ ions were adsorbed and CuxO was formed on the surface of the TiO2 hollow nanosphere to enhance separation of the photogenerated charge carriers. Four kinds of photocatalysts, TiO2@SiO2 nanosphere, TiO2 hollow nanosphere, CuxO–TiO2@SiO2 nanosphere and CuxO–TiO2 hollow nanosphere, were synthesized. The catalytic activities of these catalysts were studied by degradation of acetaldehyde under UV and visible-light irradiations. The results indicate that all catalysts have good catalytic activities in degradation of acetaldehyde under UV-light irradiation, and the CuxO–TiO2 hollow nanosphere shows high catalytic activities in the degradation under visible-light irradiation. As shown in Scheme 1, the visible-light is considered to initiate interfacial charge transfer. If the photon energy of light is greater than the semiconductor band gap, the electron (e−) on the valence band will be excited to the conduction band and the hole (h+) will be generated at the valence band. When CuxO–TiO2 is used as photocatalyst, electrons in the valence band (VB) of TiO2 are stimulated and directly transferred to Cu(II) to form Cu(I), as well as holes (h+) in the VB of TiO2. Also the adsorbed O2 on the surface can capture the electrons in VB of TiO2, but it is harder than that of Cu(II). Thus, the energy to separate electrons and holes becomes low, which narrows the band gap of TiO2 and prolongs the absorption edge from UV-light to visible-light region. The holes produced in VB of TiO2 decompose organic substances.
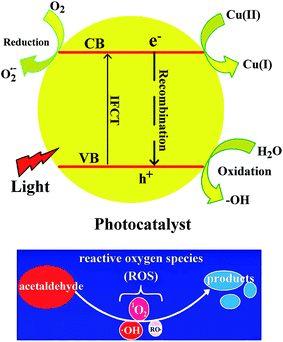 |
| | Scheme 1 Possible mechanism on degradation of acetaldehyde under the existence of CuxO@TiO2 catalysts. | |
2. Experimental
2.1. Chemicals and instruments
All chemicals used are of analytical reagent grade available from a commercial supplier without further purification. Tetraethoxysilane (TEOS, ≥99%) and copper chloride dihydrate (CuCl2·2H2O, AR) were purchased from Sinopharm Chemical Reagent Company (in Shanghai, PR China). Tetraethoxy titanium (C8H20O4Ti, ≥98%) was purchased from Aladdin Industrial Corporation (in Shanghai, PR China). L-Lysine (BR) was purchased from Beijing Biological Technology Company (in Beijing, PR China). Hydrochloric acid (38 wt%), acetic acid (38 wt%), sodium hydroxide (AR) and ethanol (AR, 99%) were all purchased from Beijing Chemical Reagent Company (in Beijing, PR China).
Fourier transform infrared (FT-IR) spectra of the samples were recorded in range of 4000–400 cm−1 with 2 cm−1 resolution on a Bruker Vector-22 Fourier transform spectrometer (made in Germany). Electronic micrographs (including energy-dispersive X-ray spectroscopy, EDS) of the samples were observed using a S-4700 scanning electron microscope (SEM, made in Japan) operated at 15 kV, a J-2010 high resolution transmission electron microscope (HRTEM, made in Japan) and a Tecnai G2 20S-TWIN transmission electron microscope (TEM, made in USA) operated at 200 kV, respectively. Crystal structures of samples were determined by powder X-ray diffraction (PXRD), using a Rigaku D/MAX diffractometer (made in Japan) with Cu Kα radiation (λ = 0.15406 nm, scanning speed = 10° min−1). N2 sorption isotherms of the samples were recorded on a Quantachrome NOVA 2000e sorption analyzer (made in USA) at the temperature of liquid nitrogen (77 K). Samples were degassed at 200 °C overnight prior to the measurement. Surface areas and pore size distributions of the samples were obtained by Brunauer–Emmett–Teller (BET) method and calculated using Barrett–Joyner–Halenda (BJH) model, respectively. UV-Vis absorption of the samples were obtained by Perkin Elmer Lambda 900 UV-Vis spectrophotometer (made in Germany) in range of 220–800 cm−1. X-ray photoelectron spectroscopic (XPS) analysis was measured on Shimadzu ESCA-250 and ESCA-1000 spectrometers (made in Japan) with Mg Kα X-ray sources.
STEM analysis was conducted on a JEOL JEM 2200FS equipped with a CEOS aberration corrector (CEOS GmbH, Heidelberg, Ger). Images and EDS maps were acquired in analytical mode (AMAG), with a probe size of 0.8 nm and a nominal beam current of 450 pA. The EDS signal was collected with a Bruker X-Flash silicon-drift detector and was processed using the Bruker Esprit software. EDS maps were collected for >10 min. The final resolution of the EDS maps was estimated to be ∼0.8 nm.
2.2. Synthesis of TiO2@SiO2 nanosphere
Silica nanosphere was used as template to synthesize TiO2 hollow nanosphere, and its synthesis was according to the method in ref. 30.
TiO2@SiO2 with core–shell structure was composited via sol–gel method. Primarily, the as-prepared SiO2 nanosphere with diameter about 25 nm was dispersed in an ethanol solution (ethanol in water) and oscillated in ultrasonic oscillator for several minutes. A solution of tetraethoxy titanium in ethanol was then added dropwise to 35 mL of the above dispersion system with continuous stirring. And a mixture solution of 35 mL of absolute ethanol, 2.0 mL acetic acid and two drops of hydrochloric acid was added to the mixture rapidly. After stirred for 30 min, the mixture was heated at 40 °C and stirred vigorously for 1.0 h. The final product TiO2@SiO2 nanosphere was obtained after the mixture was filtered, washed with water and ethanol for several times, dried at 70 °C for about 4.0 h and calcined at 550 °C for 4.0 h.
2.3. Synthesis of TiO2 hollow nanosphere
The silica template was removed by immersing TiO2@SiO2 nanosphere in a NaOH solution (3.0 M) at 60 °C for 8.0 h under continuous stirring, and the hollow nanosphere was obtained after the mixture was centrifuged, washed with ethanol and water for several times and dried at 60 °C for 4.0 h.
2.4. Synthesis of CuxO–TiO2 hollow nanosphere and CuxO–Ti–TiO2@SiO2 nanosphere
The CuxO–TiO2 hollow nanosphere and CuxO–TiO2@SiO2 nanosphere were prepared by an impregnation method using CuCl2·2H2O as source of Cu2+ ions. 1.0 g of TiO2 hollow nanosphere (or TiO2@SiO2 nanosphere) was added into 10 mL distilled water in a vial reactor. Different amounts of CuCl2·2H2O (mass percents of Cu2+ relative to TiO2 are 0.25%, 0.50% and 1.0%, respectively) were added to the above reactor, and the system was heated at 90 °C for 1.0 h under continuous stirring. The products were obtained by centrifuged, washed with water for several times and dried at 110 °C overnight. The products are named as 0.25%-CuxO–TiO2 hollow nanosphere, 0.5%-CuxO–TiO2 hollow nanosphere and 1.0%-CuxO–TiO2 hollow nanosphere, respectively; or 0.25%-CuxO–TiO2@SiO2 nanosphere, 0.5%-CuxO–TiO2@SiO2 nanosphere and 1.0%-CuxO–TiO2@SiO2 nanosphere, respectively.
2.5. Measurement of photocatalytic activities
Photocatalytic activities of the synthesized materials were evaluated by degradation of acetaldehyde in gas phase under ultraviolet and visible-light irradiations. 0.05 g microsphere powder was uniformly spread in a sample holder, which was placed on the bottom of a 500 mL cylinder-type Pyrex glass vessel. The glass vessel was flushed with O2 (20%)/N2 gas to remove carbon dioxide from the system, and the relative humidity of atmosphere inside the vessel was controlled to 45% by passing the O2/N2 gas through chilled water formerly. 5.2 mL acetaldehyde was introduced into the reaction vessel using a Pressure-Lock syringe to reach a concentration of 200 ppmv. After kept for 15 min in dark environment, the glass vessel was irradiated from top by a 150 W xenon lamp (Hayashi UV410) which emits light of wavelength range of 350–400 nm at an intensity of 3.0 mW cm−2. The degradation of acetaldehyde and the generation of carbon dioxide were monitored using a gas chromatograph (SP-2100A, BFRL Co.), equipped with a 2 m Porapak-Q column and a flame ionization detector.
The same method was used in visible-light irradiation (420 nm in wavelength and 119 mW cm−2 in intensity) to the degradation of acetaldehyde to check the photocatalytic activities of the samples.
3. Results and discussion
3.1. Characterizations of the catalysts synthesized
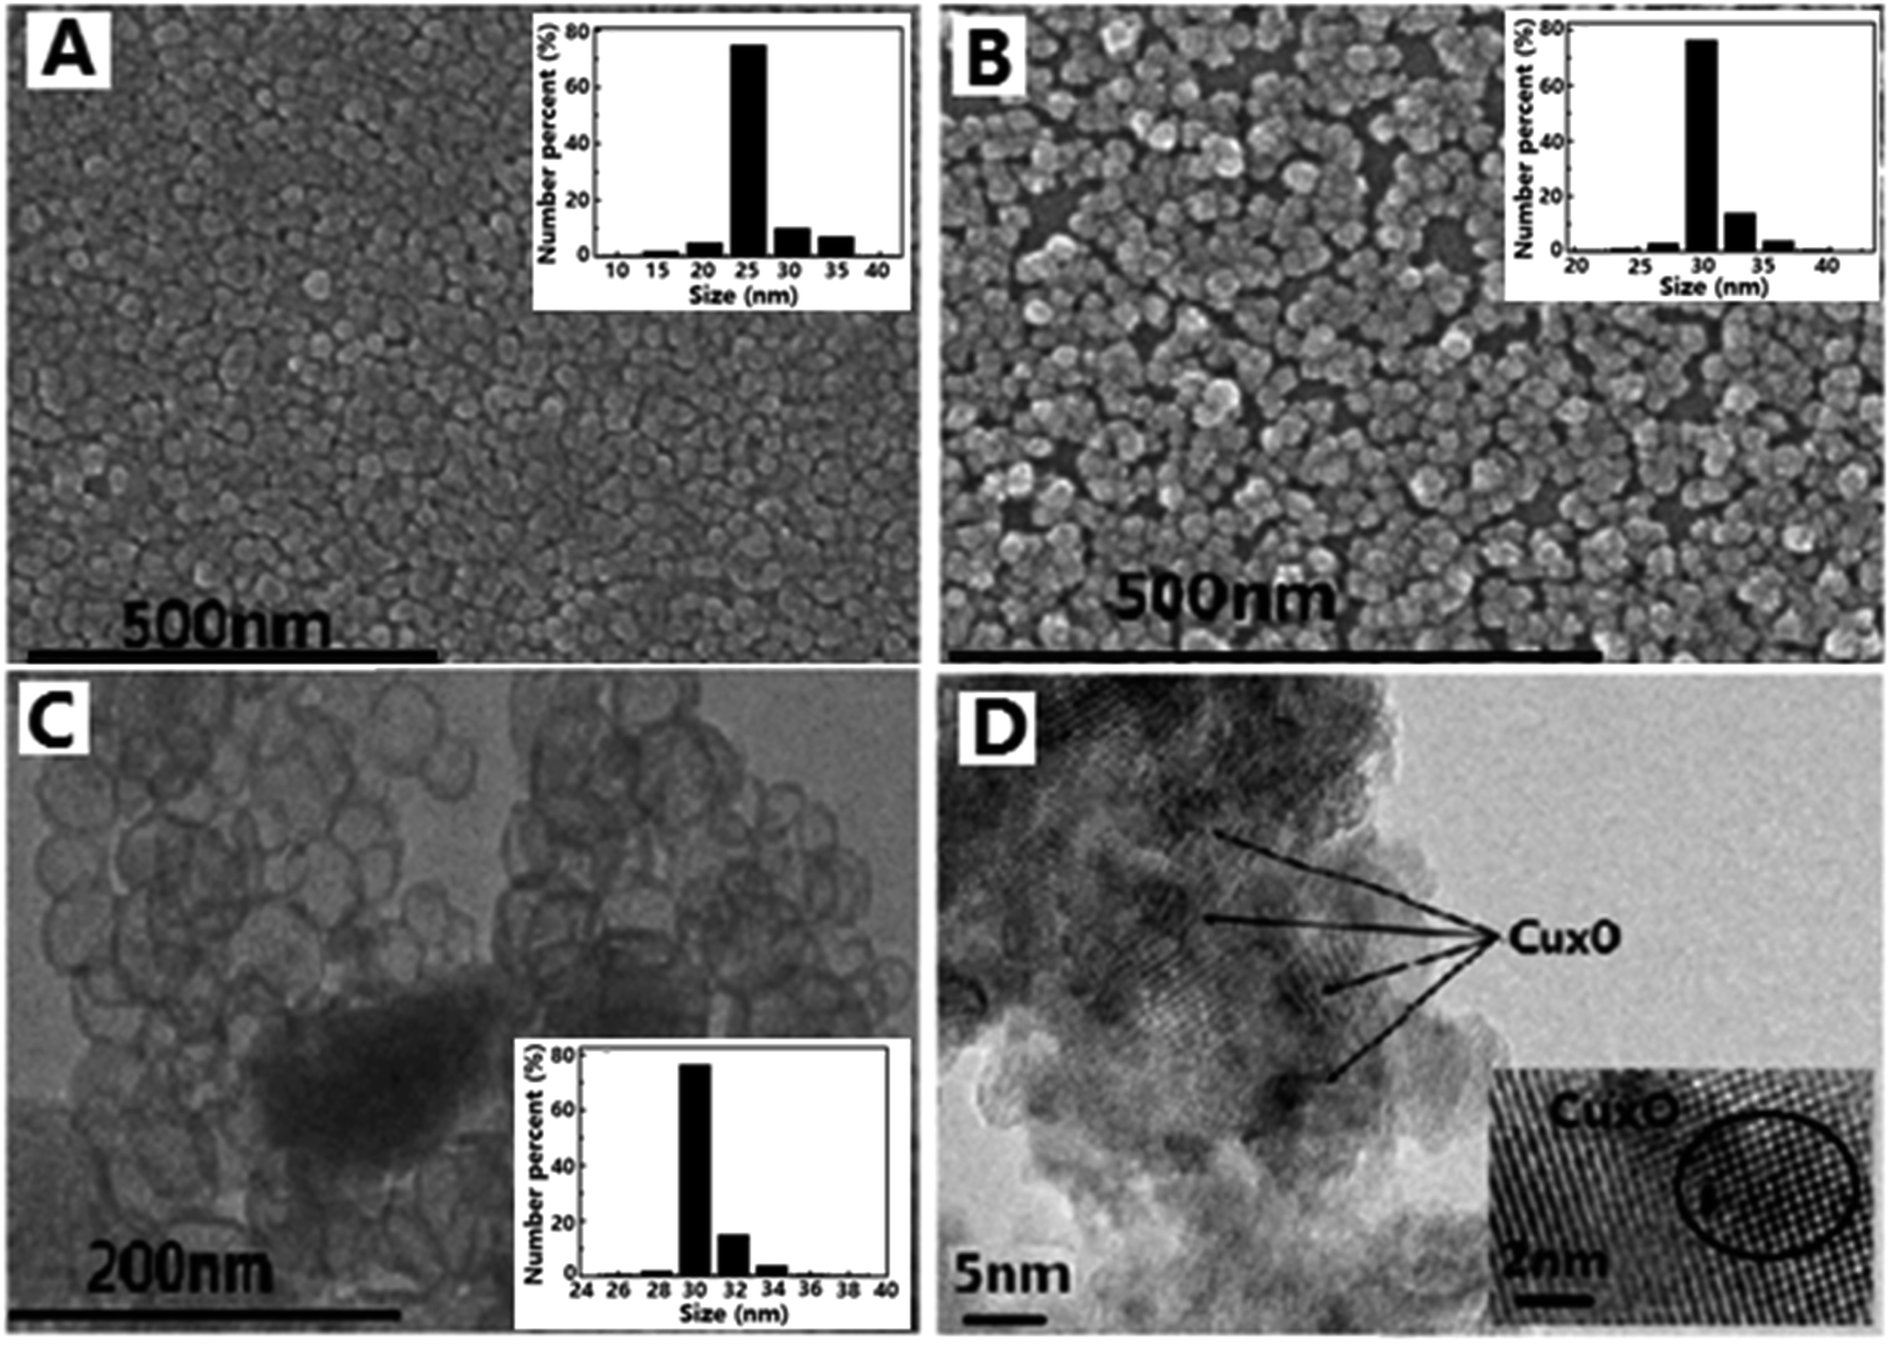
SEM images of silica nanosphere (used as template) and TiO2@SiO2 nanosphere, TEM image of TiO2 hollow nanosphere and HRTEM image of CuxO–TiO2 hollow nanosphere are shown in Fig. 1. It is found that the silica has regular ball-shape morphology with an average diameter about 25 nm (Fig. 1A). The average diameter of the microsphere increases to about 35 nm after TiO2 framework formed on the surface (Fig. 1B). After immersed in NaOH solution (3.0 M) at 60 °C for 8.0 h, Si–O structure in TiO2@SiO2 nanosphere was damaged and the shell of TiO2 remained. TEM image (Fig. 1C) indicates that final product has regular microspherical morphology with hollow structure, and its average diameter is about 35 nm. The shell thickness of these hollow microspheres is about several nanometers. HRTEM image (Fig. 1D) shows that there are CuxO clusters attached on the highly crystallized TiO2 surfaces and formed clear lattice fringes. Particle size distributions of unmodified SiO2 nanosphere, TiO2@SiO2 nanosphere and TiO2 hollow nanosphere are also shown in Fig. 1.
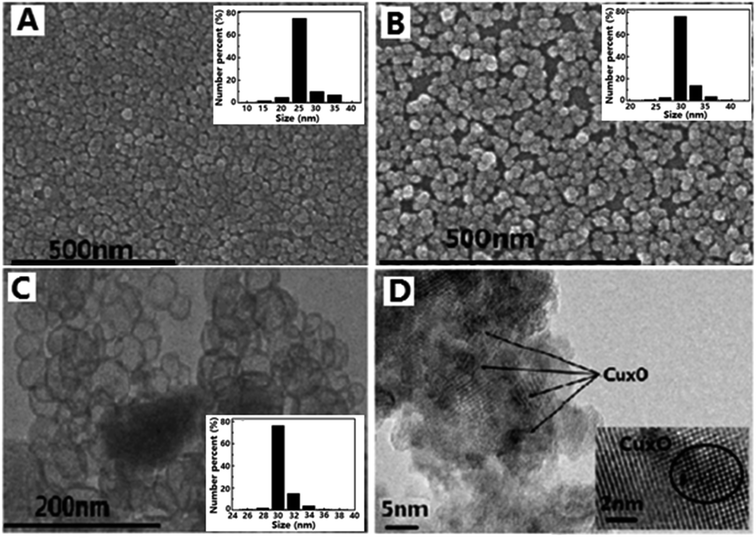 |
| | Fig. 1 SEM images and particle size distributions of unmodified SiO2 (A) nanosphere and TiO2@SiO2 nanosphere (B); TEM image and particle size distribution of TiO2 hollow nanosphere (C) and HRTEM image of CuxO–TiO2 hollow nanosphere (D). | |
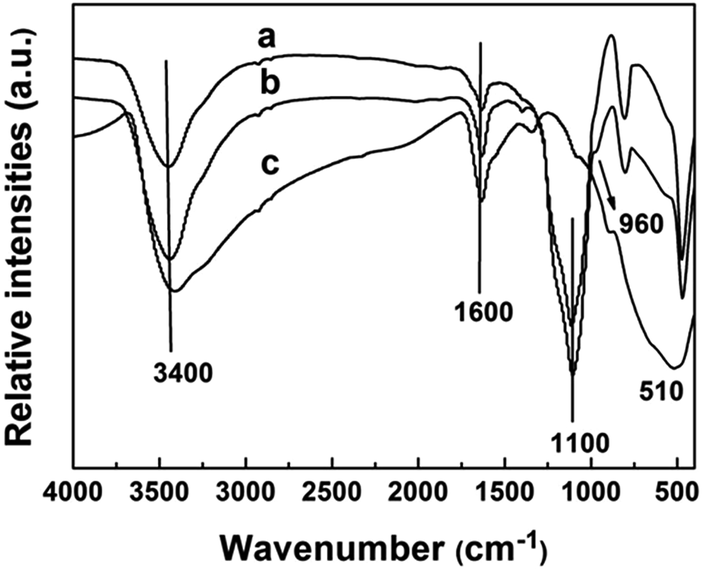
The FT-IR spectra of SiO2 nanosphere, TiO2@SiO2 nanosphere and TiO2 hollow nanosphere are shown in Fig. 2. All the samples have stretching and bending vibrations absorptions of hydroxyl groups from surface of the samples and the adsorbed water, which are at 3400 and 1600 cm−1 respectively.31 The antisymmetric stretching vibration absorption of Si–O–Si in SiO2 (Fig. 2a) and TiO2@SiO2 nanospheres (Fig. 2b) are found at 1100 cm−1, but it cannot be observed in Fig. 2c. Disappearance of Si–O–Si absorption in Fig. 2c indicates that there isn't any SiO2 in the TiO2 hollow nanosphere. Vibration absorption of Ti–O–Si in TiO2@SiO2 (Fig. 2b) is found at 960 cm−1,32 indicating that the framework of (Ti–O)n was connected on the surface of silica gel after tetraethoxy titanium was adsorbed and hydrolyzed. At the same time, the absorptions of Ti–O in TiO2@SiO2 and TiO2 hollow nanospheres are found at about 520 cm−1.
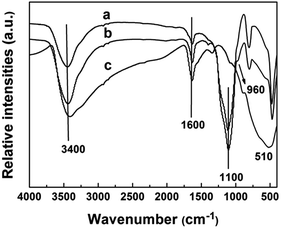 |
| | Fig. 2 FT-IR spectra of SiO2 nanosphere (a), TiO2@SiO2 nanosphere (b) and TiO2 hollow nanosphere (c). | |
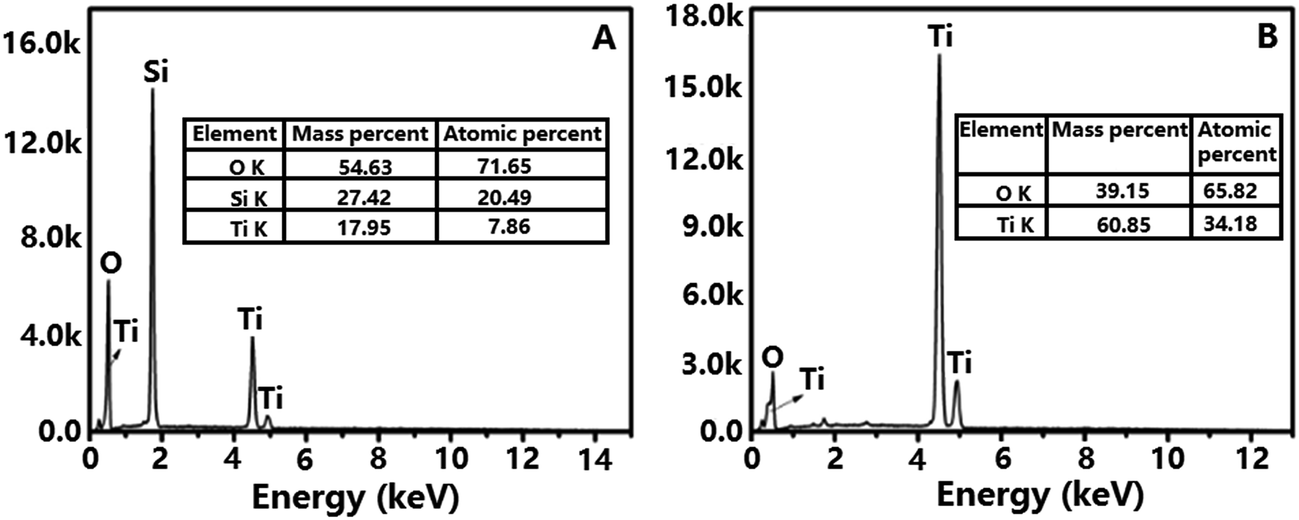
EDS spectrum of TiO2@SiO2 nanosphere (Fig. 3A) shows that the nanosphere is consisted by Si (20.49%), Ti (7.86%) and O (71.65%) elements, proving the existence of both SiO2 and TiO2 frameworks in the sample. Calculation indicates that the proportion of TiO2 and SiO2 in TiO2@SiO2 nanosphere is about 1![[thin space (1/6-em)]](https://www.rsc.org/images/entities/char_2009.gif) :3. However, only Ti and O elements are found in Fig. 3B, and the proportion of Ti and O is about 1:2, which confirms the removal of template and generation of TiO2 hollow nanosphere.
:3. However, only Ti and O elements are found in Fig. 3B, and the proportion of Ti and O is about 1:2, which confirms the removal of template and generation of TiO2 hollow nanosphere.
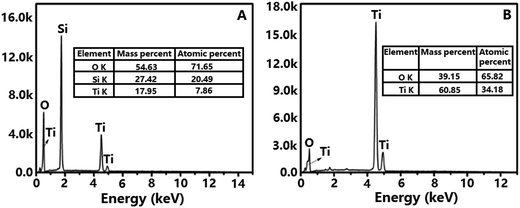 |
| | Fig. 3 EDS spectra of TiO2@SiO2 nanosphere (A) and TiO2 hollow nanosphere (B). | |
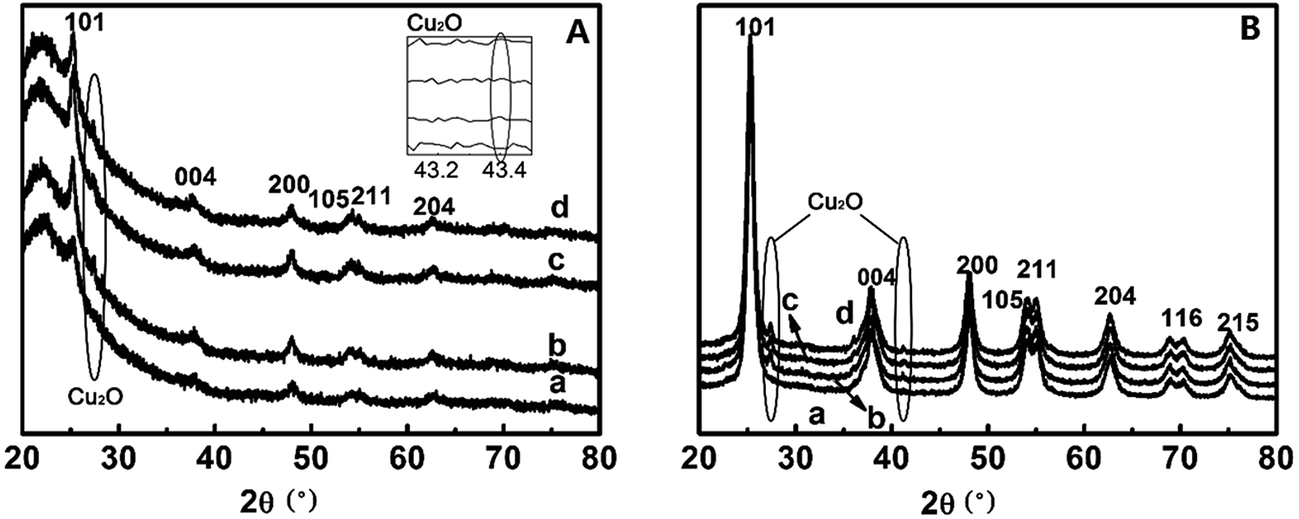
The crystal phases of TiO2 largely determines their suitabilities for photocatalytic activities.33,34 The powder X-ray diffraction (PXRD) patterns of TiO2@SiO2 nanosphere and TiO2 hollow nanospheres deposited by different concentrations of Cu2+ ions are shown in Fig. 4. Six characteristic peaks of anatase TiO2 are observed at 25.2° (101), 37.8° (004), 48.1° (200), 53.9° (105), 56.1° (211) and 62.7° (204) in CuxO–TiO2@SiO2 nanospheres (Fig. 4A), which are indexed to diffractions of TiO2 (ref. 35) except for the diffractions of SiO2 at 21.79°. However, when the Cu content in the nanocomposite, diffraction peaks of two weak diffractions of CuxO (CuO and Cu2O) were observed in 27.5° and 42.3°.36 As to CuxO–TiO2 hollow nanosphere (Fig. 4B), seven characteristic diffractions from anatase TiO2 are observed, and all the diffractions are stronger than the corresponding diffractions in CuxO–TiO2@SiO2 nanosphere. Also the diffractions associated with Cu2O at 27.5° and 42.3° on the surface of TiO2 hollow nanosphere are found (Fig. 4B). All the results indicate that CuxO was attached to the surface of TiO2, and the diffraction intensity from Cu2O increases with its content. Elemental mapping analysis of the sample CuxO–TiO2 hollow nanosphere (shown in Fig. S1 in the ESI†) indicates that the Cu element distributed uniformly though its content on TiO2 surface was little.
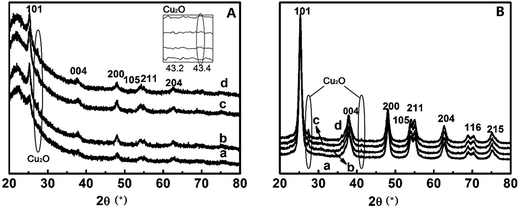 |
| | Fig. 4 (A) XRD patterns of TiO2@SiO2 nanospherical ((a) TiO2@SiO2; (b) 0.25%-CuxO–TiO2@SiO2; (c) 0.5%-CuxO–TiO2@SiO2; (d) 1.0%-CuxO–TiO2@SiO2); (B) XRD patterns of TiO2 hollow nanospherical materials ((a) TiO2 hollow sphere; (b) 0.25%-CuxO–TiO2 hollow sphere; (c) 0.5%-CuxO–TiO2 hollow sphere; (d) 1.0%-CuxO–TiO2 hollow sphere). | |
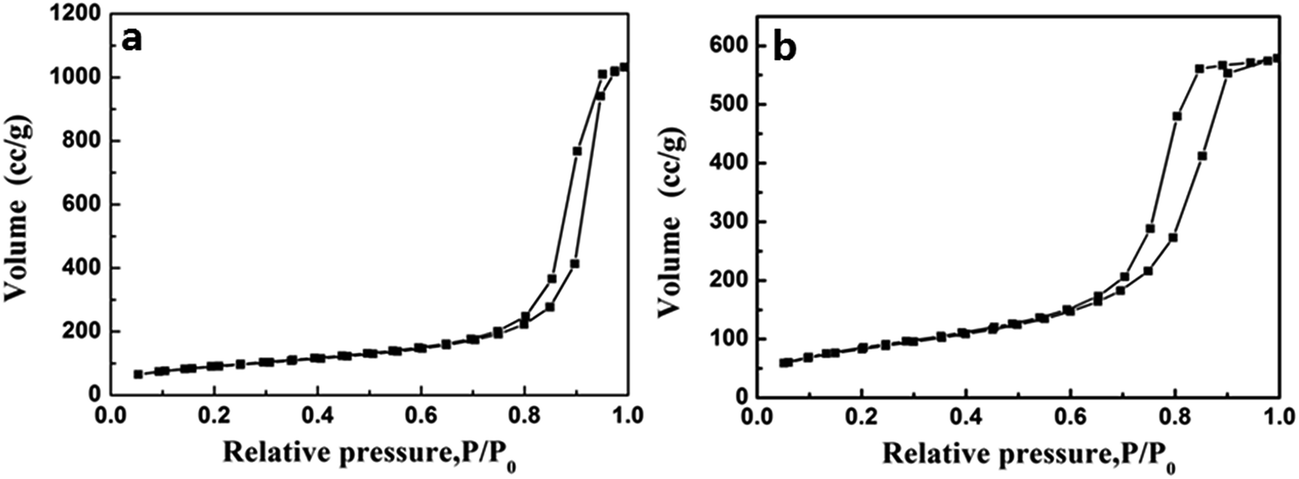
Nitrogen adsorption–desorption isotherms of TiO2@SiO2 and TiO2 hollow nanospheres are shown in Fig. 5. Isotherms exhibiting behavior between those of types I and IV are characteristic of mesopores, according to IUPAC classifications. In addition, the prepared TiO2@SiO2 nanosphere and TiO2 hollow nanosphere own surface areas of 251 m2 g−1 and 402 m2 g−1, pore volumes of 0.613 cm3 g−1 and 0.983 cm3 g−1, respectively. These parameters are far more than those of P25 (49 m2 g−1 of surface area and 0.090 cm3 g−1 of pore volume), a kind of commercial TiO2 microsphere.
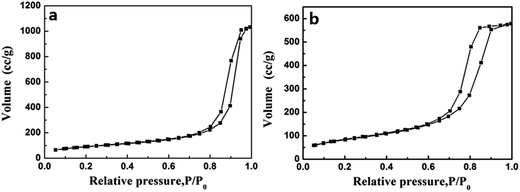 |
| | Fig. 5 The N2 adsorption–desorption isotherms of TiO2@SiO2 nanosphere (a) and TiO2 hollow nanosphere (b). | |
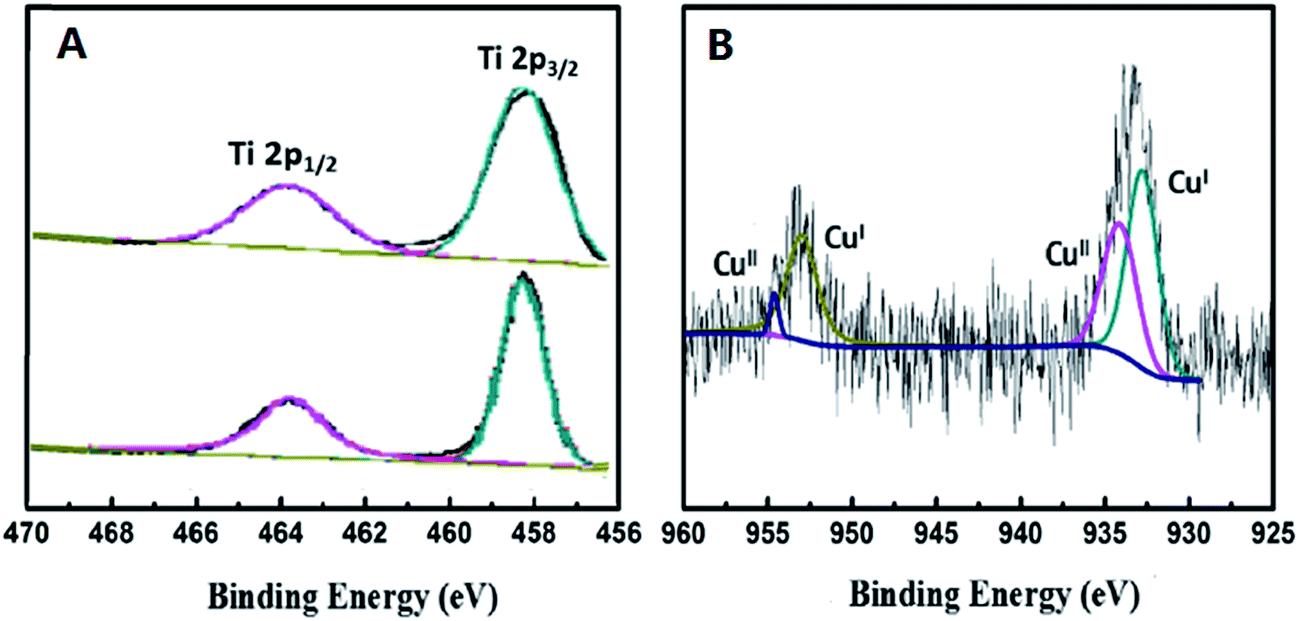
In order to explore the chemical states of some relative elements in the nanocomposite samples, X-ray photoelectron spectroscopy (XPS) was carried out. In Fig. 6A, two peaks at 463.9 eV and 458.2 eV were observed from the Ti 2p spectrum, which are assigned to Ti 2p1/2 and Ti 2p3/2. No obvious differences were observed between the two spectra of TiO2 and 0.5%-CuxO–TiO2 hollow nanospheres, which indicate that CuxO was deposited on the surface of TiO2 hollow nanospheres rather than the lattice. As shown in Fig. 6B, the appearance of CuO can be confirmed by the binding energies of 934.6 and 954.5 eV, respectively. There are another two characteristic peaks located at binding energies of 932.5 and 952.5 eV, which can be assigned to Cu(I) in Cu2O.37 Mole ratio of Cu+ to Cu2+ is about 1.6:1, which calculated from the peak area in Fig. 6B. In process of the reaction, the hydrated Cu2+ ions were firstly adsorbed on the surface of TiO2 hollow nanospheres. Some of Cu2+ ions were hydrolyzed to Cu(OH)2 in this system, and later they were changed into CuO under a certain temperature (110 °C). Due to the semiconductive property, the electron–holes in TiO2 would be separated under illumination of UV-light in the sunshine, and the electrons separated would be transferred to Cu(II) to form Cu2O.
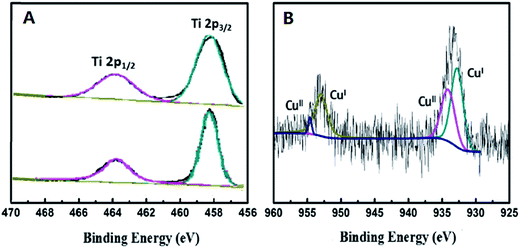 |
| | Fig. 6 XPS analysis of Ti 2p in TiO2 hollow nanosphere (A) and Cu 2p in 0.5%-CuxO–TiO2 hollow nanosphere (B). | |
UV-Vis absorption spectra (shown in Fig. 7) indicate that all the samples, including TiO2@SiO2 nanosphere, TiO2 hollow nanosphere, CuxO–TiO2@SiO2 nanosphere and CuxO–TiO2 hollow nanosphere, have the intrinsic interband absorptions of TiO2 at about 400 nm. The weak absorptions in range of 400–500 nm are assigned to the interfacial charge transfer in CuxO–TiO2@SiO2 nanosphere and CuxO–TiO2 hollow nanosphere. In addition, the absorptions from 600 to 800 nm in the spectra of CuxO–TiO2@SiO2 nanosphere and CuxO–TiO2 hollow nanosphere are assigned to the intrinsic excitation band of CuxO and the d–d transition of Cu(II).33 Sequence of absorption intensities in range of 500–800 nm of the relative materials is TiO2@SiO2 nanosphere ≅ TiO2 hollow nanosphere < CuxO–TiO2@SiO2 nanosphere < CuxO–TiO2 hollow nanosphere, indicating that the Cu2+ ions on the surface of TiO2 strengthen the absorption of the host in visible-light region, and the intensified degree on the absorptions increases with the increasing contents of Cu element in the composite materials, especially to TiO2 hollow nanosphere.
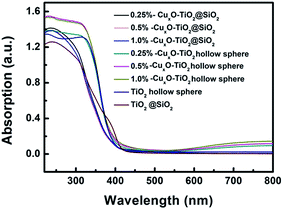 |
| | Fig. 7 UV-Vis absorption spectra of TiO2@SiO2, TiO2 hollow nanosphere and CuxO–TiO2@SiO2 and CuxO–TiO2 hollow nanospheres. | |
3.2. Studies on catalytic activities of the catalysts
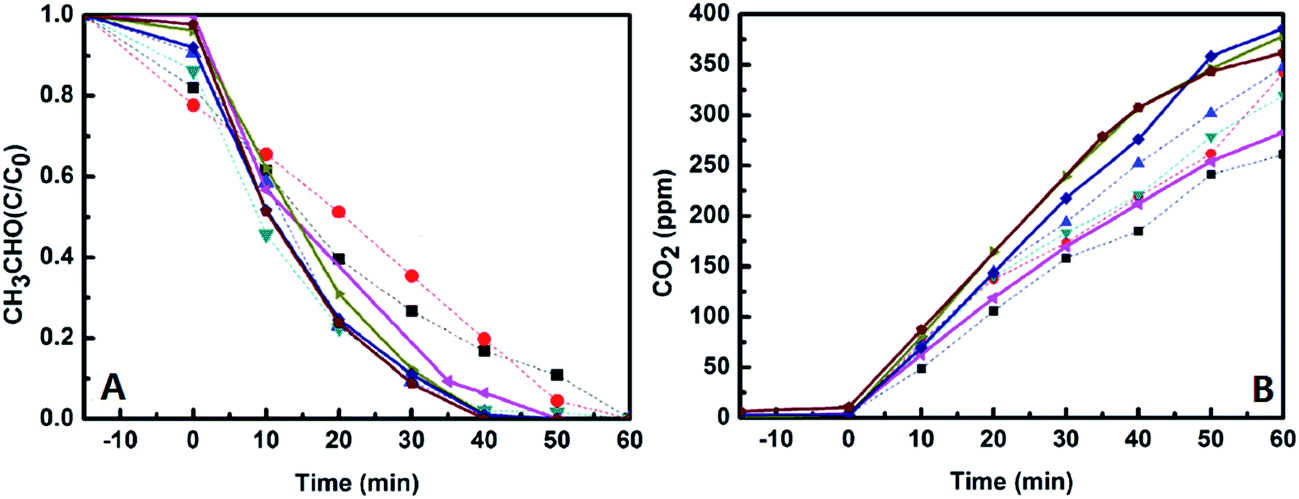
Photocatalytic activities of the catalysts were evaluated by monitoring degradation of acetaldehyde under UV-light and visible-light irradiations, and the initial concentration of acetaldehyde gas in all the experiments is about 200 ppmv. The first is to check the activities of the catalysts in a dark environment without any light irradiation. It was found that the concentration of acetaldehyde was almost not changed except for a little amount of acetaldehyde adsorbed (less than 20% of acetaldehyde adsorbed and less than 5% of CO2 produced, which could be found from Fig. 8), which means that the acetaldehyde was not decomposed in dark under existence of the catalysts. However, the degradation of acetaldehyde happened when the reactor was irradiated by UV-light or visible-light, and large amount of CO2 generated at the same time. Fig. 8 and 9 display the degradation of acetaldehyde and the generation of CO2 in the systems under UV-light and visible-light irradiations, respectively. As shown in Fig. 8, the catalytic performance of TiO2 hollow nanosphere was superior to TiO2@SiO2 nanosphere. Also it was found that the content of copper on the surface of TiO2 affected the activities of catalysts deeply. The catalytic efficiency of 0.5%-CuxO–TiO2 hollow nanosphere is higher than that of 0.25%-CuxO–TiO2 hollow nanosphere. When the copper content is up to 0.5%, increase on catalytic efficiency of the hollow nanosphere is not evident. The above-mentioned regularity can be also found in the CuxO–TiO2@SiO2 nanospherical system. The decomposed rate of acetaldehyde by different catalysts under UV-light irradiation can be calculated by amount of the residual acetaldehyde and the generated CO2. In the system of 0.5%-CuxO–TiO2 hollow nanosphere, about 99.72–99.74% acetaldehyde was degraded after 60 minutes. Some data relating to degradation efficiency of acetaldehyde under UV-light and visible-light irradiations catalyzed by the relative catalysts are list in Tables 1 and 2. The clearance ratio is specific value of practical production and theoretical yield of CO2.
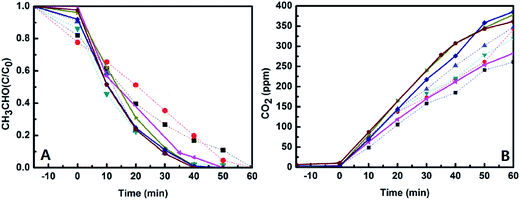 |
| | Fig. 8 Degradation of acetaldehyde with the variation of times (A) and amount of CO2 generated (B) under UV light irradiation and existence of the catalysts ( : TiO2@SiO2; : TiO2@SiO2;  : 0.25%-CuxO–TiO2@SiO2; : 0.25%-CuxO–TiO2@SiO2;  : 0.5%-CuxO–TiO2@SiO2; : 0.5%-CuxO–TiO2@SiO2;  : 1.0%-CuxO–TiO2@SiO2; : 1.0%-CuxO–TiO2@SiO2;  : TiO2 hollow sphere; : TiO2 hollow sphere;  : 0.25%-CuxO–TiO2 hollow sphere; : 0.25%-CuxO–TiO2 hollow sphere;  : 0.5%-CuxO–TiO2 hollow sphere; : 0.5%-CuxO–TiO2 hollow sphere;  : 1.0%-CuxO–TiO2 hollow sphere). : 1.0%-CuxO–TiO2 hollow sphere). | |
 |
| | Fig. 9 Degradation of acetaldehyde with the variation of times (A) and amount of CO2 generated (B) under visible light irradiation and existence of the catalysts ( : TiO2@SiO2; : TiO2@SiO2;  : 0.25%-CuxO–TiO2@SiO2; : 0.25%-CuxO–TiO2@SiO2;  : 0.5%-CuxO–TiO2@SiO2; : 0.5%-CuxO–TiO2@SiO2;  : 1.0%-CuxO–TiO2@SiO2; : 1.0%-CuxO–TiO2@SiO2;  : TiO2 hollow sphere; : TiO2 hollow sphere;  : 0.25%-CuxO–TiO2 hollow sphere; : 0.25%-CuxO–TiO2 hollow sphere;  : 0.5%-CuxO–TiO2 hollow sphere; : 0.5%-CuxO–TiO2 hollow sphere;  : 1.0%-CuxO–TiO2 hollow sphere). : 1.0%-CuxO–TiO2 hollow sphere). | |
Table 1 Initial concentration of acetaldehyde, the amount of CO2 generated and decomposed rate of acetaldehyde after 60 minutes under UV light irradiation (THN: TiO2 hollow nanosphere, TS: TiO2@SiO2)
| Sample |
TS |
0.25% CuxO–TS |
0.5% CuxO–TS |
1.0% CuxO–ST |
THN |
0.25% CuxO–THN |
0.50% CuxO–THN |
1.0% CuxO–THN |
| CCH3CHO (ppmv) |
193.611 |
194.139 |
181.5 |
193.842 |
180.361 |
199.796 |
193.545 |
186.103 |
| CCO2 (ppmv) |
260.989 |
342.129 |
347.763 |
319.558 |
282.625 |
378.431 |
386.044 |
361.759 |
| Decomposed rate (%) |
67.39–67.41 |
88.10–88.12 |
95.78–95.80 |
82.42–82.44 |
78.17–78.19 |
94.69–94.71 |
99.72–99.74 |
97.19–97.21 |
Table 2 Initial concentration of acetaldehyde, the amount of CO2 generated and decomposed rate of acetaldehyde after 6 hours under visible light irradiation (THN: TiO2 hollow nanosphere, TS: TiO2@SiO2)
| Sample |
TS |
0.25%-CuxO–TS |
0.5%-CuxO–TS |
1.0%-CuxO–TS |
THN |
0.25%-CuxO–THN |
0.5%-CuxO–THN |
1.0%-CuxO–THN |
| CCH3CHO (ppmv) |
197.620 |
179.355 |
180.328 |
183.991 |
174.042 |
178.035 |
192.159 |
200.409 |
| CCO2 (ppmv) |
50.635 |
71.583 |
74.029 |
62.534 |
71.488 |
205.675 |
241.276 |
168.007 |
| Decomposed rate (%) |
12.80–12.82 |
19.95–19.97 |
20.52–20.54 |
17.69–17.71 |
20.53–20.55 |
54.99–55.01 |
62.77–62.79 |
41.91–41.93 |
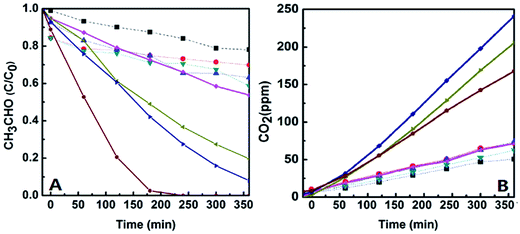
Meanwhile, degradations of acetaldehyde irradiated under visible-light under the catalysts were studied, which are shown in Fig. 9. Little CO2 generated from degradation of acetaldehyde under the existence of TiO2@SiO2 nanosphere and TiO2 hollow nanosphere for the wide band gap of TiO2. However in CuxO–TiO2 hollow nanospherical systems, acetaldehyde could be degraded to CO2 commendably despite of the efficiencies lower than in UV-light. There is about 62.77–62.79% acetaldehyde was degraded in 0.5%-CuxO–TiO2 hollow nanosphere catalytic system, and the catalyst exhibits the best catalytic performance among all the catalysts. Only 20.52–20.54% of acetaldehyde was degraded in 0.5%-CuxO–TiO2@SiO2 nanosphere catalytic system. Concentration of CO2 generated in 0.5%-CuxO–TiO2 hollow nanosphere system reached 241 ppm after 6 h, which is more than three times to the CO2 generated in CuxO–TiO2@SiO2 nanosphere system (74 ppm) in the same time. Such high degradation efficiency of acetaldehyde under visible-light irradiation was seldom reported.
Photocatalytic reaction under existence of the semiconductor is a complicated phenomenon. It includes light absorption, stimulation and transference of the carrier and redox reaction on the catalyst surface. Position of energy band determined by the electronic structure in the semiconductor is one of the main controlling factors on photocatalytic activity, which affects range of the light wavelength on catalyst responsibility directly. The visible-light is considered to initiate interfacial charge transfer. Electrons in the valence band (VB) of TiO2 are directly transferred to Cu(II) to form Cu(I), as well as holes (h+) in the VB of TiO2. Thus, the energy to separate electrons and holes becomes low, which narrows the band gap of TiO2 and prolongs the absorption edge from UV-light to visible-light region. The holes produced in VB of TiO2 decompose organic substances. The catalytic degradation mechanism of acetaldehyde is shown in the following equations:38
| CH3CHO + O2− → CH3CO˙ + HO2− |
| CH3CHO + HO2− → CH3CO− + H2O2 |
| H2O2 + CH3CO˙ → CH3COOH + ˙OH |
| CH3CO− + ˙OH → CH3COOH + e− |
| CH3COOH + 2H2O + 8h+ → 2CO2 + 10H+ |
Due to the larger surface area and more exposed active sites, the catalytic activity of CuxO–TiO2 hollow nanosphere is higher than that of the catalyst CuxO–TiO2@SiO2 nanosphere. Moreover, the separation of electrons and holes became easier with Cu2+ increased on the surface of TiO2, and superior catalytic activity of the catalyst was exhibited.
4. Conclusions
In summary, four kinds of photocatalysts, TiO2@SiO2 nanosphere, TiO2 hollow nanosphere, CuxO–TiO2@SiO2 nanosphere and CuxO–TiO2 hollow nanosphere, were synthesized. All the materials were found to have good photocatalytic activities in degradation of acetaldehyde under UV-light irradiations. Compared with TiO2@SiO2 nanosphere, TiO2 hollow nanosphere and CuxO–TiO2@SiO2 nanosphere, CuxO–TiO2 hollow nanosphere was superior for being used as catalyst in degradation of acetaldehyde under visible-light irradiation. The impregnated Cu2+ ions on the surface of TiO2 hollow nanosphere were possibly to enhance the separation of photogenerated charge carriers.
Conflict of interest
The authors declare no competing financial interest.
Acknowledgements
We thank the projects of National Natural Science Foundation of China (No. U1362113 and No. 21521005) and the PetroChina Co. Ltd. For financial support.
References
- B. Peng, L. F. Tan, C. Dong, X. W. Meng and F. Q. Tang, ACS Appl. Mater. Interfaces, 2012, 4, 96–101 CAS.
- S. Sandoval, J. Yang, J. G. Alfaro, A. Liberman and M. Makale, Chem. Mater., 2012, 24, 4222–4230 CrossRef CAS PubMed.
- L. Li, Y. Chen, S. Jiao, Z. Fang, X. Liu and Y. Xu, Mater. Des., 2016, 100, 235–240 CrossRef CAS.
- S. Son, H. H. Sun, C. Kim, Y. Y. Ju and J. Jang, ACS Appl. Mater. Interfaces, 2013, 5, 4815–4820 CAS.
- T. Sreethawong, S. Ngamsinlapasathian and S. Yoshikawa, J. Colloid Interface Sci., 2014, 430, 184–192 CrossRef CAS PubMed.
- K. Nishizawa, E. Watanabe and M. Maeda, Mater. Sci. Appl., 2014, 5, 112–123 CAS.
- F. Akira, X. Zhang and D. A. Tryk, Surf. Sci. Rep., 2008, 63, 515–582 CrossRef.
- N. Guo, Y. M. Liang, S. Lan, L. Liu and G. J. Ji, Appl. Surf. Sci., 2014, 305, 562–574 CrossRef CAS.
- D. M. Chen, H. Zhu and X. Wang, Appl. Surf. Sci., 2014, 319, 158–166 CrossRef CAS.
- Z. N. Song, M. Fathizadeh, Y. Huang, K. H. Chu, Y. Yoon and L. Wang, J. Membr. Sci., 2016, 510, 72–78 CrossRef CAS.
- Y. Chi, Q. Yuan, Y. Li, L. Zhao, N. Li and X. Li, J. Hazard. Mater., 2013, 262, 404–411 CrossRef CAS PubMed.
- M. Strauss, M. Pastorello, F. A. Sigoli and J. M. Silva, Appl. Surf. Sci., 2014, 319, 151–157 CrossRef CAS.
- L. Jing, W. Jia, Y. Qu and Y. Luan, Appl. Surf. Sci., 2009, 256, 657–663 CrossRef CAS.
- K. J. A. Raj and B. Viswanathan, Indian J. Chem., 2009, 48, 1378–1382 Search PubMed.
- Y. Bessekhouad, D. Robert and J. V. Weber, J. Photochem. Photobiol., A, 2004, 163, 569–580 CrossRef CAS.
- S. G. Kumar and L. G. Devi, J. Phys. Chem. A, 2011, 115, 13211–13241 CrossRef CAS PubMed.
- H. Fang, V. Kambala, M. Srinivasan, D. Rajarathnam and R. Naidu, Appl. Catal., A, 2009, 359, 25–40 CrossRef.
- R. Liu, F. Ren, W. Su, P. He, C. Shen and L. Zhang, Ceram. Int., 2015, 41, 14615–14620 CrossRef CAS.
- Z. Song, M. Fathizadeh, Y. Huang, K. H. Chu, Y. Yoon and L. Wang, J. Membr. Sci., 2016, 510, 72–78 CrossRef CAS.
- S. Ullah, E. P. Ferreira-Neto, A. A. Pasa, C. C. J. Alcântara, J. J. S. Acuña and S. A. Bilmes, Appl. Catal., B, 2015, 179, 333–343 CrossRef CAS.
- E. Pakdel and W. A. Daoud, J. Colloid Interface Sci., 2013, 401, 1–7 CrossRef CAS PubMed.
- G. K. Mor, K. Shankar, M. Paulose, O. K. Varghese and C. A. Grimes, Nano Lett., 2006, 6, 215–218 CrossRef CAS PubMed.
- R. Wang, X. Cai and F. Shen, Ceram. Int., 2013, 39, 9465–9470 CrossRef CAS.
- H. Song, S. You, T. Chen and X. Jia, J. Mater. Sci.: Mater. Electron., 2015, 26, 1–9 CrossRef.
- M. Miyauchi, A. Nakajima, K. Hashimoto and T. Watanabe, Adv. Mater., 2000, 1, 1923–1927 CrossRef.
- H. Irie, K. Kamiya, T. Shibanuma, S. Miura, D. A. Tryk and T. Yokoyama, J. Phys. Chem. C, 2009, 113, 10761–10766 CAS.
- J. Huang, S. Wang, Y. Zhao, X. Wang and S. Wang, Catal. Commun., 2006, 7, 1029–1034 CrossRef CAS.
- L. Gnanasekaran, R. Hemamalini and K. Ravichandran, J. Saudi Chem. Soc., 2015, 19, 589–594 CrossRef.
- L. Gnanasekaran, R. Hemamalini and R. Saravanan, et al., J. Mol. Liq., 2016, 223, 652–659 CrossRef CAS.
- Y. Kuroda, Y. Sakamoto and K. Kuroda, J. Am. Chem. Soc., 2012, 134, 8684–8692 CrossRef CAS PubMed.
- L. Zhang, Z. Xing, H. Zhang, Z. Li, X. Wu and X. Zhang, Appl. Catal., B, 2016, 180, 521–529 CrossRef CAS.
- L. Wu, Y. Zhou, W. Nie, L. Song and P. Chen, Appl. Surf. Sci., 2015, 351, 320–326 CrossRef CAS.
- P. Zhang, Y. Yu, E. Wang, J. Wang, J. Yao and Y. Cao, ACS Appl. Mater. Interfaces, 2014, 6, 4622–4629 CAS.
- K. T. Kim, G. Ali, K. Y. Chung, C. S. Yoon, H. Yashiro and Y. K. Sun, Nano Lett., 2014, 14, 416–422 CrossRef CAS PubMed.
- S. A. Bakar and C. Ribeiro, Appl. Surf. Sci., 2016, 377, 121–133 CrossRef CAS.
- X. Qiu, M. Miyauchi, K. Sunada, M. Minoshima, M. Liu and Y. Lu, ACS Nano, 2011, 6, 1609–1618 CrossRef PubMed.
- Q. Hu, J. Huang, G. Li, J. Chen, Z. Zhang and Z. Deng, Appl. Surf. Sci., 2016, 369, 201–206 CrossRef CAS.
- P. Zhang, F. Liang, G. Yu, Q. Chen and W. Zhu, J. Photochem. Photobiol., A, 2003, 156, 189–194 CrossRef CAS.
Footnote |
| † Electronic supplementary information (ESI) available. See DOI: 10.1039/c7ra05281b |
|
| This journal is © The Royal Society of Chemistry 2017 |
Click here to see how this site uses Cookies. View our privacy policy here. 
 Open Access Article
 This Open Access Article is licensed under a Creative Commons Attribution-Non Commercial 3.0 Unported Licence
 b,
Annan Zhoua,
Nan Jinga and
Qinghong Xu
b,
Annan Zhoua,
Nan Jinga and
Qinghong Xu

 : TiO2@SiO2;
  : 0.25%-CuxO–TiO2@SiO2;
  : 0.5%-CuxO–TiO2@SiO2;
  : 1.0%-CuxO–TiO2@SiO2;
  : TiO2 hollow sphere;
  : 0.25%-CuxO–TiO2 hollow sphere;
  : 0.5%-CuxO–TiO2 hollow sphere;
  : 1.0%-CuxO–TiO2 hollow sphere).
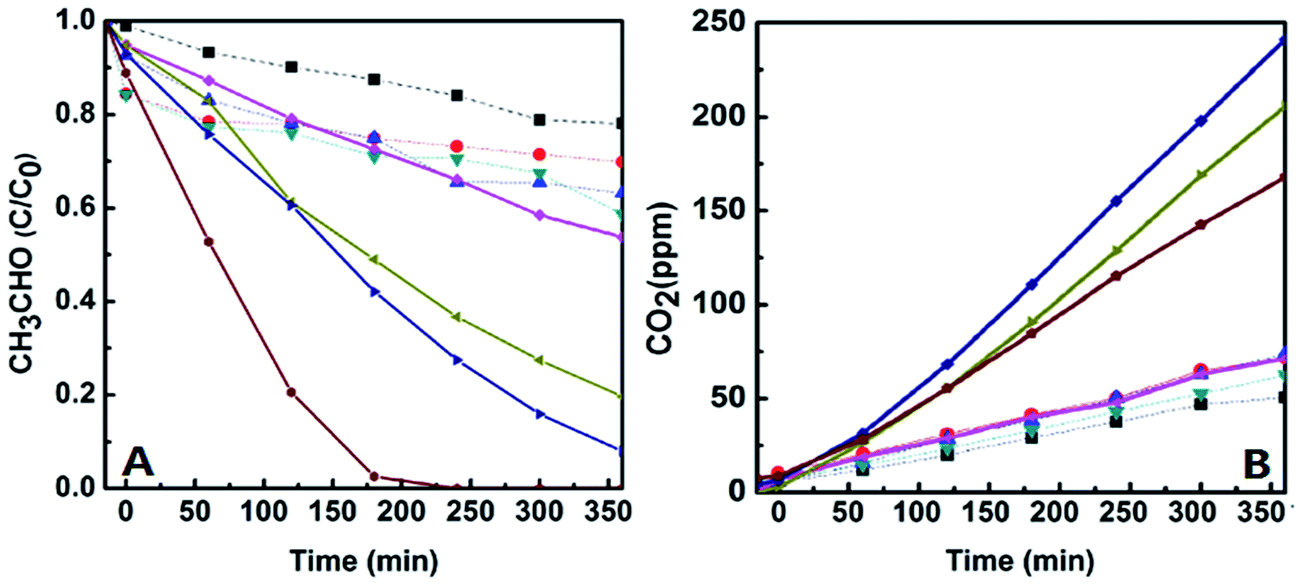
 : TiO2@SiO2;
  : 0.25%-CuxO–TiO2@SiO2;
  : 0.5%-CuxO–TiO2@SiO2;
  : 1.0%-CuxO–TiO2@SiO2;
  : TiO2 hollow sphere;
  : 0.25%-CuxO–TiO2 hollow sphere;
  : 0.5%-CuxO–TiO2 hollow sphere;
  : 1.0%-CuxO–TiO2 hollow sphere).