DOI:
10.1039/C7RA05512A
(Paper)
RSC Adv., 2017,
7, 32367-32382
A phenomenological thermodynamic approach for evaluating the energetics involved in the discharge of lithium ion battery
Received
16th May 2017
, Accepted 2nd June 2017
First published on 23rd June 2017
Abstract
Processes involved in the discharge of a Li-ion battery are represented via thermochemical cycle, and the free energy involved in the process is expressed in terms of porosity, redox potential, energetics of solvation, diffusion, phase transition, and double-layer crossing of Li ions. In this study, the value of free energy involved in the discharge process of LiMn2O4 is evaluated. The maximum threshold of anode porosity and effect of Jahn–Teller distortion on the cathode material are predicted accurately. The maximum threshold of porosity for graphite anode is 0.4 to 0.5 and the Jahn–Teller distortion energy is predicted to be −0.84 eV. Phase transition is predicted to occur at 0.5 SoC of Li ions at the cathode. The predicted values are in satisfactory agreement with those reported in the literature.
1. Introduction
In systems engineering, modeling extensively permits the interpretation of experimental data, identification of rate-limiting steps and prediction of system behavior. It also provides a thorough understanding of the underlying physical processes. Mostly, for design and control, empirical models with fitted parameters are frequently used, although it is preferable to employ models based on microscopic physical or geometrical parameters as they are easy to interpret and optimize. Equivalent circuit models (ECMs) are widely used for electrochemical energy storage devices such as batteries, fuel cells, and supercapacitors in conjunction with impedance spectroscopy to fit and predict the performance and degradation of cells.1 The limitations of ECMs are their unambiguity in interpreting fitted circuit elements and predicting the nonlinear response of high operating currents. Hence, as an alternative, physics-based porous electrode models were developed for battery optimization and control.1 From first principles calculations employing quantum mechanics, bulk material properties, such as open-circuit potential and solid diffusivity, were predicted.2 To investigate and understand the multi-length and time scales of interfacial reactions, multi-phase, multi-component transport properties of coarse-grained continuum models were employed.
For applications such as in electric vehicles and electrical energy storage for solar and wind sources with high power and energy density requirements, mathematical modeling plays an inevitable role in the development of new intercalation materials, electrode microstructures, battery architectures, etc. The standard modeling methodology was provided by Newman et al.3 via the porous electrode theory for battery simulations.3 According to this theory, transport is modeled via volume-averaged conservation equations for Li-ion batteries.4 The active particles are assumed as hard spheres into which Li ion intercalation occurs via isotropic linear diffusion.5,6 For phase-separating materials, such as LiFePO4, every particle is assumed to possess a spherical phase boundary, which moves as a shrinking core where one phase displaces the other.7–9 In these models, the local Nernst equilibrium potential is fitted to the global open-circuit voltage of the cell, and the non-uniform composition is neglected. Thus, a voltage plateau is observed for the porous electrode.10–13 For thermodynamic consistency, all these phenomena should be derived from common thermodynamic principles and cannot be independently fitted to the experimental data.
Recently, Smith, Garcia and Horn analyzed the effects of a microstructure on battery performance for various sizes and shapes of particles in a LixC6/LixCoO cell.14 The study used 3D image reconstruction of a real battery microstructure by focused ion beam milling, which has led to detailed studies of microstructural effects in porous electrodes.15–17 Additionally, it has also become possible to observe Li-ion transport at the scale of individual particles in porous Li-ion battery electrodes,18,19 which can be of much value in testing the dynamical predictions of new mathematical models.
The new theory has led to a quantitative understanding of intercalation dynamics in single nanoparticles of LiFePO4. Bai, Cogswell and Bazant12 generalized the Butler–Volmer equation using variational chemical potentials and used it to develop a mathematical theory of the suppression of phase separation in LiFePO4 nanoparticles with increasing current. This phenomenon helps to explain the remarkable performance of nano-LFP, as also suggested by Malik and Ceder based on bulk free-energy calculations,20 but the theory shows that it is entirely controlled by faradaic reactions at the particle surface.12,13 Cogswell and Bazant12 showed that including elastic coherency strain in the model leads to a quantitative theory of phase morphology and Li solubility. Experimental data for different particle sizes and temperatures can be fitted with only two parameters (the gradient penalty and regular solution parameter). The present study aims to develop a phenomenological thermodynamic approach incorporating electrolyte transport, electron transport, electrochemical kinetics, and phase separation to evaluate the free energy involved in the discharge process of Li-ion batteries. This leads to the application of thermodynamics for macroscopic phase transformations in porous electrodes for Li-ion batteries.
2. Methodology and phenomenological thermodynamic derivations
Processes involved in a Li-ion battery can be represented via the following thermochemical cycle: (Schemes 1 and 2).
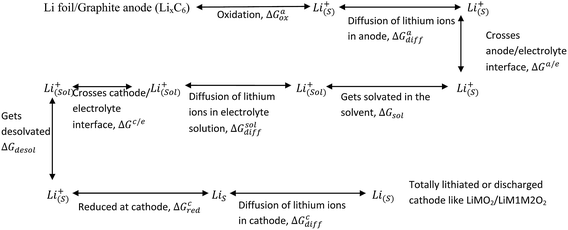 |
| | Scheme 1 Processes involved in the discharging of Li-ion cell (porosity and phase transformation are not taken into consideration). Assumptions: complete isotropicity and no porosity in the electrodes. | |
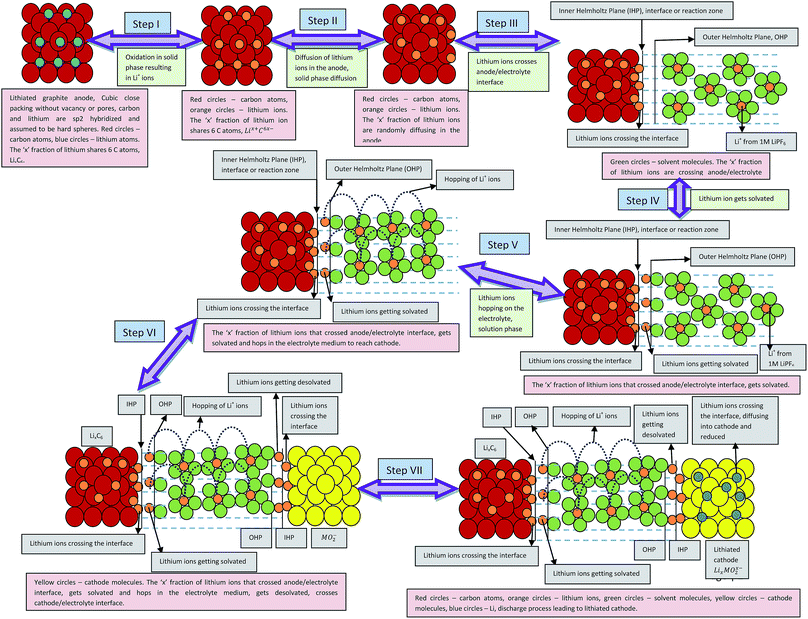 |
| | Scheme 2 Illustrative representation of the discharge process in lithium ion battery. Assumptions: electrodes are devoid of porosity. | |
In the case of LiMn2O4 or any cathode material undergoing phase transformation, the last step is complicated due to the formation of Li-rich and deficient phases. The phase transformation can be represented as follows:
| Li(S) ↔ LixMn2O4(1−x) (two phases formed) ↔ LiMn2O4 |
Further lithiation leads to complication for the entering Li ions. The ions have to find and occupy the vacant sites and hence, require additional energy to get further lithiated. They have to randomly travel at the cathode surface and occupy the vacant sites to completely discharge the battery. Thus, there exists a voltage plateau over a long time in these types of cathode materials. This can also be attributed to the low diffusivity of Li ions in Mn2O4 lattice.
| | |
ΔGadd = ΔGoccu − ΔGunoccu
| (1) |
Therefore, the energetics of the entire discharge process can be written as
| | |
ΔGprocess = ΔGaox + ΔGadiff + ΔGa/e + ΔGsol + ΔGsoldiff + ΔGc/e + ΔGdesol + ΔGred + ΔGcdiff
| (2) |
and for phase transformation cathodes,
| | |
ΔGprocess = ΔGaox + ΔGadiff + ΔGa/e + ΔGsol + ΔGsoldiff + ΔGc/e + ΔGdesol + ΔGred + ΔGcdiff + ΔGadd
| (3) |
(I) ΔGaox = free energy change involved in the oxidation of Li to Li+ at the anode (solid-phase oxidation) = −FEa, where Ea is the oxidation potential of the anodic reaction
| | |
LixC6 → xLi+ + 6C + xe
| (4) |
(II) ΔGadiff = free energy change involved in the diffusion of Li ions at the anode (solid-phase diffusion)
| | |
ΔGadiff = charge × potential
| (5) |
The charge, Q, based on Fick's second law of diffusion for short time approximation,  is21
is21
| |
 | (6) |
where
F = Faraday's constant;
A = effective surface area per unit mass of the electrode;
t = time elapsed from the beginning of the potential step;
Di = diffusion coefficient of Li
+ in the corresponding electrode;
Cini = initial concentration of Li ions before applying the potential and
Caft = final concentration of Li ions after applying the potential.
Hence, at  ,
,
| |
 | (7) |
where
Va = potential at that particular SoC;
R = maximum length of the diffusion path (particle radius; in the present case,
R is the ionic radius of Li
+ and
D is the anode thickness).
(III) ΔGa/e = free energy change involved in the escape of Li ions from the solid/solution interface (anode/electrolyte). The excess energy required for an ion or electron to escape to vacuum from the solution phase or vice versa is called its surface potential,22 χLi+/anode
(IV) ΔGsol = solvation energy of Li+ in EC/DEC (1![[thin space (1/6-em)]](https://www.rsc.org/images/entities/char_2009.gif) :
:![[thin space (1/6-em)]](https://www.rsc.org/images/entities/char_2009.gif) 1) binary solvent.
1) binary solvent.
The modified Born equation for estimating the solvation energy of ions in organic solvents is derived23 as
| |
 | (9) |
where
De = dielectric constant due to electron polarization of the atoms nearest to the central ion;
r1 = radius of the central ion (Li
+);
r2 = distance to the center of the nearest atom of the solvent (the solvent molecules are oriented with their polar atoms toward the central ion);
D = static dielectric constant of the solvent, and
q = charge = unity in the present case.
In the present scenario, where only a fraction “x” of Li+ gets solvated, ΔGsol can be written as
| |
 | (10) |
EC/DEC being a binary solvent, De and D are written as an average of the two solvents:
| |
 | (11) |
and
| |
 | (12) |
Herein, Li ions interact with the solvent molecules via the carbonyl oxygen atoms, and hence, r2 can be written in terms of partial Liδ+–Oδ− bond distance (half the covalent bond distance of Li–O bond). Therefore,
| |
 | (13) |
(V) ΔGsoldiff = free energy change involved in the diffusion of Li+ in an electrolytic solution. Since the hopping mechanism of Li+ in solution phase involves partial Liδ+–Oδ− bond formation between Li ions and carbonyl oxygen atom of the solvent molecules, ΔGsoldiff can be written as follows:
| |
 | (14) |
where
| |
 | (15) |
Analogously,
| |
 | (16) |
Therefore, eqn (14) becomes
| |
 | (17) |
where the solvation numbers SN
EC and SN
DEC of Li
+ in EC and DEC solvents can be empirically written as the volume ratio of the ion to the solvent molecule (the ions and solvents are considered to be hard spheres), and hence,
24,25| |
 | (18) |
and
| |
 | (19) |
where
rLi+3 and
rEC3,
rDEC3 denote the cubic radius of the Li ion and the solvents EC and DEC, respectively. Therefore,
eqn (16) becomes
22| |
 | (20) |
here Δ
GformLi–O represents the free energy of formation of Li–O bond.
(VI) ΔGc/e = free energy change involved in the process of crossing the electrolyte/cathode interface (solution/vacuum)24
| | |
ΔGc/e = −FχLi+/cathode
| (21) |
(VII) ΔGdesol = free energy change involved in the desolvation of the fraction “y” of the Li ions entering the cathode
| |
 | (22) |
(VIII) ΔGred = free energy change involved in the reduction of Li ions at the cathode (solid-phase reduction reaction)
where
Ec is the solid-phase cathodic reaction potential.
(IX) ΔGcdiff = free energy change during the diffusion of Li ions at the cathode (solid-phase diffusion). Analogous to the diffusion of Li ions at the anode, ΔGcdiff can be written as
| |
 | (24) |
where
Dc is the diffusion coefficient of Li ions at the cathode, and
Cinic and
Caftc are the initial and final concentrations of Li ions before and after applying the voltage, respectively.
(X) ΔGadd = excess energy required by the Li ions to find an unoccupied site at the cathode and z represents the total number of sites occupied by Li+
| | |
ΔGadd = ΔGoccu − ΔGunoccu
| (25) |
Occupied sites are LizMn2O4(1−z) and unoccupied sites are (1 − z)Mn2O4−. Therefore
| |
 | (26) |
and Δ
Gunoccu = ground state energy of Mn
2O
4− in its native state,

. Hence,
| |
 | (27) |
Thus, eqn (2) can be written as
| |
 | (28) |
for the phase transformation electrode,
| |
 | (29) |
Eqn (28) and (29) represent the free energy change involved in the entire discharge process of a Li-ion battery, where the electrodes are assumed to be isotropic and no porosity occurs. Eqn (29) takes into account the phase transformation at the cathode.
When the electrodes are porous in nature, the electrolyte seeps through the electrode and the solid/electrolyte interface (SEI) comes into existence on the electrode surface. This makes the entire process complicated. The discharge process can now be written as given in Scheme 3.
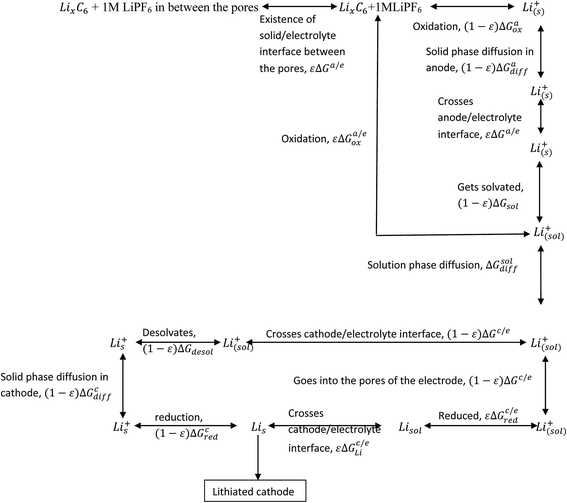 |
| | Scheme 3 Processes involved in the discharge of Li-ion battery (electrodes with porosity). | |
In the case of cathodes undergoing phase transformation, the following additional term is included:
| |
 | (30) |
where
e represents porosity. Thus, the free energy for the entire process can now be written as
| | |
ΔGprocess = 2εΔGa/e + εΔGa/eox + (1 − ε)ΔGaox + (1 − ε)ΔGadiff + (1 − ε)ΔGsol + ΔGsoldiff + 2(1 − ε)ΔGc/e + εΔGc/ered + εΔGc/eLi + (1 − ε)ΔGdesol + (1 − ε)ΔGCred + (1 − ε)ΔGCdiff
| (31) |
and for LiMn
2O
4-type cathodes,
| |
 | (32) |
By incorporating the expressions for all terms from the previous section, eqn (31) and (32) become
| |
 | (33) |
and for phase transformation cathodes,
| |
 | (34) |
Now, eqn (33) and (34) are the final form incorporating porosity in deriving the expression for the free energy involved in the discharge process of a Li-ion battery.
3. Results and discussion
Eqn (28), (29), (33), and (34) calculate the free energy involved in the discharge process of a Li-ion battery (i) without phase transition cathode and porosity, (ii) with phase transition cathode and no porosity, (iii) without porosity and with phase transition cathode, and (iv) with porosity and phase transition cathode, respectively. The individual contributing factors and free energies associated with the same are discussed in the following sections (Scheme 4).
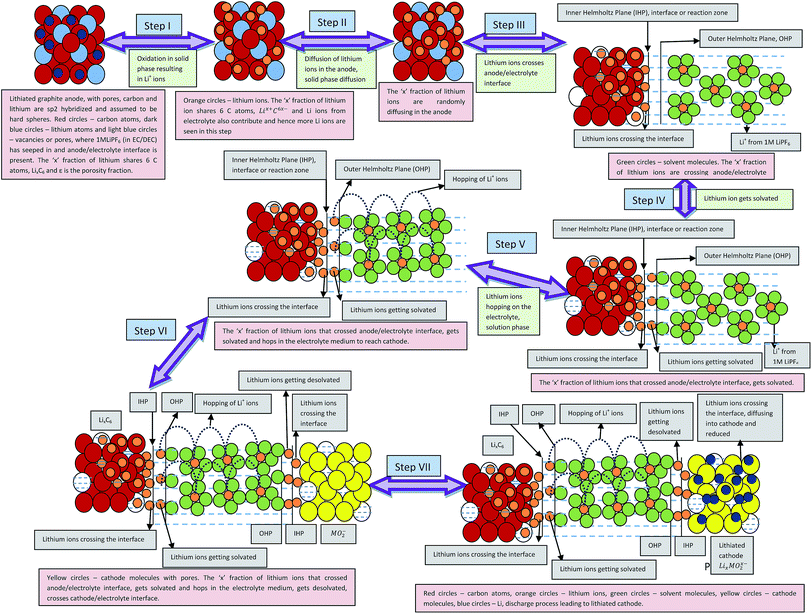 |
| | Scheme 4 Illustrative representation of the discharge process in lithium ion battery constituted by porous electrodes. | |
3.1 Free energy change involved in the process of Li-ion intercalation at the cathode and deintercalation at the anode
The first term in eqn (28) accounts for the free energy change involved in Li-ion deintercalation at the anode (graphite) and intercalation at the cathode (MnO2). The free energy change is represented as| | |
ΔGI = −F(Ea + Ec − χLi+/anode + χLi+/cathode)
| (35) |
Upon employing the values of all parameters in eqn (35), is obtained as −550.050 kJ mol−1.
Parameters employed. Ec = 4.1 eV (for LixMn2−xO4 (ref. 26)), Ea = 1.0 eV (for graphite21), χLi+/anode = −0.4 eV (for graphite22), χLi+/cathode = −0.2 eV (for LixMn2−xO4 (ref. 22)).
ΔGI. The value of −5.7 eV obtained for ΔGI can be attributed to the negative sum of the work function of the electrodes during Li-ion intercalation and deintercalation. It is well known27–29 that Li-ion intercalation at the cathode MnO2 occurs in two stages and Fermi level of the cathode material varies in these two stages due to Jahn–Teller distortion of the LiMn2O4 octahedral lattice accompanied by significant crystal structure rearrangement. Upon Li-ion insertion, initially, all Li ions occupy the 16c sites, resulting in the chemical formula of Li2Mn2O4. All Mn ions reduce to Mn3+ from Mn4+ during the lithiation process. This lattice structure corresponds to a work function of 4.1 eV. Upon further lithiation, the geometry of the cathode further distorts from octahedral geometry to tetrahedral geometry, accounting for a work function value of 2.8 eV. Therefore, the total work function of the system at any fraction of Li-ion intercalation is seen as the difference in the work function of both lattice structures, i.e., 1.3 eV. The work function of bulk polycrystalline graphite is reported to be 4.4 eV.30 The sum of the work functions of the cathode and anode is 5.7 eV. This clearly indicates that Li has to utilize 4.4 eV to deintercalate from the graphite anode and 4.4 eV to intercalate at the MnO2 cathode; hence, the total free energy required for the process is the sum of the energy utilized to achieve the process. As per definition, ΔG is negative of the work done in a process, and ΔGI becomes −5.7 eV, ca. −550.050 kJ mol−1. The entire process is illustratively represented in Scheme 5.
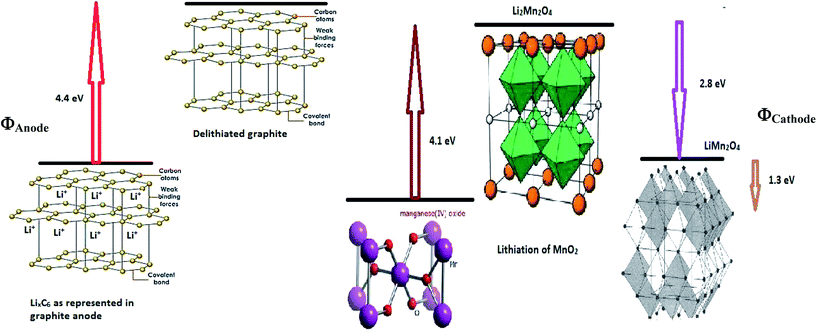 |
| | Scheme 5 Illustrative representation of the work function difference between anode and cathode during delithiation and lithiation, respectively. | |
3.2 Free energy change involved in the diffusion of Li ions at the anode and cathode: solid-phase diffusion
The second term in eqn (28) accounts for the free energy change involved in the Li-ion diffusion at the anode (graphite) and cathode (MnO2) and is represented as| |
 | (36) |
where ΔGII and ΔGIII represent the free energy change for the solid-phase diffusion of Li ions at graphite and MnO2 specifically. ΔGII and ΔGIII are written individually as| |
 | (37) |
| |
 | (38) |
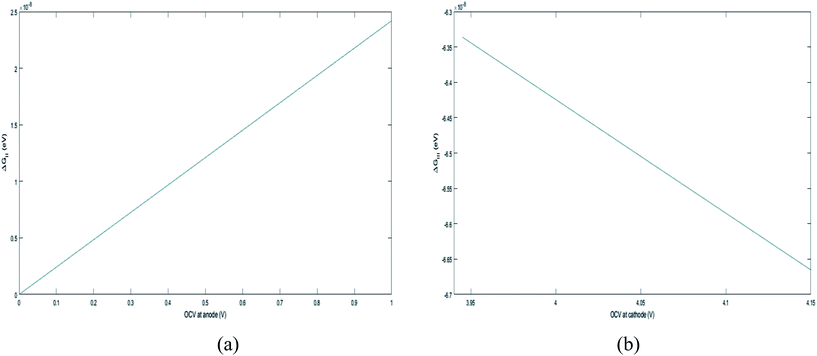
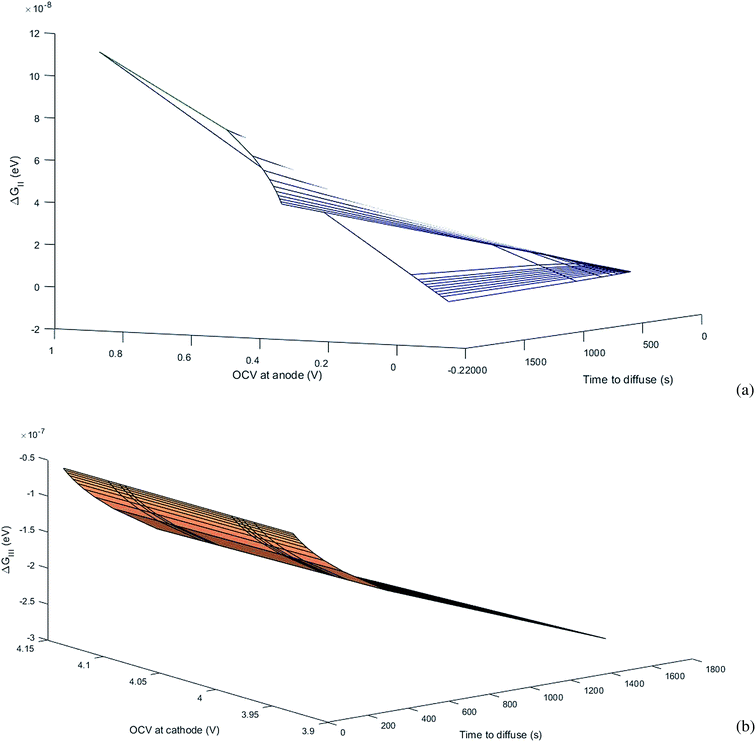
Parameters employed.  , where R is the Li-ion radius in Angstroms taken to be 0.9 Å,22 D is the thickness of the anode and considered to be 0.01 Å for the calculations. The value of diffusion coefficient for Li ions in graphite is employed as 2.27 × 10⁻¹³ cm2 s−1,21 that of cathode is 1 × 10⁻¹³ cm2 s−1,21 and that for the concentration gradients (Cinia–Cafta) and (Cinic–Caftc) before and after diffusion is assumed to be 0.1. For every State of Charge (SoC) of Li-ion intercalation at the cathode, the potential value (Vc) and deintercalation at the anode (Va) are taken from the literature.22
3.3 Free energy change involved in the diffusion of Li+ ions in electrolytic solution
The third term in eqn (28) depicts the free energy change involved in the diffusion of Li ions in the electrolyte medium.| |
 | (39) |
where x represents the fraction of Li desolvated, y is the fraction of Li ion solvated, De,EC and De,DEC depict the dielectric constants of EC and DEC due to electron polarization of the solvent molecules nearest to the central Li ion, respectively, and DEC and DDEC are static dielectric constants of the solvents EC and DEC respectively. Eqn (39) is analogous to the Born equation31 for solvation energetics of ions in solution.
Parameters employed. x varies from 1 to 0, and y varies from 0 to 1. De,EC = 2.72; De,DEC = 1.25; DEC = 89.78; DDEC = 2.82; rLi+ = 0.9; rLi–O = 1.26 Å; rEC = 0.85 Å; rDEC = 0.36 Å. All these values, except for those of x and y, are taken from the literature.21,32,33 The values of ΔGIV calculated from eqn (39) are plotted against x and y to study their dependency, as shown in Fig. 3.
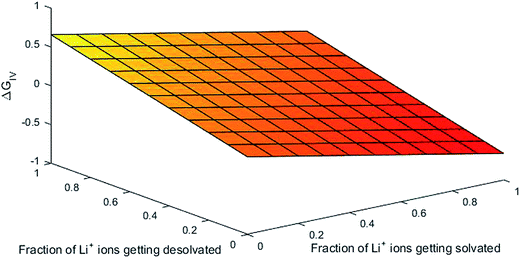 |
| | Fig. 3 Dependency of ΔGIV on the solvation characteristics of Li ion. | |
From Fig. 3, the dependency of hopping of Li ions in the binary solvent mixture EC/DEC via the free energy can be explained. The hopping of Li ions can be visualized as the interaction of Li ions in the ethylene carbonate/diethyl carbonate binary solvent mixture (1![[thin space (1/6-em)]](https://www.rsc.org/images/entities/char_2009.gif) :
:![[thin space (1/6-em)]](https://www.rsc.org/images/entities/char_2009.gif) 1). It is mainly due to coordination bond formation between Li+ and hetero-atomic oxygen/carbonyl oxygen (lone pair-electrons) atoms. The number of coordination bonds formed is identical to that of solvent molecules surrounding the Li ions (its solvation number). The energetics involved in this process is assumed to be 0.25 eV in the grand canonical Monte Carlo simulation of Li-ion batteries, as demonstrated elsewhere.21 From Fig. 3, we can obtain 0.25 eV at an identical fraction of Li ions getting solvated and desolvated (viz-a-viz the equilibrium in the formation and breaking of Li–O bond during hopping in the solvent). The same holds true for all x equal to y, indicating that the first principles-based thermodynamic predictions of free energy behave as the foundation for modeling of Li-ion batteries by simulation methods such as Monte Carlo. As the dependency of ΔGIV on the extent of solvation/desolvation of Li ions is the same, the 3D mesh plot of ΔGIV versus x, y appears to be simply linear.
1). It is mainly due to coordination bond formation between Li+ and hetero-atomic oxygen/carbonyl oxygen (lone pair-electrons) atoms. The number of coordination bonds formed is identical to that of solvent molecules surrounding the Li ions (its solvation number). The energetics involved in this process is assumed to be 0.25 eV in the grand canonical Monte Carlo simulation of Li-ion batteries, as demonstrated elsewhere.21 From Fig. 3, we can obtain 0.25 eV at an identical fraction of Li ions getting solvated and desolvated (viz-a-viz the equilibrium in the formation and breaking of Li–O bond during hopping in the solvent). The same holds true for all x equal to y, indicating that the first principles-based thermodynamic predictions of free energy behave as the foundation for modeling of Li-ion batteries by simulation methods such as Monte Carlo. As the dependency of ΔGIV on the extent of solvation/desolvation of Li ions is the same, the 3D mesh plot of ΔGIV versus x, y appears to be simply linear.
3.4 Free energy change involved in the viscous drag of Li ions in the solvent
ΔGV denotes the solvent interaction energy between the hopping Li ions in solvent EC/DEC according to the term| |
 | (40) |
and ΔGVI represents the solvent interaction energy of Li ions in solvent EC/DEC when moved to a new site, as denoted by the term| |
 | (41) |
where the free energy changes ΔGV and ΔGVI represent the viscous drag of the solvent on the Li ions while randomly moving in the solvent.
Parameters employed21,32,33. De,EC = 2.72; De,DEC = 1.25; DEC = 89.78; DDEC = 2.82; rLi+ = 0.9; rLi–O = 1.26; rEC = 0.85; rDEC = 0.36. The calculated values of ΔGV and ΔGVI are 0.5938 and 0.0067 eV, respectively. Sum of ΔGV and ΔGVI (0.6005 eV) accounts for the energetic for viscous drag of the solvent on Li ions. This value is in agreement with the Eviscousdrag calculated in the literature.21
3.5 Free energy change involved in the process of discharge of Li-ion battery (assumption: no phase change cathode, no porosity)
From eqn (28), the free energy change involved in the discharge process of a Li-ion battery with no phase transition cathode and highly isotropic electrode surface is calculated. The obtained value is plotted against the SoC of Li+ at the anode and cathode. As there occurs no complication due to phase transition or porosity, the 3D mesh plot appears linear. As SoCanode decreases, both, SoCcathode and ΔGprocess increase. Hence, as seen in Fig. 4,| |
 | (42) |
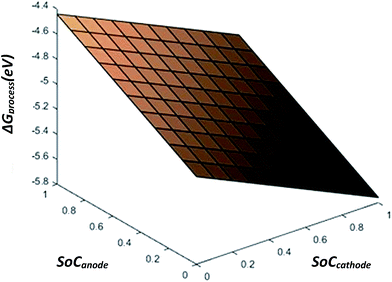 |
| | Fig. 4 ΔGprocess dependency of SoC on anode and cathode. | |
The value of ΔGprocess varies from −5.7579 eV to −4.4412 eV. The negative values indicate that the process of delithiation from graphite anode and lithiation into MnO2 cathode is highly spontaneous in the absence of any phase transition in the geometry of the cathode and the electrodes to be devoid of any defect and porosity.
3.6 Free energy involved in the phase transition process at the cathode from MnO2 to Li2Mn2O4 and LiMn2O4
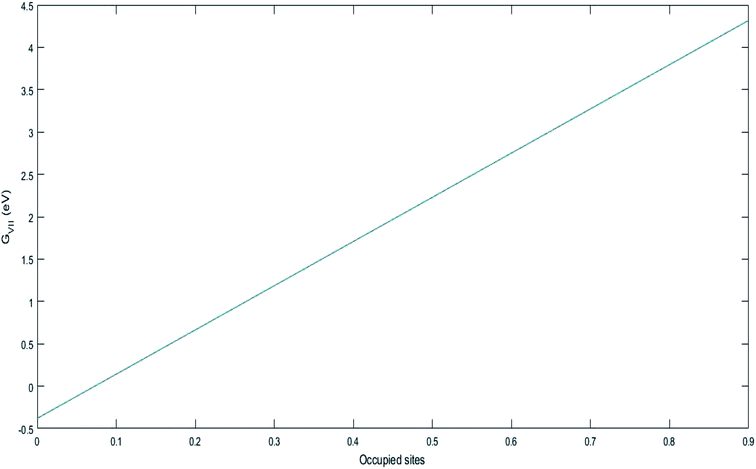
ΔGVII represents the phase transition process in MnO2 upon lithiation to Li-rich Li2Mn2O4 and Li-poor LiMn2O4. This is represented using eqn (29) as follows:| |
 | (43) |
where  and
and  represent the formation of lithiated phase and unlithiated phase at the cathode MnO2, respectively.
3.7 Free energy change involved in the discharge process of Li-ion battery (assuming no porosity and with phase transition cathode)
Eqn (29) represents the free energy change expression for the discharge process involving phase transition cathodes. The assumption made for simplicity is no porosity in the electrodes. Fig. 6 represents the variation in ΔGprocess with SoC at the anode and cathode.
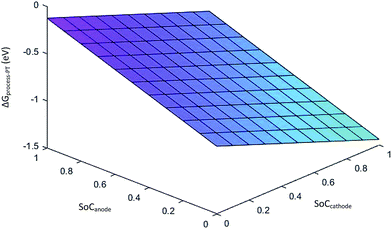 |
| | Fig. 6 Variation in ΔGprocess with SoCanode and SoCcathode. | |
The values of ΔGprocess with the phase transition component are very high in comparison with those of ΔGprocess without phase transition cathode. ΔGprocess from eqn (29) ranges from −1.5 eV to 0 with variations in the SoC of Li+ in graphite and MnO2. Thus, excess energy is needed to overcome the effect caused by the phase transformation from Li-rich Li2Mn2O4 and Li-poor LiMn2O4. As predicted for ΔGprocess (without phase transition) from eqn (28), the variation in ΔGprocess in the present case with SoC at the anode and cathode is linear. The trend of inverse proportionality prevails in the present scenario.
3.8 Variation in free energy change due to solid electrolyte interface (SEI)
The term  from eqn (33) and (34) accounts for the solid electrolyte interface at the anode and cathode.
Assumptions made. Since the cathode material employed here is LiMn2O4, the SEI at the cathode is neglected. Thus, the free energy change due to SEI reduces to| |
 | (45) |
Parameters employed. ε varies from 0 to 1. χc/eLi = 0.2 eV,  .
.The values of ΔGSEI vary from 0 to −1.2 eV. This clearly indicates that the presence of SEI at the graphite anode decreases ΔGprocess, thereby making the discharge process more feasible. As seen from eqn (45),
The free energy change involved in the formation of SEI is directly proportional to the porosity at the anode. Thus, at ε = 1, the value of ΔGSEI = −1.2 eV, as seen from Fig. 7.
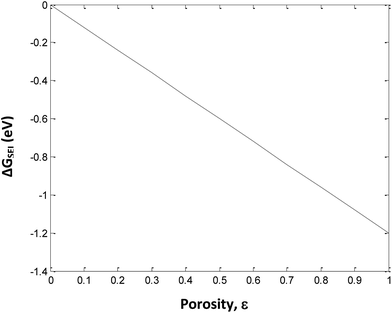 |
| | Fig. 7 Variation in ΔGSEI with porosity of anode. | |
The use of EC as a co-solvent with DEC plays a major role in the performance of a Li-ion battery by forming a protective layer on the graphite electrode. This protective layer, denoted as SEI, allows only Li ions to be transported to and from the graphite electrode. SEI prevents the risk of seeping of solvent molecules in the graphite electrode along with Li ions. Since, SEI is electrically insulating and sufficiently thick, it suppresses the decomposition of the electrolyte at the electrode surface. Hence, the actual deintercalation process takes place almost after 0.2 V.22 The formation energy of the insoluble Li carbonates and bicarbonates at SEI is calculated here at different porosity values.
3.9 Free energy change with constant porosity, SEI and SoC variation but no phase transition
Eqn (33) represents the free energy change involved in the discharge process of the Li-ion battery at ε = 0.3 of the anode. The ΔGSEI value at ε = 0.3 is 0.36 eV (Fig. 7). Eqn (33) leads to ΔGprocess values from −4.2870 eV to −3.3653 eV. The higher negative values of ΔGprocess indicate a more feasible discharging process when the porosity is maintained constant at 0.3. The variation in ΔGprocess with SoC of the anode is linear, indicating the direct proportionality of SoC with ΔGprocess (Fig. 8), similar to that presented in previous sections.
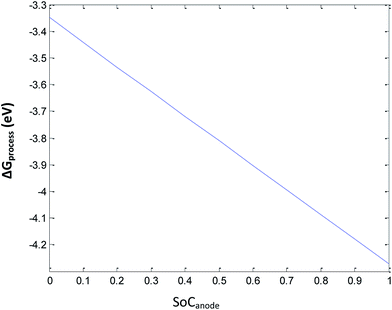 |
| | Fig. 8 Variation in ΔGprocess with SoC of Li at the anode at 0.3 porosity. | |
Fig. 8 shows that at very high SoC (unity), ΔGprocess becomes −4.287 eV. Hence, more Li ions tend to deintercalate. As SoC decreases, the spontaneity of the process decreases, and when all Li ions have deintercalated from graphite (SoC = 0), ΔGprocess increases by 0.9217 eV. As porosity is the reason behind SEI formation, for decrease in the SoC of Li+ at the anode with porosity = 0.3, the decrease in ΔGprocess is anticipated.
3.10 Free energy change involved in the discharge process for cathode with phase transition and 0.3 porosity and anode with 0.3 porosity
Eqn (34) includes the terms of porosity, phase transition, and SEI for the free energy change involved in the discharge process of a Li-ion battery. Herein, the porosity is kept constant at 0.3. By introducing complications due to phase transition, porosity, and SEI, ΔGprocess increases tremendously, making the process less and less spontaneous. The ΔGprocess value is calculated to be from −0.3 to −1.3 eV for an SoC from 0 to 1 for Li ions (Fig. 9).
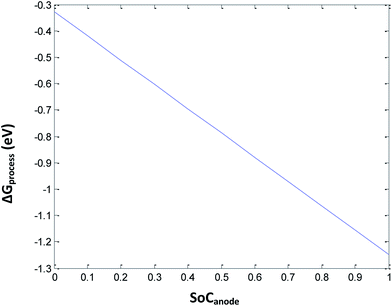 |
| | Fig. 9 Variation in ΔGprocess with the SoC of Li at the anode at porosity = 0.3. | |
3.11 Free energy change involved in the discharge process of Li-ion battery with porosity varying from 0 to 1 and no phase transition at cathode
To understand the effect of porosity, SEI and phase transition independently, eqn (33) is used to calculate ΔGprocess at different SoCs and porosities. The porosity value varies from 0 to 1 and the SoC of the cathode and anode varies from 0 to 1. The phase transition at the cathode is neglected to minimize the variable parameters. The plot of ΔGprocess with porosity (Fig. 10 and 11) indicates that as the porosity at the anode increases, ΔGprocess increases linearly, thereby making the process less spontaneous. This is contrary to what is understood about porosity and ΔGprocess as discussed in literature of Li-ion batteries. This anomaly can be attributed to the assumption of phase transition energetics in ΔGprocess calculation. ΔGprocess varies from −1 eV to −6 eV for ε ranging from 0 to 1. This is the highest range for ΔGprocess obtained so far in the present calculations, indicating that Jahn–Teller distortion and the disproportionation reactions associated with it form a critical factor in reducing ΔGprocess and making the discharge process spontaneous.
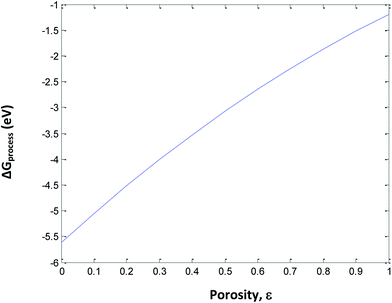 |
| | Fig. 10 Variation in ΔGprocess with porosity of anode. | |
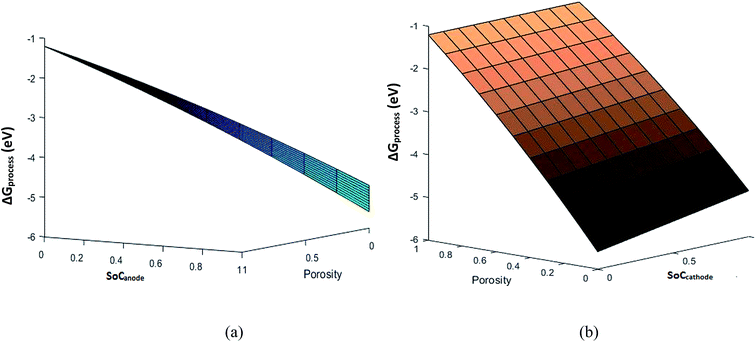 |
| | Fig. 11 Free energy variation with porosity and (a) SoCanode and (b) SoCcathode. | |
3.12 Free energy change involved in the discharge process of Li-ion battery with porosity varying from 0 to 1 and incorporating phase transition at cathode
The following assumptions are made in eqn (34): (i) incorporation of Jahn–Teller distortion and phase transition effects, (ii) SEI effects, (iii) porosity effects, and (iv) SoC effects on ΔGprocess. Fig. 12 implies that upon varying all parameters, the maximum tolerable porosity with minimum ΔGprocess can be obtained. The threshold porosity value for LiMnO2- and graphite-based batteries is predicted to be 0.4–0.5. This is in satisfactory agreement with the experimental data reported in the literature. The ΔGprocess value decreases initially with an increase in porosity from −1.2 eV to −2 eV. After reaching a porosity of 0.5, ΔGprocess increases from −2 to −0.8 eV. Thus, the porosity behavior is directly proportional to ΔGprocess till 0.5 and inversely proportional to ΔGprocess after 0.5. This behavior also reflects the Jahn–Teller distortion-induced phase transition in MnO2 upon lithiation. It is very well demonstrated in the literature21,22 that till 0.5 SoC, Li+ ions occupy NN sites, and beyond 0.5, they occupy NNN sites. Thus, Fig. 12 predicts the phase transition of the cathode as well.
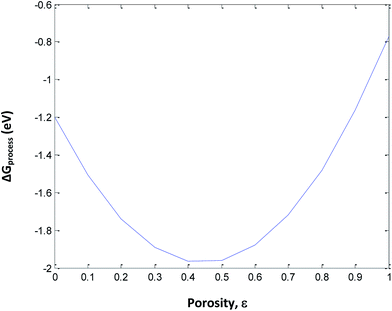 |
| | Fig. 12 Variation in ΔGprocess with porosity of the anode including phase transition of the cathode. | |
The porosity threshold of the system (ca. 0.4 to 0.5), Jahn–Teller distortion at the cathode due to the insertion of Li ions (viz-a-viz. ΔGprocess variation with the SoC of graphite and LiMn2O4 before and after 0.5 value; Fig. 13c), and site occupancy of Li ions in the MnO2 lattice upon lithiation (Fig. 13b, e and f) show an exponential increase in ΔGprocess after 0.5 SoC and z, as predicted via eqn (34). Thus, eqn (34) is a comprehensive thermodynamic equation for the discharge process of a Li-ion battery. Although this equation takes bulk parameters as input values, the variation in ΔGprocess with all parameters such as SoC (both cathode and anode), occupancy of Li+ ions in cathode (z), phase transition in the cathode material due to lithiation, maximum threshold porosity acceptable in the anode, SEI, and its significance are demonstrated clearly for LiMn2O4- and graphite electrode-based Li-ion batteries.
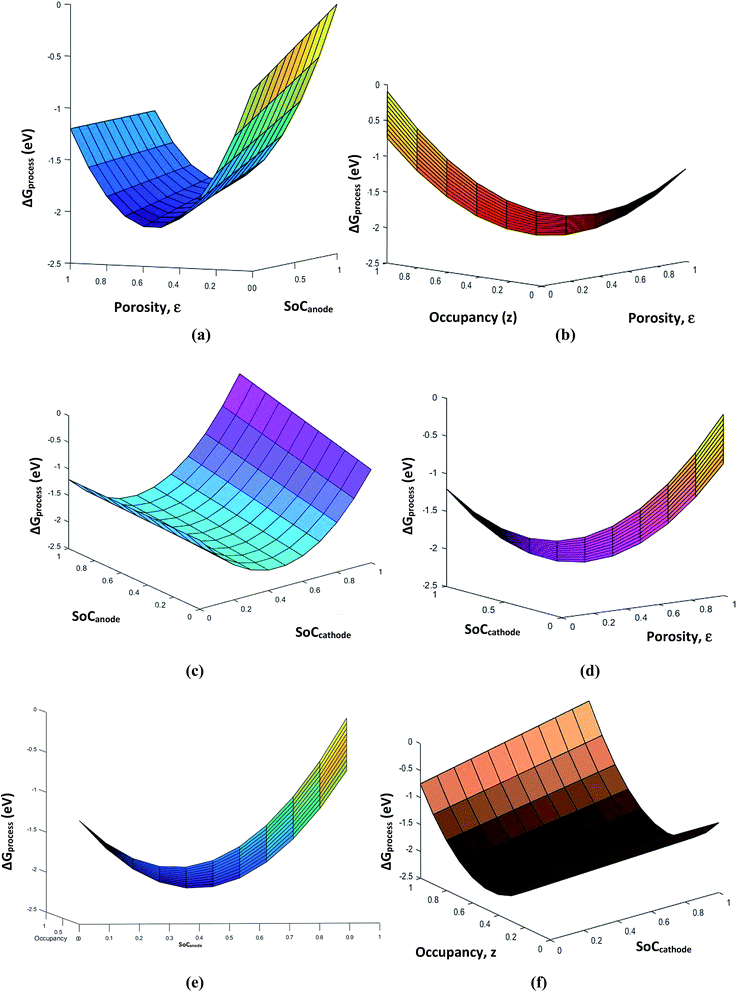 |
| | Fig. 13 Variation in free energy change of the process (a) with porosity and SoCanode, (b) with porosity and occupancy, (c) with SoCanode and SoCcathode, (d) with porosity and SoCcathode, (e) with SoCanode and occupancy, z, and (f) with SoCcathode and occupancy, z. | |
4. Perspectives and summary
A series of thermodynamic parameters of Li-ion batteries during the charge–discharge process, such as enthalpy change, entropy change, and Gibbs free energy change, were achieved through the study of thermo-electrochemistry. These experimental results provided basic data for the battery thermal management and a new technique for a comprehensive evaluation of the thermal and electric performance of battery materials.36 Thus, a phenomenological thermodynamic approach to calculate ΔGprocess involved in the discharge process of a Li-ion battery was developed. The free energy change involved in Li-ion deintercalation at the anode (graphite) and intercalation at the cathode (MnO2) was estimated as −5.7 eV from eqn (28), which is the negative sum of the work function of the cathode and anode. The free energy change involved in the Li-ion diffusion at the anode (graphite) and cathode (MnO2) is negligible in the order of 10−6 to 10−7. The rationale behind these small values is the small variation in the t, V and ΔC values with SoC of Li ions in respective electrodes. At higher “t” values, the free energy involved in the diffusion process is very less and indirectly proportional to the electrode thickness. Higher “t” and lower “D” lead to more feasible diffusion of the Li ions. These results are analogous to the potentiostatic or galvanostatic intermittent techniques demonstrated in the literature, to determine the diffusion coefficient of Li ions.22 Energetics for viscous drag of the solvent on the Li ions obtained as 0.6005 eV is in agreement with the Eviscousdrag calculated in the literature,21 employing grand canonical Monte Carlo simulations. The energy involved in the effect of Jahn–Teller distortion on the cathode material is accurately predicted as −0.84 eV. The maximum threshold for porosity is 0.4 to 0.5 for the anode. The phase transition is predicted to occur at 0.5 SoC of Li ions at the cathode. Thus, the free energy involved in the discharge process of Li-ion batteries with LiMn2O4 cathode material is calculated by employing the energetic of individual processes such as intercalation/deintercalation, diffusion of Li ions in solid and liquid phases, Jahn–Teller distortion of cathode material, the maximum threshold porosity, and SoC for phase transition via phenomenological thermodynamic analysis of the system. As a future perspective, eqn (28)–(34) can be extended to evaluate the discharge processes of Li-ion batteries involving any combination of anode and cathode materials with or without phase transition, as done via the first principles calculations in the literature.37 Measurement of the heat effect by electrochemical calorimetry plays an important role in Li-ion cell safety.38 As eqn (28)–(34) derived in the present study are temperature dependent, the thermodynamic approach presented herein for LiMn2O4 can be extended to understand the temperature effect on the parameters, and hence, the thermal safety of a wide variety of cathode and anode materials.
References
- V. Ramadesigan, P. W. C. Northrop, S. De, S. Santhanagopalan, R. D. Braatz and V. R. Subramanian, J. Electrochem. Soc., 2012, 159, R31 CrossRef CAS.
- G. Ceder, Y.-M. Chiang, D. R. Sadoway, M. K. Aydinol, Y.-I. Jang and B. Huang, Nature, 1998, 392, 694 CrossRef CAS.
- J. Newman and K. E. Thomas-Alyea, Electrochemical Systems, PrenticeHall, Inc., Englewood Cliffs, NJ, 3rd edn, 2004 Search PubMed.
- P. DeVidts and R. E. White, J. Electrochem. Soc., 1997, 144, 4 Search PubMed.
- M. Doyle, T. F. Fuller and J. Newman, J. Electrochem. Soc., 1993, 140, 1526 CrossRef CAS.
- M. Doyle, A. S. Gozdz, C. N. Schmuts, J. Marie Tarascon and J. Newman, J. Electrochem. Soc., 1996, 143, 44 CrossRef.
- V. Srinivasan and J. Newman, J. Electrochem. Soc., 2004, 151, A1517 CrossRef CAS.
- S. Dargaville and T. W. Farrell, J. Electrochem. Soc., 2010, 157, A830 CrossRef CAS.
- V. Indrajeet, T. Joshi, K. Zaghib, J. N. Harb and D. R. Wheeler, J. Electrochem. Soc., 2011, 158, A1185 CrossRef.
- W. Dreyer, J. Jamnik, C. Guhlke, R. Huth, J. Moskon and M. Gaberscek, Nat. Mater., 2010, 9, 448 CrossRef CAS PubMed.
- D. Dreyer, C. Guhlke and R. Huth, Phys. D, 2011, 240, 1008 CrossRef.
- P. Bai, D. Cogswell and M. Z. Bazant, Nano Lett., 2011, 11, 4890 CrossRef CAS PubMed.
- D. A. Cogswell and M. Z. Bazant, ACS Nano, 2012, 6, 2215 CrossRef CAS PubMed.
- M. Smith, R. Edwin Garcia and Q. C. Horn, J. Electrochem. Soc., 2009, 156, A896 CrossRef CAS.
- V. T. Indrajeet, D. E. Stephenson, N. A. Zacharias, K. Zaghib, J. N. Harb and D. R. Wheeler, J. Power Sources, 2009, 188, 592 CrossRef.
- R. Theidmann, O. Stenzel, A. Spettl, P. R. Shearing, S. J. Harris, N. P. Brandon and V. Schmidt, Comput. Mater. Sci., 2011, 50, 3365 CrossRef.
- D. Kehrwald, P. R. Shearing, N. P. Brandon, P. K. Sinha and S. J. Harris, J. Electrochem. Soc., 2011, 158, A1393 CrossRef CAS.
- N. Balke, S. Jesse, A. N. Morozovska, E. Eliseev, D. W. Chung, Y. Kim, L. Adamczyk, R. E. Garca, N. Dudney and S. V. Kalinin, Nat. Nanotechnol., 2010, 5, 749 CrossRef CAS PubMed.
- K. Weichert, W. Sigle, P. A. van Aken, J. Jamnik, C. Zhu, R. Amin, T. Acarturk, U. Starke and J. Maier, J. Am. Chem. Soc., 2012, 134, 2988 CrossRef CAS PubMed.
- R. Malik, F. Zhou and G. Ceder, Nat. Mater., 2011, 10, 587 CrossRef CAS PubMed.
- P. Yu, B. N. Popov, J. A. Ritter and R. E. White, J. Electrochem. Soc., 1999, 146, 8 CrossRef CAS.
- P. Kar and S. Harinipriya, J. Electrochem. Soc., 2014, 161, A726 CrossRef CAS.
- J. O. '. M. Bockris and B. E. Conway, Modern Aspects of Electrochemistry, Academic Press, New York, 1954,
ch. 1, vol. 1 Search PubMed.
- S. Harinipriya, V. Sudha and M. V. Sangaranarayanan, Langmuir, 2004, 20, 1871 CrossRef CAS.
- I. F. Fritsch and R. L. A. Faulkner, J. Electroanal. Chem., 1989, 263, 237 CrossRef.
- R. Darling and J. Newman, J. Electrochem. Soc., 1999, 146, 3765 CrossRef CAS.
- A. Yamada, J. Solid State Chem., 1996, 122, 160 CrossRef CAS.
- A. Yamada, K. Miura, K. Hinokuma and M. Tanaka, J. Electrochem. Soc., 1995, 142, 2149 CrossRef CAS.
- R. J. Gummow, A. de Kock and M. M. Thackeray, Solid State Ionics, 1994, 69, 59 CrossRef CAS.
- N. Ooi, A. Rairkar and J. B. Adams, Carbon, 2006, 44, 231 CrossRef CAS.
- M. Born, Z. Phys., 1920, 1, 45 CrossRef CAS.
- Y. Wang, S. Nakamura, M. Ue and P. B. Balbuena, J. Am. Chem. Soc., 2001, 123, 11708 CrossRef CAS PubMed.
- E. Niki, Y. Kamiya and N. Ohta, Bull. Chem. Soc. Jpn., 1969, 42, 3578 CrossRef CAS.
- K. Haong, Adv. Condens. Matter Sci., 2014, 1 Search PubMed.
- J. Reed, G. Ceder and A. Van Der Ven, ECS Solid State Lett., 2001, 4, A78 CrossRef CAS.
- L. Song, Z. Xiao and Y. Zhou, Electrochim. Acta, 2013, 114, 611 CrossRef CAS.
- L. Song, Z. Tang, Y. Chen, Z. Xiao, L. Li, H. Zheng, B. Li and Z. Liu, Ceram. Int., 2016, 42, 8537 CrossRef CAS.
- L. Song, X. Li, Z. Wang, H. Guo, Z. Xiao, F. Zhang and S. Peng, Electrochim. Acta, 2013, 90, 461 CrossRef CAS.
|
| This journal is © The Royal Society of Chemistry 2017 |
Click here to see how this site uses Cookies. View our privacy policy here.  Open Access Article
 *b
*b

 is21
is21

![[thin space (1/6-em)]](https://www.rsc.org/images/entities/char_2009.gif) :
:![[thin space (1/6-em)]](https://www.rsc.org/images/entities/char_2009.gif) 1) binary solvent.
1) binary solvent.


 . Hence,


 , where R is the Li-ion radius in Angstroms taken to be 0.9 Å,22 D is the thickness of the anode and considered to be 0.01 Å for the calculations. The value of diffusion coefficient for Li ions in graphite is employed as 2.27 × 10⁻¹³ cm2 s−1,21 that of cathode is 1 × 10⁻¹³ cm2 s−1,21 and that for the concentration gradients (Cinia–Cafta) and (Cinic–Caftc) before and after diffusion is assumed to be 0.1. For every State of Charge (SoC) of Li-ion intercalation at the cathode, the potential value (Vc) and deintercalation at the anode (Va) are taken from the literature.22
 .
. , the profile of the free energy changes involved in the solid-phase diffusion of Li ions at the anode and cathode (ΔGII and ΔGIII) varies as shown in Fig. 2.
 .
.
![[thin space (1/6-em)]](https://www.rsc.org/images/entities/char_2009.gif) :
:![[thin space (1/6-em)]](https://www.rsc.org/images/entities/char_2009.gif) 1). It is mainly due to coordination bond formation between Li+ and hetero-atomic oxygen/carbonyl oxygen (lone pair-electrons) atoms. The number of coordination bonds formed is identical to that of solvent molecules surrounding the Li ions (its solvation number). The energetics involved in this process is assumed to be 0.25 eV in the grand canonical Monte Carlo simulation of Li-ion batteries, as demonstrated elsewhere.21 From Fig. 3, we can obtain 0.25 eV at an identical fraction of Li ions getting solvated and desolvated (viz-a-viz the equilibrium in the formation and breaking of Li–O bond during hopping in the solvent). The same holds true for all x equal to y, indicating that the first principles-based thermodynamic predictions of free energy behave as the foundation for modeling of Li-ion batteries by simulation methods such as Monte Carlo. As the dependency of ΔGIV on the extent of solvation/desolvation of Li ions is the same, the 3D mesh plot of ΔGIV versus x, y appears to be simply linear.
1). It is mainly due to coordination bond formation between Li+ and hetero-atomic oxygen/carbonyl oxygen (lone pair-electrons) atoms. The number of coordination bonds formed is identical to that of solvent molecules surrounding the Li ions (its solvation number). The energetics involved in this process is assumed to be 0.25 eV in the grand canonical Monte Carlo simulation of Li-ion batteries, as demonstrated elsewhere.21 From Fig. 3, we can obtain 0.25 eV at an identical fraction of Li ions getting solvated and desolvated (viz-a-viz the equilibrium in the formation and breaking of Li–O bond during hopping in the solvent). The same holds true for all x equal to y, indicating that the first principles-based thermodynamic predictions of free energy behave as the foundation for modeling of Li-ion batteries by simulation methods such as Monte Carlo. As the dependency of ΔGIV on the extent of solvation/desolvation of Li ions is the same, the 3D mesh plot of ΔGIV versus x, y appears to be simply linear.


 and
and  represent the formation of lithiated phase and unlithiated phase at the cathode MnO2, respectively.
 = 4.84 eV and
  = 0.38 eV.34
 from eqn (33) and (34) accounts for the solid electrolyte interface at the anode and cathode.

 .
.


