 Open Access Article
Fabrication and evaluation of a highly durable and reliable chloride monitoring sensor for civil infrastructure
Subbiah Karthickab,
Seung-Jun Kwonc,
Han Seung Lee*a,
Srinivasan Muralidharand,
Velu Saraswathy *ac and
Rethinam Natarajanb
aDepartment of Architectural Engineering, Hanyang University, 1271 Sa 3-dong, Sangrok-gu, Ansan 426791, Korea. E-mail: ercleehs@hanyang.ac.kr; vsaracorr@cecri.res.in; Fax: +82-31-436-8169; Tel: +82-31-400-4181
bPG and Research Department of Chemistry, Alagappa Government Arts College, Karaikudi 630003, Tamilnadu, India
cDepartment of Civil Engineering, Hannam University, Daejeon 306-791, Korea
dCorrosion and Materials Protection Division, CSIR-Central Electrochemical Research Institute, Karaikudi 630003, Tamilnadu, India
First published on 19th June 2017
Abstract
A solid-state alkaline stable polymer coated Ag/AgCl sensor was fabricated for chloride sensing in concrete structures. The Ag/AgCl sensor was fabricated by sintering the AgCl powder with Ag wire. Polypyrrole (PPy) was prepared by simple chemical synthesis. The unwavering character of the prepared PPy coated Ag/AgCl sensor in saturated KCl solution was exemplified by potentiodynamic polarization studies followed by half-cell potential (HCP). The alkaline stability of the Ag/AgCl and PPy coated Ag/AgCl sensor in synthetic concrete pore solution (SCPS) was characterized by HCP, X-ray diffraction (XRD) and scanning electron microscopic (SEM) studies. The PPy coated chloride sensor was calibrated in saturated KCl, distilled water and SCPS with various concentrations of chloride ions. The results showed a good relationship between the sensitivity of the sensor regarding the potential to the logarithm of chloride activity. Further, it was noticed that the potential value remained stable with increasing immersion time.
1. Introduction
Reinforced concrete structures play a significant role in the construction industry, such as in buildings, bridges, and nuclear reactors, and they involve major construction cost in the millions of dollars. When the structures are exposed to aggressive environments, the durability of the concrete is affected either due to the carbonation of the concrete cover or ingress of chloride ions.1–6 Chloride-induced corrosion is a particularly insidious problem7,8 since it leads to localized attack, which results in cracking and delamination of the concrete cover and unexpected failure of the structure, which is often catastrophic. Therefore, chloride ion monitoring is one of the most important methods to prevent the corrosion-induced damage of concrete structures in marine environments. Chloride monitoring in concrete structure involves drilling the concrete at various depths for the collection of powder samples from the steel-concrete interfacial region and analyzing the free chloride and total chloride content by potentiometric titration method using an Ag/AgCl ion selective electrode.9–12 This technique seems to be a destructive, time-consuming process and requires periodic repetition and interpretation to obtain accurate data. Furthermore, destructive methods bring additional indirect cost due to road closures and traffic delays.13,14 Hence, the civil and construction industries are searching for non-destructive techniques for chloride monitoring in concrete structures. The entire problem will be overcome by using embeddable sensors for continuous monitoring of chloride ion content, which is a simplified procedure and easily adaptable method.15 In this regard, the Ag/AgCl electrode is considered as one of the most commonly used sensors because it has a Nernstian response to the variations of chloride (Cl−) or silver (Ag+) activity and displays excellent sensitivity.16 Ag/AgCl electrodes have become well established over the last decade and have been employed for analytical applications.17 Gurusami et al. reported the use of Ag/AgCl sensors embedded in concrete as reference electrodes and good long-term results were collected over a period of about 4.5 years.16 The first attempt in concrete was made in the 1990s. Potentiometric measurement using an Ag/AgCl electrode is the standard electrochemical technique to measure the free chloride in concrete.18–22 A study carried out using Ag/AgCl for chloride monitoring in simulated concrete pore solutions revealed that at higher chloride concentration, pH has a significant influence on the potential value of the sensor.23 An Ag/AgCl wire was employed as a sensor for determination of water soluble chlorides in admixtures and aggregates for cement.24 It was reported that, according to the Nernst law, the equilibrium potential value of the Ag/AgCl electrode depends on the chloride ion activity (concentration) of the surrounding solution, and an Ag/AgCl electrode can be used to determine the chloride activity in simulated cement pore solution, mortar and concrete samples.25,26However, studies revealed that embeddable Ag/AgCl electrodes in concrete are not stable for a long time, which is owing to the high alkalinity of the concrete. It was reported that in the pH range from 11.9 to 13.7, low concentrations of chloride cannot be accurately determined by potentiometric measurements owing to the OH− interference.22,27 Besides, in the high alkaline solution and the presence of hydroxyl ions, silver activity near the surface is determined by exchange equilibrium, as shown in eqn (1):28
| 2AgCl + 2OH− → Ag2O + 2Cl− + H2O | (1) |
The AgCl membrane becomes unstable and is turned into Ag2O partly or wholly at high pH values. By the continuous transformation of the electrode surface into Ag2O, a mixed potential is developed at the electrode/solution interface and it becomes incapable of accurately determining the free chloride content in the concrete structure.22 Therefore, to increase the stability of the Ag/AgCl electrode and to reduce the OH− ion interference in the alkaline environment, the use of a conducting, alkaline stable conjugated polymer coating on an Ag/AgCl electrode was reported.28,29
In this aspect, a polypyrrole polymer matrix was used because it is one of the most frequently used polymers, can be readily synthesized, and it is more stable, lower cost, and has higher conductivity when compared to other polymers; it has been employed for many applications.30,31 Pickup et al.32 constructed a polypyrrole–mercury/mercury chloride coated glassy carbon electrode as a reference electrode. Mangold et al.33 investigated a polypyrrole–silver/silver chloride as a reference electrode based on the surrounding electrolyte. The open circuit potential of this electrode strongly depends on the concentration of the supporting electrolyte. Furthermore, polypyrrole coated on a carbon electrode and polypyrrole incorporated on a metal electrode (Pt, In–SnO2 and glassy carbon) was tried as a pH sensor, glucose sensor, and biosensor. PPy and PPy-based coatings have been proved to be very effective inhibitors in the corrosion of oxidizable metals and alloys, stainless steels, mild steel, etc. Besides these, PPy films are being used in other areas, such as in sensors and bio-fuel cells.34
To date, no in-depth studies have been carried out using an Ag/AgCl electrode for in situ chloride sensing application in concrete structures. Hence, the present study aimed at developing a low cost, accurate and highly alkaline, long-term stable PPy coated Ag/AgCl solid electrode as an embeddable sensor for chloride sensing in concrete structures. The electrochemical stability of this PPy coated Ag/AgCl electrode was evaluated in simulated concrete pore solutions with different chloride ion concentrations. The chloride sensitivity of the PPy coated solid electrode was assessed against an MnO2 solid sensor in chloride contaminated concrete by embedding the sensor at different depths.
2. Materials and methods
2.1. Materials and methods
The chemicals such as a silver wire (Ag), silver chloride (AgCl) powder, pyrrole, sodium dodecyl sulfate, iron(III) chloride hexahydrate, NaOH, KOH, CaO and NaCl used were of analytical reagent grade with sufficient purity and were purchased from reputed chemical suppliers.![[thin space (1/6-em)]](https://www.rsc.org/images/entities/char_2009.gif) :
:![[thin space (1/6-em)]](https://www.rsc.org/images/entities/char_2009.gif) 1 ratio were mixed and pressed into a pellet shape of 2 mm thick using a hydraulic pressing machine (10 MPa), then sintered at a temperature of 400 ± 10 °C in a suitable ceramic sintering boat in N2 atmosphere. A suitable silver wire was used as an electrical lead and was embedded before the sintering operation to make the Ag/AgCl pellet shape. The final size of the Ag/AgCl electrode was around 10 × 20 mm in a rectangle shape and it was found to be electronically conductive.
1 ratio were mixed and pressed into a pellet shape of 2 mm thick using a hydraulic pressing machine (10 MPa), then sintered at a temperature of 400 ± 10 °C in a suitable ceramic sintering boat in N2 atmosphere. A suitable silver wire was used as an electrical lead and was embedded before the sintering operation to make the Ag/AgCl pellet shape. The final size of the Ag/AgCl electrode was around 10 × 20 mm in a rectangle shape and it was found to be electronically conductive.2.2. Testing in saturated KCl
2.3. Testing in various chloride concentrations
The Fb-Ag/AgCl and PPy–Ag/AgCl electrodes were calibrated in aqueous NaCl solutions with different concentration of chloride ions from 0.001 mole per L to 1.0 mole per L. The potentials developed by both electrodes were measured with respect to SCE. The pH of the test solution was observed as neutral. Further, the response of the Fb-Ag/AgCl and PPy–Ag/AgCl electrodes under alkaline environment was calibrated in synthetic concrete pore solution (SCPS) contaminated with chloride ions ranging from 0.001 mole per L to 1.0 mole per L.2.4. Stability of Fb-Ag/AgCl and PPy–Ag/AgCl electrodes in SCPS
The changes in the physical appearance of the Fb-Ag/AgCl and PPy–Ag/AgCl electrodes were monitored every day.
![[thin space (1/6-em)]](https://www.rsc.org/images/entities/char_2009.gif) 418 Å) in the range of 40 kV, 20 A was used for the recording of XRD patterns.
418 Å) in the range of 40 kV, 20 A was used for the recording of XRD patterns.Scanning electron microscopy (SEM) images were obtained using a Hitachi Model S-3000H at various magnifications to study the surface morphology of the Fb-Ag/AgCl and PPy–Ag/AgCl electrodes before and after immersion in SCPS for the period of 60 days.
2.5. Potential measurement in various solutions
The PPy–Ag/AgCl electrode was dipped in different solutions such as distilled water and SCPS with various chloride concentrations (0.25 mole per L, 0.50 mole per L and 1.0 mole per L). The potential developed by this electrode was measured with respect to SCE. The pH of the test solutions was varied from 11 to 13.5. The potential values noted at different time durations were plotted as a graph. The reversibility behavior of PPy–Ag/AgCl electrode in low and high concentrations of chloride ion was also measured.2.6. Electrochemical studies
The procedure mentioned in the Experimental section 2.2.2 was followed for carrying electrochemical studies, and here the working electrode taken was the PPy–Ag/AgCl electrode and the electrolyte used was SCPS and SCPS with chloride ion concentrations of 0.25 mole per L, 0.50 mole per L and 1.0 mole per L.The same three electrode setup was used for AC-impedance measurement. The AC-impedance measurement for the PPy–Ag/AgCl electrode was carried out using an ACM Instruments (UK) field machine with a frequency range of 30 kHz to 10 mHz and an amplitude of 20 mV. Nyquist plots were recorded for all the systems studied and are presented in graph form.
2.7. Evaluation of the PPy–Ag/AgCl electrode embedded in concrete for chloride ion sensitivity
A concrete cube with dimensions of 150 mm × 150 mm × 150 mm was cast using a 1![[thin space (1/6-em)]](https://www.rsc.org/images/entities/char_2009.gif) :
:![[thin space (1/6-em)]](https://www.rsc.org/images/entities/char_2009.gif) 1.80
1.80![[thin space (1/6-em)]](https://www.rsc.org/images/entities/char_2009.gif) :
:![[thin space (1/6-em)]](https://www.rsc.org/images/entities/char_2009.gif) 3.696 mix ratio of cement
3.696 mix ratio of cement![[thin space (1/6-em)]](https://www.rsc.org/images/entities/char_2009.gif) :
:![[thin space (1/6-em)]](https://www.rsc.org/images/entities/char_2009.gif) fine aggregate
fine aggregate![[thin space (1/6-em)]](https://www.rsc.org/images/entities/char_2009.gif) :
:![[thin space (1/6-em)]](https://www.rsc.org/images/entities/char_2009.gif) coarse aggregate containing a 0.55 water/cement ratio. The chemical composition of ordinary Portland cement (OPC) used is given in Table 1. Clean river sand passing through a 2.36 mm sieve and falling under zone III with a specific gravity 2.60 was used as a fine aggregate. The coarse aggregates used were crushed stone aggregates with a normal size of 19 mm and a specific gravity of 2.6. The PPy–Ag/AgCl electrodes were embedded in concrete at various depths of 5, 10, 20, 30 and 40 mm (Fig. 1) along with the MnO2 solid state reference electrode (SSRE), which was embedded very close to the PPy–Ag/AgCl electrode. After 24 h, the concrete specimens were demolded and cured for 28 days in distilled water. After curing, the concrete cubes were dried and all the four faces of the concrete cubes were sealed with epoxy, except the top and bottom surface for subjecting to the flow of chloride ions from the top surface, as shown in Fig. 1a. The top surface of the cube was surrounded with a PVC mold and glued to the sides of the concrete to prevent solution leakage. Then 3% NaCl solution was poured onto the top surface of the concrete and allowed to penetrate over a period of 90 days at room temperature. In this process, alternate wet and dry cycles were performed to accelerate the corrosion process. One cycle consists of 3 days wetting in chloride solution and 3 days drying in an open atmosphere at room temperature. The potential readings were taken during the 3rd day of wetting, after wiping the solution out. The experimental setup for carrying out the measurements is shown in Fig. 1b.
coarse aggregate containing a 0.55 water/cement ratio. The chemical composition of ordinary Portland cement (OPC) used is given in Table 1. Clean river sand passing through a 2.36 mm sieve and falling under zone III with a specific gravity 2.60 was used as a fine aggregate. The coarse aggregates used were crushed stone aggregates with a normal size of 19 mm and a specific gravity of 2.6. The PPy–Ag/AgCl electrodes were embedded in concrete at various depths of 5, 10, 20, 30 and 40 mm (Fig. 1) along with the MnO2 solid state reference electrode (SSRE), which was embedded very close to the PPy–Ag/AgCl electrode. After 24 h, the concrete specimens were demolded and cured for 28 days in distilled water. After curing, the concrete cubes were dried and all the four faces of the concrete cubes were sealed with epoxy, except the top and bottom surface for subjecting to the flow of chloride ions from the top surface, as shown in Fig. 1a. The top surface of the cube was surrounded with a PVC mold and glued to the sides of the concrete to prevent solution leakage. Then 3% NaCl solution was poured onto the top surface of the concrete and allowed to penetrate over a period of 90 days at room temperature. In this process, alternate wet and dry cycles were performed to accelerate the corrosion process. One cycle consists of 3 days wetting in chloride solution and 3 days drying in an open atmosphere at room temperature. The potential readings were taken during the 3rd day of wetting, after wiping the solution out. The experimental setup for carrying out the measurements is shown in Fig. 1b.
| Components | Chemical composition (mass%) | Physical properties | |||||||
|---|---|---|---|---|---|---|---|---|---|
| SiO2 | Al2O3 | Fe2O3 | CaO | MgO | SO3 | LOI | Specific gravity (g cm−3) | Blaine (cm2 g−1) | |
| OPC | 21.96 | 5.27 | 3.44 | 63.41 | 2.13 | 1.96 | 0.79 | 3.16 | 3214 |
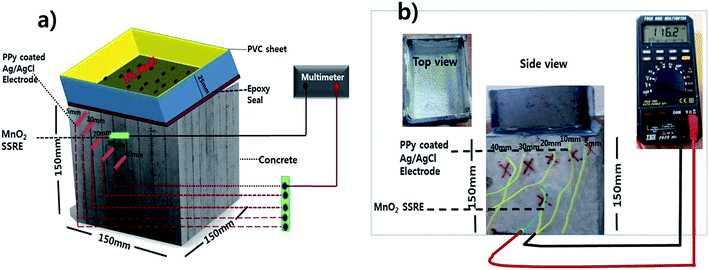 | ||
| Fig. 1 PPy–Ag/AgCl electrodes embedded at various depths (5, 10, 20, 30, 40 mm) along with MnO2 in concrete exposed to 3% chloride environment. | ||
3. Results and discussion
3.1. Properties of Ag/AgCl electrode
The Ag/AgCl electrodes prepared by sintering process were rugged and electronically conductive. The polypyrrole solution prepared makes a thixotropic slurry along with NMP and PVDF and no trace of NMP was found after drying at 80 ± 10 °C.3.2. Testing in sat. KCl
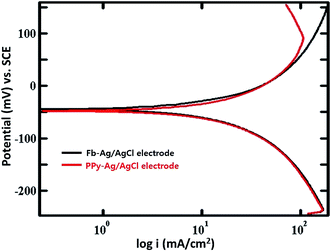 | ||
| Fig. 3 Potentiodynamic polarization curves for the Fb-Ag/AgCl and PPy–Ag/AgCl electrodes in saturated KCl solution. | ||
| System | RP (mV) | Ecorr (mV) | ba (mV dec−1) | bc (mV dec−1) | Icorr (mA cm−2) |
|---|---|---|---|---|---|
| Ag/AgCl | −44.03 | −44.8 | 40 | 41 | 4.147 |
| PPy coated Ag/AgCl | −46.5 | −46.4 | 40 | 42 | 4.126 |
From the HCP measurement and potentiodynamic polarization studies, it was confirmed that PPy conducting polymers has been used as the immobilizing polymer matrix,40,41 which facilitates the transfer of charge between the electrode and the active solution (sat. KCl).42
3.3. Testing in various chloride concentrations
Both the Fb-Ag/AgCl and PPy–Ag/AgCl electrodes were calibrated in different chloride concentrations to ensure the chloride sensing ability. The potentials measured with respect to SCE are plotted against various chloride concentrations ranging from 0.001 mole per L to 1.0 mole per L in Fig. 4. It was observed from Fig. 4 that both the electrodes showed similar behavior and different potentials were observed for different concentrations. Further, the measured potential decreases with increasing concentration of chloride. The chloride ion concentration decreases with the increase in potential, indicating that both the electrodes follow the Nernstian equation.
 | (2) |
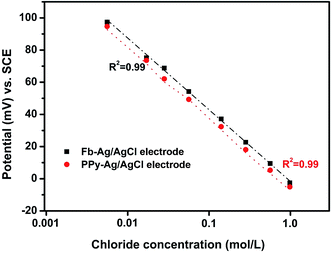 | ||
| Fig. 4 Half-cell potential of the Fb-Ag/AgCl and PPy–Ag/AgCl electrodes in various chloride concentrations. | ||
Furthermore, the Fb-Ag/AgCl and PPy–Ag/AgCl electrodes calibrated in different chloride concentrations revealed a linear response with a correlation coefficient of 0.99. Hence, the result indicates that both electrodes have good sensitive behavior at different chloride ion concentrations.
Fig. 5 shows the calibration of the Fb-Ag/AgCl and PPy–Ag/AgCl electrodes under alkaline environment in synthetic concrete pore solution contaminated with chloride ions ranging from 0.001 mole per L to 1.0 mole per L. From the figure, it was found that Fb-Ag/AgCl electrode potential shows a uniform variation in the higher chloride concentration region (0.01 mole per L to 1.0 mole per L), forming a linear curve fit. At the same time, in the low concentration region (0.001 to 0.01 mole per L) Fb-Ag/AgCl electrode potential was slightly variable from the linear curve, which may be due to the interference of OH− ions,17 and this deviation could be attributed to the formation of AgOH.15 On the other hand, the PPy–Ag/AgCl electrode showed a uniform variation in potential at all the chloride ion concentrations. However, the potential value of the PPy–Ag/AgCl electrode was slightly changed at lower concentrations of chloride ions due to the higher concentration of OH− interference during the measurement. This potential deviation is very low when compared to the Fb-Ag/AgCl electrode. This minor deviation is considered as a negligible change. Hence, the straight line curve of the PPy–Ag/AgCl electrode is exhibited at all chloride ion concentrations in Fig. 5. Moreover, the PPy–Ag/AgCl electrode showed a good linear response with a correlation coefficient of 0.98. It is slightly higher than that of the Fb-Ag/AgCl electrode (0.94). Hence, a PPy–Ag/AgCl electrode has good sensible behavior and exhibits good Nernstian behavior in the high alkaline environment with low and high concentrations of chloride ions. Hence, the PPy electrode is stable in alkaline medium.39,43
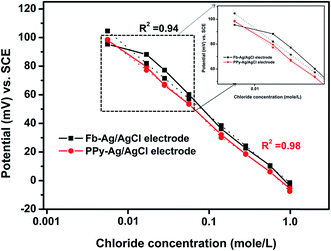 | ||
| Fig. 5 Half-cell potential of the Fb-Ag/AgCl and PPy–Ag/AgCl electrodes in SCPS containing various chloride concentrations. | ||
3.4. Stability of Fb-Ag/AgCl and PPy coated Ag/AgCl electrodes in SCPS
| AgCl + OH− → AgOH + Cl− | (3) |
| 2AgOH → Ag2O + H2O | (4) |
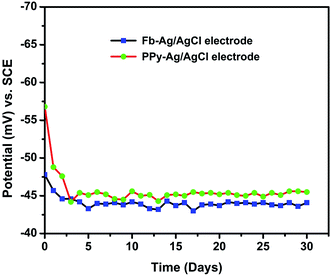
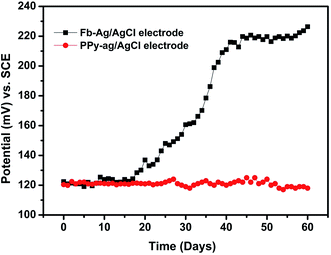
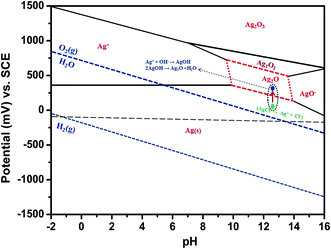
Hence, the above reaction confirmed the formation of Ag2O at the AgCl surface/solution interface, so that the electrode potential of the Fb-Ag/AgCl electrode was unstable in SCPS. For our purpose, we need a stable Ag/AgCl electrode in alkaline cement concrete for sensing the chloride ion concentration. This necessitates the coating on the Ag/AgCl surface, especially for application in concrete structures. On the other hand, the PPy coated electrode developed a constant potential throughout the exposure period of 60 days. This because the PPy coating prevents the formation of Ag2O at the AgCl surface/solution interface. Therefore, the OH− ions interference was reduced in the PPy–Ag/AgCl electrode and then the electrochemical behavior of the PPy coated electrode is more stable in alkaline medium.39,43
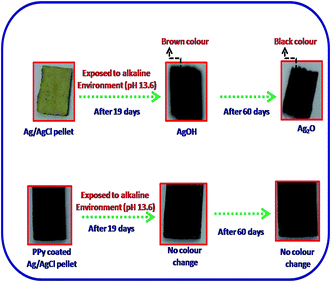
The photographic images captured during this experiment are given in Fig. 8. It can be clearly observed from Fig. 8 that after 19 days of exposure in SCPS the Fb-Ag/AgCl electrode has changed to brown color owing to the formation of AgOH at the AgCl/solution interface. The color change is also progressive owing to the rate of reaction between AgCl and OH−. The appearance of the black color after 60 days of exposure in alkaline solution may be due to the formation of Ag2O and hence showed their mixed potential of Ag2O and AgCl in Fig. 6. On the other hand, no color change was observed in the case of the PPy–Ag/AgCl electrode after 60 days of exposure in SCPS. It is observed that the PPy–Ag/AgCl electrode in SCPS showed stable potential (Fig. 6) even after 60 days of exposure. This is quite suited for our interest to assemble an embeddable PPy–Ag/AgCl electrode for sensing the chloride ion concentration in concrete structures.
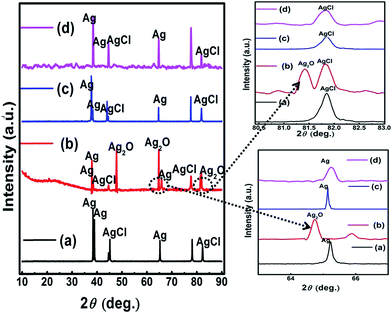 | ||
| Fig. 9 XRD pattern of Fb-Ag/AgCl (a) and PPy–Ag/AgCl (c) electrodes before immersion in SCPS; Fb-Ag/AgCl (b) and PPy–Ag/AgCl (d) electrodes after immersion in SCPS. | ||
Fig. 10 shows the SEM images of the Fb-Ag/AgCl and PPy–Ag/AgCl electrodes before and after exposure in an alkaline solution for 60 days. Fig. 10a and c show the SEM images of the Fb-Ag/AgCl and PPy–Ag/AgCl electrodes, respectively, before immersion in SCPS. Fig. 10a and c show the Fb-Ag/AgCl and PPy–Ag/AgCl electrodes in which the surface morphology is not much affected in both the images. The SEM image shown in Fig. 10b clearly indicates the reactions occurring on the Fb-Ag/AgCl surface (i.e. formation of Ag2O) when the Fb-Ag/AgCl electrode is exposed to SCPS. Comparing the images Fig. 10a and b, a bigger particle size crystal growth formation of Ag2O is clearly visible in Fig. 10b, but it is well evidenced from Fig. 10d that there is no formation of crystal growth when the PPy–Ag/AgCl electrode is exposed to SCPS.
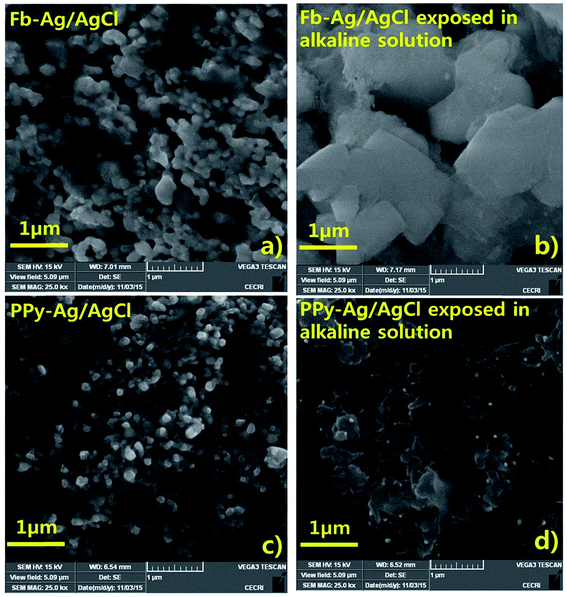 | ||
| Fig. 10 SEM images for Fb-Ag/AgCl electrode before (a), after (b) and PPy–Ag/AgCl electrodes before (c), after (d) immersion in SCPS. | ||
Therefore, the alkaline stable PPy–Ag/AgCl electrodes are suitable for use as embeddable chloride sensors in a concrete environment. Hence, further calibration and chloride sensing tests were carried out with the PPy–Ag/AgCl electrode only.
3.5. Stability of PPy coated Ag/AgCl electrode in various test solutions
Fig. 11 shows the potentiometric response of the PPy–Ag/AgCl electrode in different test solutions such as distilled water, chloride-free synthetic concrete pore solution (SCPS) and chloride-contaminated synthetic concrete pore solution. The PPy–Ag/AgCl electrode showed stable average potential values of 121.0 ± 2 mV vs. SCE in distilled water and 119.5 ± 2 mV vs. SCE in SCPS. This potential difference between distilled water and SCPS was 1.5 mV vs. SCE. Furthermore, there was no significant change in the electrode potential of the PPy–Ag/AgCl electrode. Therefore, the PPy coating can prevent OH− ion interference when measuring the potential of the PPy–Ag/AgCl electrode in SCPS. Upon the addition of chloride ions (such as 0.25 mole per L, 0.50 mole per L and 1.0 mole per L) in SCPS, the measured potential values were 28.3 ± 2 mV, 12.3 ± 2 mV and −3.3 ± 2 mV, respectively. The relation between electrode potential and chloride concentration is given in Table 3. As noted earlier, the potential values decrease with increasing chloride ion concentration. This direct relationship enables us to use the PPy–Ag/AgCl electrode for chloride sensing application in concrete structures.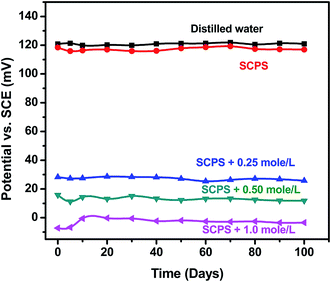 | ||
| Fig. 11 Half-cell potential for PPy–Ag/AgCl electrode in distilled water and various chloride concentrations of SCPS. | ||
| Potential range (mV vs. SCE) | Chloride concentration (mole per L) × 10−2 |
|---|---|
| ≥120 ± 10 mV | 0 to 0.14 |
| 100 to 95 mV | 0.28 to 0.56 |
| 95 to 90 mV | 0.56 to 1.12 |
| 90 to 85 mV | 1.12 to 1.68 |
| 85 to 80 mV | 1.68 to 2.25 |
| 80 to 75 mV | 2.25 to 2.81 |
| 75 to 60 mV | 2.81 to 5.6 |
| 60 to 45 mV | 5.6 to 14.0 |
| 45 to 25 mV | 14.0 to 25.0 |
| 25 to 10 mV | 25.0 to 50.0 |
| 10 to −10 mV | 50.0 to 1.0 |
| Below −10 mV | Above 1.0 |
Since the PPy–Ag/AgCl electrode exhibits excellent stability and reversibility in SCPS and different chloride concentration solutions, its response times with low and high concentration of chloride are essential to validate the chloride ion sensing ability.
The response time graph of the PPy–Ag/AgCl electrode at 0.001 mole per L and 1.0 mole per L is given in Fig. 12. It was observed from Fig. 12 that the time taken to reach a steady potential value from 0.001 mole per L to 1.0 mole per L chloride was 90 seconds; it is interesting to note that the rapid response may be due to the high chloride ion concentration and the presence of hydrophilic quaternary PPy48 for quick interaction with chloride ions. The time taken to reach a steady potential value is 360 seconds for the reverse (1.0 mole per L to 0.001 mole per L) measurement. These results indicate that the concentration of chloride ions was very low when compared to OH− ions and the internal OH− ions accelerated the recovery time but they do not influence the chloride sensing properties.
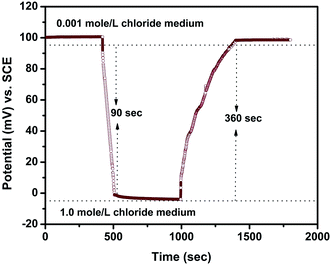 | ||
| Fig. 12 Response time behavior of the PPy–Ag/AgCl electrode in low and high concentrations of chloride. | ||
3.6. Electrochemical behaviours of PPy–Ag/AgCl electrode
Fig. 13 shows the potentiodynamic polarization of the PPy–Ag/AgCl electrode in SCPS with different chloride concentrations. The corresponding corrosion kinetic parameters are given in Table 4. The Ecorr value of the PPy–Ag/AgCl electrode was 103 mV vs. SCE in SCPS. In the presence of 0.25 mole per L, 0.50 mole per L and 1.0 mole per L of chloride, the Ecorr values of the electrode were 26.08, 11.63 and −2.8 mV (vs. SCE), respectively. The corrosion current density of the PPy coated Ag/AgCl electrode was 0.1529 mA cm−2 in SCPS. Upon the addition of 0.25 mole per L, 0.50 mole per L and 1.0 mole per L of chloride, the Icorr values observed were 0.3123, 0.4112 and 0.6277 mA cm−2, respectively. The addition of chloride in SCPS increased the corrosion current density of the PPy–Ag/AgCl electrode.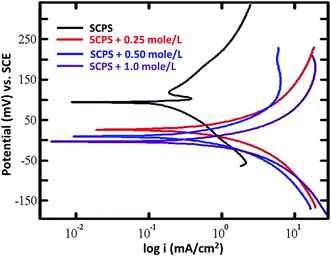 | ||
| Fig. 13 Potentiodynamic polarization curves for the PPy–Ag/AgCl electrode in SCPS with various chloride concentrations. | ||
| Concentration of Cl− (mole per L) | Rp (mV) | Ecorr (mV) | ba (mV dec−1) | bc (mV dec−1) | Icorr (mA cm−2) |
|---|---|---|---|---|---|
| 0 | 124 | 103 | 55 | 104 | 0.1529 |
| 0.25 | 32 | 26.8 | 38 | 38.4 | 0.3124 |
| 0.50 | 20 | 11.63 | 51 | 55 | 0.4112 |
| 1.0 | 10 | −2.82 | 51 | 47 | 0.6277 |
Fig. 14 shows the Nyquist curves for the PPy–Ag/AgCl electrode in SCPS containing chloride ion concentrations of 0.25 mole per L, 0.50 mole per L and 1.0 mole per L. The impedance parameters are given in Table 5. The Rct value of the PPy–Ag/AgCl electrode was 11.81 Ω cm2. The Rct values noted were 9.152, 2.266 and 2.162 Ω cm2 in the presence of chloride at 0.25 mole per L, 0.50 mole per L and 1.0 mole per L, respectively. It was also observed that the increase in chloride ion concentration decreases the charge transfer resistance (Rct) of the PPy–Ag/AgCl electrode. The Cdl value of the PPy coated Ag/AgCl electrode was 0.4033 × 10⁻¹ F cm−2. In the presence of 0.25 mole per L, 0.50 mole per L and 1.0 mole per L of chloride, the Cdl values observed are 0.58163×10⁻¹, 1.6560×10⁻¹ and 1.7410×10⁻¹ F cm−2, respectively.
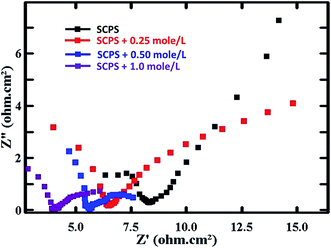 | ||
| Fig. 14 AC-impedance curves for the PPy coated Ag/AgCl electrode in SCPS with various chloride concentrations. | ||
| SCPS containing various Cl− concentrations (mole per L) | Icorr (mA cm−2) | Rs (Ω cm2) | Rct (Ω cm2) | Cdl (×10−1 F cm−2) |
|---|---|---|---|---|
| 0 | 2.209 | 8.305 | 11.81 | 0.4033 |
| 0.25 | 2.850 | 6.433 | 9.152 | 0.5816 |
| 0.50 | 11.510 | 5.571 | 2.266 | 1.6560 |
| 1.0 | 12.071 | 3.396 | 2.162 | 1.7410 |
3.7. Standardization of PPy–Ag/AgCl electrode with respect to MnO2
The PPy–Ag/AgCl electrode was calibrated with an MnO2 electrode. The fabrication of the MnO2 solid state reference electrode (SSRE) was discussed elsewhere.49 The stable potential value of the MnO2 electrode was +206 ± 6 mV in SCPS and chloride contaminated SCPS.50 The potential of the PPy–Ag/AgCl electrode with respect to MnO2 in SCPS containing low chloride concentrations ranging from 0.001 to 0.01 mole per L was measured and is plotted in Fig. 15a. The figure shows that there was a significant change in the potential observed with the increasing chloride ion concentration in SCPS. Further, the measured potential decreases from −106 mV to −153 mV with increasing chloride ion concentration ranging from 0.001 to 0.01 mole per L in SCPS. In addition, the potential vs. high chloride ion concentration ranging from 0.01 to 1.0 mole per L is shown in Fig. 15b. Here also, the potential values decrease from −174 mV to −213 mV with increasing chloride ion concentrations ranging from 0.01 to 1.0 mole per L.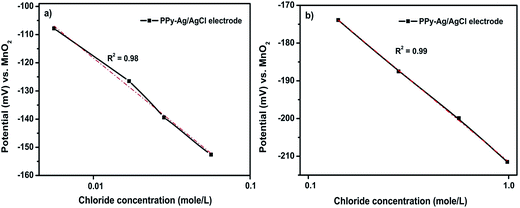 | ||
| Fig. 15 Calibration of the PPy coated Ag/AgCl electrode with respect to MnO2 in SCPS containing low (a) and high (b) concentration of chloride solution. | ||
The PPy–Ag/AgCl electrode has a good linear relationship between the potential and the logarithmic chloride ions activity is termed as the Nernstian equation. Furthermore, the correlation coefficient R2 values are 0.98 and 0.99 at low (0.001 to 0.01 mole per L) and high (0.01 to 1.0 mole per L) concentrations of chloride ions in SCPS, respectively. However, a slight deviation (R2 = 0.98) from linearity is observed at low chloride ion concentrations when compared with high chloride ion concentrations. The slight deviation of potential is due to the OH− interference during the measurement. This minor deviation is considered as a negligible change. Hence, a straight line curve for the PPy–Ag/AgCl electrode was exhibited at all chloride ion concentrations in Fig. 15a and b. From this study, it is inferred that the PPy–Ag/AgCl electrode has a stable potential and is suitable for application in long-term chloride ion monitoring of civil infrastructures.
3.8. Evaluation of PPy–Ag/AgCl electrode embedded in concrete
Fig. 16 shows the chloride migration profile of the PPy–Ag/AgCl electrode embedded at 5, 10, 20, 30 and 40 mm depths of concrete. The potentials vary with increasing depth. The impact of the free Cl− ions concentration at lower depth (5 and 10 mm) is greater than at the higher depth of concrete (20 mm to 40 mm). This is because initially the concrete is dry and porous in nature, which allows more chloride ions to penetrate through the pores of the concrete. The chloride penetration at 5 and 10 mm depth is rapid during the first 5 days, showing the increase in potential, and after that the potential decreases; after 17th day the potential increases again and it reached the maximum at the 30th day. The decrease in potential may be owing to the complexation of chlorides with the cement hydration products, leading to the formation of Friedel's salt,51 which caused a decrease in the free chloride content.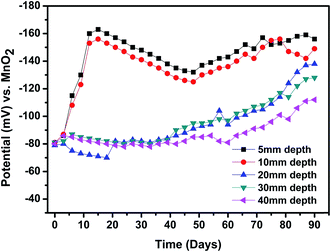 | ||
| Fig. 16 Potential (against MnO2) vs. time behavior of the PPy coated Ag/AgCl electrode exposed at various depths. | ||
4. Conclusions
The following conclusions were drawn from the above study:• A solid state alkaline chloride electrode was prepared and fabricated for chloride sensing application in concrete infrastructure.
• The presence of the conducting polymer prevented the formation of Ag2O in the PPy–Ag/AgCl electrode, which is comparable with the Fb-Ag/AgCl electrode and has good alkaline stability.
• In addition to alkaline stability, the chloride sensing capability of PPy–Ag/AgCl electrode was confirmed by HCP and polarization studies. It illustrates that the PPy coating did not affect the electrochemical behavior of the Ag/AgCl electrode.
• The PPy–Ag/AgCl electrode possesses a rapid, reversible characterization in chloride solution. For example, from 0.001 to 1.0 mole per L of chloride the time taken to reach the steady state potential is 90 s, and the same is 360 seconds for the reverse measurements (from high concentration to low concentration of chloride ions).
• The HCP of the PPy–Ag/AgCl electrode was 120 mV vs. SCE. The electrode clearly distinguished the difference in chloride ion concentrations ranging from 0.001 to 1.0 mole per L per ppm and thereby the electrode has an excellent chloride sensing ability.
• Further calibration of the PPy–Ag/AgCl electrode was evaluated with respect to MnO2 under various depths in chloride contaminated concrete and the results showed that the PPy coated electrode has excellent chloride sensing ability.
• The data collected from the above tests reveal that the fabricated electrode is more stable in an alkaline medium and can be used as a chloride monitoring sensor in civil infrastructures.
Acknowledgements
This research was supported by the Basic Science Research Program through the National Research Foundation of Korea (NRF) funded by the Ministry of Science, ICT, & Future Planning (No. 2015R1A5A1037548).References
- P. Castro, E. I. Moreno and J. Genesca, Cem. Concr. Res., 2000, 30, 1565–1571 CrossRef CAS.
- T. U. Mohammed, H. Hamada and T. Yamaji, ACI Mater. J., 2004, 101, 13–18 CAS.
- M. Moradian, M. Shekarchi, M. Aabdollah and R. Alidadi, J. Perform. Constr. Facil., 2012, 26, 633–643 CrossRef.
- H. Zhao, Y. M. Zhang and J. Ming, Hydrogen Sci. Eng., 2013, 5, 54–60 Search PubMed.
- Y. D. Song, J. H. Liu, F. X. Yi, B. Xu and P. Ge, Appl. Mech. Mater., 2013, 345, 184–188 CrossRef.
- L. Bertolini, B. Elsener, P. Pedeferri and R. Polder, Corrosion of Steel in Concrete: Prevention, Diagnosis, Repairs, Wiley-VCH, 2nd edn, 2013, vol. 91–104, DOI:10.1002/3527603379.
- G. K. Glass and N. R. Buenfeld, Progr. Struct. Eng. Mater., 2000, 2, 448–458 CrossRef.
- X. Shi, N. Xie and K. Fortune, Constr. Build. Mater., 2012, 30, 125–138 CrossRef.
- C. Arya, N. R. Buenfield and J. B. Newman, Cem. Concr. Res., 1987, 17, 907–918 CrossRef CAS.
- C. P. Atkins, M. A. Carter and J. D. Scantlebury, Cem. Concr. Res., 2001, 31, 1207–1211 CrossRef CAS.
- U. Angst, B. Elsener, C. K. Larsen and O. Vennesland, J. Appl. Electrochem., 2010, 40, 561–573 CrossRef CAS.
- Y. Abbas, W. Olthuis and A. van den Berg, Sens. Actuators, B, 2013, 188, 433–439 CrossRef CAS.
- W. McCarter, T. Chrisp, G. Starrs, A. Adamson, E. Owens, P. A. M. Basheer, S. V. Nanukuttan, S. Srinivasan and N. Holmes, J. Infrastruct. Syst., 2012, 18, 167–175 CrossRef.
- M. Torres-Luque, E. Bastidas-Arteaga, F. Schoefs, M. Sanchez -Silva and J. F. Osma, Constr. Build. Mater., 2014, 68, 68–81 CrossRef.
- B. Elsener, L. Zimmermann and H. Bohni, Mater. Corros., 2003, 54, 440–446 CrossRef CAS.
- K. N. Gurusami, M. P. Geoghegan, in Corrosion of Reinforcement in concrete, ed. C. L. Page, K. W. J. Treadaway and P. B. Bamforth, Society of Chemical Industry, London, 1990, pp. 333–347 Search PubMed.
- X. Gao, J. Zhang, Y. Yang and H. Deng, Sensors, 2010, 10, 10226–10239 CrossRef CAS PubMed.
- M. A. Climent-Lorca, E. Viqueira-Perez and M. M. Lopez-Atalaya, Cem. Concr. Res., 1996, 26, 1157–1161 CrossRef.
- C. P. Atkins, J. Scantlebury, P. Nedwell and S. Blatch, Cem. Concr. Res., 1996, 26, 319–324 CrossRef CAS.
- U. Angst, B. Elsener, C. K. Larsen and O. Vennesland, J. Appl. Electrochem., 2010, 40, 561–573 CrossRef CAS.
- G. Duffo, S. Farina and C. Giordano, Electrochim. Acta, 2009, 54, 1010–1020 CrossRef CAS.
- G. De Vera, M. Climent, C. Antón, A. Hidalgo and C. Andrade, J. Electroanal. Chem., 2010, 639, 43–49 CrossRef CAS.
- F. Pargar, D. A. Koleva, O. Copuroglu, E. A. B. Koenders and K. van Breugel, Constr. Mater., 2014, uuid:95faa6e6-bfa9–4f7b-8e25-de4a55c2493a Search PubMed.
- J. Junsomboon and J. Jakmunee, Talanta, 2008, 76, 365–368 CrossRef CAS PubMed.
- M. F. Montemor, J. H. Alves, A. M. Simoes, J. C. S. Fernandes, Z. Lourenço, A. J. S. Costa, A. J. Appleton and M. G. S. Ferreira, Cem. Concr. Compos., 2006, 28, 233–236 CrossRef CAS.
- R. G. Du, R. G. Hu, R. S. Huang and C. J. Lin, Anal. Chem., 2006, 78, 3179–3185 CrossRef CAS PubMed.
- Y. S. Femenias, U. Angst, F. Caruso and B. Elsener, Mater. Struct., 2016, 49, 2637–2651 CrossRef.
- T. Blaz, J. Migdalski and A. Lewenstam, Analyst, 2005, 130, 637–643 RSC.
- J. Ha, S. M. Martin, Y. Jeon, I. J. Yoon, R. B. Brown, H. Nam and G. S. Cha, Anal. Chim. Acta, 2005, 549, 59–66 CrossRef CAS.
- A. Talaie, J. Y. Lee, Y. K. Lee, J. Jang, J. A. Romagnoli, T. Taguchi and E. Maeder, Thin Solid Films, 2000, 363, 163–166 CrossRef CAS.
- N. M. Rowley and R. J. Mortimer, Sci. Prog., 2002, 85, 243–262 CrossRef CAS PubMed.
- N. L. Pickup, M. Lam, D. Milojevic, R. Y. Bi, J. S. Shapiro and D. K. Y. Wong, Polymer, 1997, 38, 2561–2565 CrossRef CAS.
- K. M. Mangold, S. Schafer and K. Juttner, Fresenius. J. Anal. Chem., 2000, 367, 340–342 CrossRef CAS PubMed.
- R. N. Singh Madhu and R. Awasthi, Polypyrrole Composites: Electrochemical Synthesis, Characterizations and Applications, Electropolymerization, ed. Ewa Schab-Balcerzak, In Tech, 2011, ISBN: 978-953-307-693-5, http://www.intechopen.com/books/electropolymerization/polypyrrolecomposites-electrochemical-synthesis-characterizations-and-applications Search PubMed.
- J. Pionteck, M. Omastova, P. Potschke, F. Simon and I. Chodak, J. Macromol. Sci., Part B: Phys., 1999, 38, 737–748 CrossRef.
- Q. Hao, V. Kulikov and V. M. Mirsky, Sens. Actuators, B, 2003, 94, 352–357 CrossRef CAS.
- S. N. Eliseeva, V. V. Maleva and V. V. Kondrat, Russ. J. Electrochem., 2009, 45, 1045–1051 CrossRef CAS.
- V. Tsakova, J. Solid State Electrochem., 2008, 12, 1421–1434 CrossRef CAS.
- J. Vatsalarani, S. Geetha, D. C. Trivedi and P. C. Warrier, J. Power Sources, 2006, 158, 1484–1489 CrossRef CAS.
- G. Bidan, Sens. Actuators, B, 1992, 6, 45–56 CrossRef CAS.
- N. Gomez and C. E. Schmidt, J. Biomed. Mater. Res., Part A, 2007, 81, 135–149 CrossRef PubMed.
- M. J. Swann, D. Bloor, T. Haruyama and M. Aizawa, Biosens. Bioelectron., 1997, 12, 1169–1182 CrossRef CAS.
- J. Stejskal, M. Trchova, P. Bober, Z. Moravkov, D. S. Kopecky, M. Vrnata, J. Proke, M. Varga and E. Watzlova, RSC Adv., 2016, 6, 88382–88391 RSC.
- X. Zhang, S. Stewart, D. W. Shoesmith and J. C. Wren, J. Electrochem. Soc., 2007, 154, 70–76 CrossRef.
- M. E. Poisot-Diaz, I. Gonzalez and G. T. Lapidus, Hydrometallurgy, 2008, 93, 23–29 CrossRef CAS.
- C. S. Yang, D. S. Shang, Y. S. Chai, L. Q. Yan, B. G. Shen and Y. sun, Phys. Chem. Chem. Phys., 2016, 18, 12466–12475 RSC.
- R. G. Du, R. G. Hu, R. S. Huang and C. J. Lin, Anal. Chem., 2006, 78, 3179–3185 CrossRef CAS PubMed.
- W. Zhong, S. Liu, X. Chen, Y. Wang and W. Yang, Macromolecules, 2006, 39, 3224–3230 CrossRef CAS.
- S. P. Karthick, S. Muralidharan, V. Saraswathy and K. Thangavel, Sens. Actuators, B, 2014, 192, 303–309 CrossRef CAS.
- S. Muralidharan, V. Saraswathy, A. Madhavamayandi, K. Thangavel and N. Palaniswamy, Electrochim. Acta, 2008, 53, 7248–7254 CrossRef CAS.
- S. P. Karthick, S. Muralidharan, V. Saraswathy and S. J. Kwon, Journal of Structural Integrity and Maintenance, 2016, 1, 35–42 CrossRef.
| This journal is © The Royal Society of Chemistry 2017 |

