 Open Access Article
Creative Commons Attribution 3.0 Unported Licence
Synthesis of copper sulfide nanoparticles and evaluation of in vitro antibacterial activity and in vivo therapeutic effect in bacteria-infected zebrafish†
Khan Behlol Ayaz Ahmed and
Veerappan Anbazhagan *
*
Department of Chemistry, School of Chemical and Biotechnology, SASTRA University, Thanjavur – 613 401, Tamil Nadu, India. E-mail: anbazhagan@scbt.sastra.edu; anbugv@gmail.com
First published on 25th July 2017
Abstract
In this study, a facile method to synthesize non-toxic copper sulfide nanoparticles was reported, and the antibacterial activity of the nanoparticles in infected zebrafish was evaluated. Transmission electron microscopy showed that the CuS NPs are spherical in shape with a size range from 10 to 25 nm. FTIR spectra revealed that the CuS NPs were stabilized by N-lauryltyramine. CuS NPs exhibit very good antibacterial activity against Gram-negative and Gram-positive bacteria, and the minimum inhibitory concentration was determined as 12.5 μM. In vitro mechanistic studies revealed that CuS NPs kill the bacteria by damaging their cell membranes and producing reactive oxygen species. Therapeutic activity of CuS NPs was tested in bacteria-infected zebrafish. The route of administration of CuS NPs was via an injection and medicated bath. Both routes of drug administration were suitable to cure the fish from bacterial infection. Bacterial colony count assay revealed that the CuS NPs depleted the infectious bacteria from the fish body within 24 h. Strikingly, CuS NPs in concentration eight times than the MIC did not show toxicity in the liver and brain of zebrafish. Moreover, the NPs exhibited good hemocompatibility with human red blood cells. Our study demonstrated for the first time that CuS NPs are a safe antibacterial agent, and medicated bath with zebrafish is a hassle-free model for testing the antibacterial activity of nanoparticles.
1. Introduction
The growing number of identified multi-drug-resistant bacterial strains are a major concern in modern medicine.1,2 Multi-drug resistance (MDR) cannot be curtailed with standard drug treatments and requires high-dose administration of multiple drugs that often leads to undesirable side effects.3,4 As an alternative to conventional antibacterial therapy, metal nanoparticles such as Au, Ag, Cu, Pt, Pd, ZnO, TiO2, Bi2O3, CuO, and Fe2O3 have been explored as antibacterial agents.5–11 Of late, materials like Bi2O3, Ce-doped Bi2MoO6, Ag-decorated Bi2O3, TiO2–Bi2WO6, and Fe–TiO2 have been used for photocatalytic inactivation of bacteria.12–15 The precursors to synthesize copper nanoparticles are more readily available than those to synthesize other metal nanoparticles; therefore, developing an antibacterial agent with CuNPs is cost effective.16 Although CuNPs exhibit good antibacterial activity, they are highly toxic when tested in the zebrafish animal model.17 At the same time, at lower concentrations, these NPs act as efflux pump inhibitors and prevent biofilm formation.18,19 The beneficial nature of CuNPs can be exploited by minimizing their toxicity and maximizing their therapeutic window through proper surface modification. For example, we have recently shown that the sulfidation of CuNPs decreases their toxicity.17Copper sulfide (CuS), a P-type semiconductor, has received attention recently due to its potential application in various fields, including thermoelectrics, solar cells, ion storage, batteries, and photovoltaic, photocatalytic, and chemical sensing applications.20–24 In addition to semiconductor-based application, CuS NPs have been emerging as a promising platform for photothermal cancer therapy, biomolecular sensing, and molecular imaging.25–27 Herein, we demonstrate the antibacterial activity of CuS NPs against Gram-positive and Gram-negative pathogenic bacteria. CuS NPs kill bacteria through the production of reactive oxygen species (ROS) and by disturbing the bacterial membranes. There are numerous reports about the antibacterial activity of various metal NPs including CuS NPs,28–30 but most are basic evaluations and their efficacy in an infected animal model has been rarely reported. Another bottleneck in the usage of NPs is their toxicity in biological systems, which delays the advancement of these materials for clinical applications.31–33 The paucity was addressed in this study by curing bacteria-infected zebrafish using CuS NPs. The zebrafish animal model is an important model in biomedical research because zebrafish share several common biological pathways with humans and are 80% genetically identical to humans.34–37 CuS NPs stop bacterial proliferation in zebrafish and cure them from microbial infection. The CuS NPs kill the bacteria, exhibit low toxicity and maintain good hemocompatibility. Notably, the CuS NPs not only cure the infection but also disinfect the pathogens present in water.
2. Results and discussion
2.1. Synthesis of copper sulfide nanoparticles
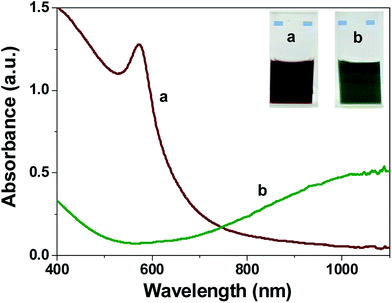
Copper sulfide nanoparticles were prepared from N-lauryltyramine capped copper nanoparticles (NLTA-CuNPs). The freshly prepared NLTA-CuNPs on reaction with sodium sulfide produced a color change from brown to olive green, indicating the formation of CuS NPs (Fig. 1). The quantitative chemical composition of copper and sulfide in our preparation was estimated by energy dispersive X-ray spectroscopy (EDX). The EDX analysis was carried out only for Cu and S; the average atomic percentage ratio of Cu![[thin space (1/6-em)]](https://www.rsc.org/images/entities/char_2009.gif) :
:![[thin space (1/6-em)]](https://www.rsc.org/images/entities/char_2009.gif) S was 42
S was 42![[thin space (1/6-em)]](https://www.rsc.org/images/entities/char_2009.gif) :
:![[thin space (1/6-em)]](https://www.rsc.org/images/entities/char_2009.gif) 58, showing that the CuS NPs were in a good stoichiometric ratio (Fig. S1†).
58, showing that the CuS NPs were in a good stoichiometric ratio (Fig. S1†).
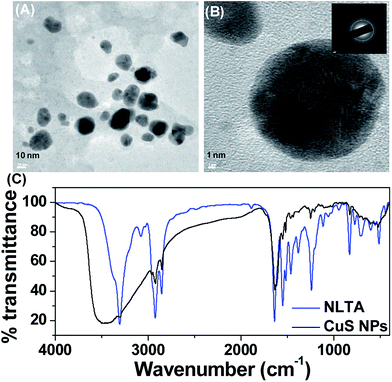
The size and morphology of the CuS NPs were measured by TEM analysis, which clearly revealed that the NPs are spherical in shape with a size range from 10 to 25 nm (Fig. 2A). High-resolution TEM showed a metallic fringe pattern (Fig. 2B). The selected area electron diffraction (SAED) pattern showed ring patterns, suggesting the crystalline nature of NPs (inset of Fig. 2B). The size of the NPs was further verified by a particle size analyzer (PSA), and it was observed that the size obtained from PSA (70.6 nm) differed from that shown via TEM (Fig. S2†). The polydispersity index (PDI) of NLTA-CuS NPs was 0.340. It is well known that polydispersity of the NPs can distort PSA.38 At the same time, the difference in the size can also be attributed to the presence of the N-lauryltyramine capping agent on the NP surface because TEM measured the size of the individual NPs, whereas PSA took into account the hydrodynamic ligand shell too. To validate our claim, FTIR spectra of NLTA and CuS NPs were measured (Fig. 2C). The IR spectra of NLTA showed a sharp band at 3305 cm−1 for –NH and –OH stretching vibrations of NLTA. The peak at 2920 and 2852 cm−1 was attributed to –CH symmetric and asymmetric stretching, respectively. The characteristic peaks of amide linkage were observed at 1638 cm−1 (amide I) and 1548 cm−1 (amide II). Methylene bending and rocking bands were observed near 1463 cm−1 and 715 cm−1, respectively. The IR spectra of CuS NPs showed peaks at 3470, 2918, 2851, 1637, 1548, 1466 and 720 cm−1, which correspond to asymmetric and symmetric stretching vibration of NLTA molecules. The broadening and shifting of –OH/–NH stretching vibrations (3470 cm−1) were recorded for the CuS NPs, suggesting that the NLTA molecules were successfully coated on CuS NPs, leading to the NPs having good solubility and sufficient stability. Zeta potential estimates for NLTA-stabilized CuS NPs were −25.3 mV (Fig. S3†), suggesting that the NP boundaries were well separated to prevent agglomeration.
2.2. Antibacterial activity of CuS NPs
In vitro antibacterial susceptibility of CuS NPs was evaluated against two Gram-negative bacteria (E. coli and A. hydrophila) and two Gram-positive bacteria (B. subtilis and S. aureus). Resazurin microplate assay (REMA) was adopted for determining the minimum inhibitory concentration (MIC), the lowest concentration of the antibacterial agent to prevent the growth of a microorganism. Live bacterial cells irreversibly reduce resazurin to resorufin, displaying a pink color with strong fluorescence at 580 nm, whereas dead cells show blue color with weak fluorescence. Results shown in Fig. 3 show that the bacterial cells exposed to CuS NPs showed weak fluorescence upto 12.5 μM, after which the fluorescence increased, indicating the existence of viable cells and that the MIC is 12.5 μM (Fig. 3). MIC determined by conventional turbidimetry is consistent with that determined by REMA (Fig. S5†). The antibacterial activity of CuS NPs was also tested by the conventional zone of inhibition (ZOI) method. ZOI measures the killing efficiency of the NPs against the tested bacteria. Results demonstrated that 10 μM is sufficient to kill the bacteria; however, killing efficiency increased with concentration of CuS NPs (Fig. S6†). Based on these results, 10 μM was chosen for further studies.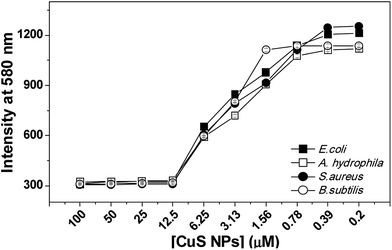 | ||
| Fig. 3 REMA assay. Below 12.5 μM, fluorescence intensity was observed in all the tested bacteria. Experiments were performed in triplicate. | ||
2.3. In vivo antibacterial activity
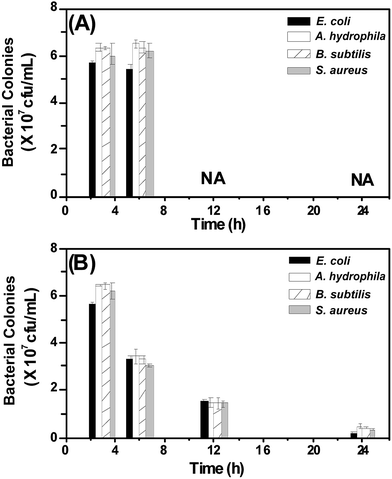
Having observed promising antibacterial activity against Gram-positive and Gram-negative microorganisms, we set out to investigate the therapeutic efficacy of CuS NPs in an animal model. To this end, we infected zebrafish intramuscularly with an optimized concentration of microbes (see ESI†) and initiated treatment with CuS NPs. Two treatment methods were adopted, (i) intramuscular injection treatment and (ii) medicated bath treatment.For the injection method, fish were divided into two groups and each group contained five healthy fish. Group A and group B were infected intramuscularly with 10 μL of microbes (0.1 OD660 nm) and allowed to live in normal tap water. After three hours of infection, only group B fish were injected with 10 μL of CuS NPs (10 μM). Group A fish infected with microbes slowed down in 6 h and finally succumbed to infection in 8–10 h. In contrast, group B fish treated with CuS NPs remained alive and their behaviour was similar to that of uninfected fish. To understand how CuS NPs cure the fish from infection, we sacrificed the fish from both groups at regular time intervals and collected muscle tissues through dissection. The dissected tissues were homogenized and diluted appropriately in PBS buffer and plated on an agar plate. The plates were incubated for 24 h at 37 °C and the number of bacterial colonies present in each group were estimated. Representative plates corresponding to E. coli infection and treatment with CuS NPs are shown in Fig. S7A and B,† respectively. As noted from Fig. 4A, both Gram-negative and Gram-positive strains without NP treatment exhibit a typically high number of bacterial colonies, while group B shows considerably depleted bacterial colonies after 24 h (Fig. 4B). This indicates that CuS NPs kill the microbes and save the zebrafish from infection.
Injection method is painful and requires a skilful technician to administer the drug. Moreover, it is difficult to identify individually infected fish from a big pool. Thus, it is imperative to develop an antibacterial agent to treat the infected fish in the entire pool without affecting the uninfected fish. To meet the demand, we initiated the antibacterial study with water containing CuS NPs (called as a medicated bath). Fish were divided into two groups and infected intramuscularly with 10 μL of microbes (0.1 OD660 nm). Group A fish were allowed to live in normal tap water and group B fish were allowed to live in tap water containing 10 μM of CuS NPs. Group A fish died in 8–10 h due to the severity of infection. Interestingly, group B fish survived the infection and started behaving similar to uninfected fish. In order to understand the antibacterial activity of CuS NPs, the muscle tissues of the fish were dissected and analyzed for bacterial colonies. As shown in Fig. 5 and S8,† the medicated bath of CuS NPs halts the proliferation of Gram-negative and Gram-positive strains and cures the zebrafish.
2.4. Antibacterial mechanism of CuS NPs
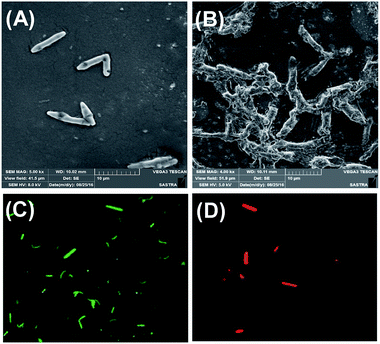
To understand the antibacterial mechanism of CuS NPs, we evaluated the morphology changes of bacteria via scanning electron microscopy. About 0.1 OD660 nm of E. coli were incubated with 10 μM of CuS NPs for 12 h and imaged via SEM. The cell walls of the bacteria treated with CuS NPs are wrinkled and damaged, while the untreated cells are smooth, rod-shaped with intact cell walls (Fig. 6A and B).In addition, the integrity of the bacterial membranes was also examined by dual acridine orange/ethidium bromide staining (AO/EB). AO, a membrane-permeable dye, stains live cells and displays green fluorescence, whereas EB can only pass through the damaged membrane of dead cells and stain nucleic acid to display red fluorescence. After incubation with 10 μM of CuS NPs for 12 h, the cells were stained with AO/EB mixture and examined by fluorescence microscopy. As shown in Fig. 6C, the untreated cells rarely show red fluorescence, but display green fluorescence, indicating that the cells are alive. In contrast, all the cells treated with NPs show red fluorescence, confirming the death of the cells and membrane damage (Fig. 6D).
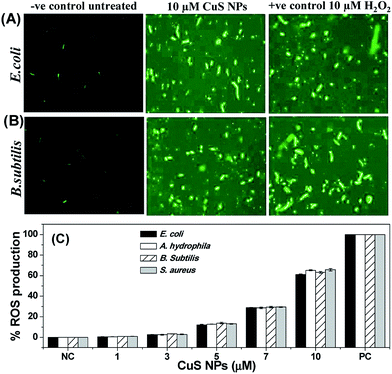
Oxidative stress is one of the proposed antibacterial mechanisms of metal nanoparticles.39–41 The involvement of oxidative stress in antibacterial activity of CuS NPs was examined through the measurement of intracellular reactive oxygen species (ROS) production by H2-DCFDA assay. In the presence of ROS, non-fluorescent H2-DCFDA is oxidized and switches to green-fluorescent dichlorofluorescein (DCF). For this study, H2O2 was chosen as the positive control and the untreated cells as the negative control. As shown in Fig. 7A and B, weak ROS is generated in control cells, but CuS NPs and H2O2 trigger more production of ROS, as evidenced from the strong green fluorescence. Fig. 7C further shows the concentration-dependent increase in ROS production in the NP-treated cells, suggesting ROS-mediated cell death. At the same time, in comparison to the positive control (100%), ROS production level in Gram-negative and Gram-positive varies from 61% to 65% when treated with 10 μM CuS NPs. This implied that despite ROS production, membrane damage is also responsible for killing the bacteria.
The ROS production was further verified by measuring the production of malondialdehyde (MDA). The unsaturated fatty acids of cell membranes are highly vulnerable to ROS attack. The excess ROS produced will react with cell membranes and produce lipid peroxide radical, which on rearrangement will form MDA. The amount of MDA formed in the cells treated with CuS NPs was estimated using thiobarbituric acid assay. Fig. S9A† shows the concentration-dependent increase in MDA production in the NP-treated cells, supporting the generation of ROS. The intracellular ROS production was further investigated by measuring reduced glutathione concentration (GSH). GSH, a non-protein tripeptide, maintains the intracellular redox environment and protects the cells from oxidative damage by scavenging ROS.42 Thus, the maintenance of GSH oxidative defense is vital for cell survival. However, the generation of excess ROS oxidizes GSH to form disulfide.43 The amount of GSH present in the cells treated with CuS NPs was determined by DTNB assay. It was found that GSH concentration depleted in the treated cells with subsequent increase in CuS NP concentration (Fig. S9B†). These results suggested that the interaction of CuS NPs with Gram-negative and Gram-positive bacteria triggered the intracellular ROS-mediated oxidative damage over the antioxidant defense and damaged the cell membrane, leading to cell death. A similar observation was reported in E. coli and P. aeruginosa, when they were treated with biosynthesized silver nanoparticles.44
2.5. CuS NPs as a water disinfectant
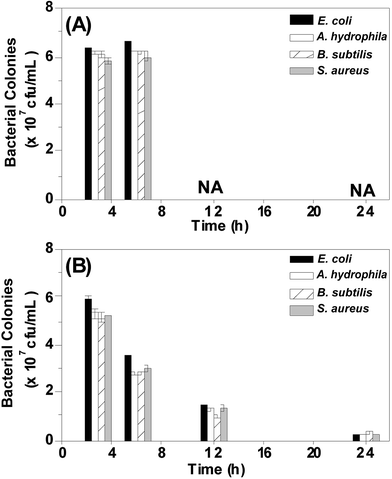
Having demonstrated the therapeutic efficacy of CuS NPs, we surmised that CuS NPs can also work as a general disinfectant. To test this hypothesis, two groups of fish were employed. A. hydrophila was chosen for this study because it is a fish-specific pathogen. Group A fish were exposed to water containing 0.1 OD660 nm of A. hydrophila. Contrary to the intramuscular infection, group A fish succumbed to infection in 33 h, which suggests that the inherent defense mechanism present in the healthy fish delayed the waterborne bacterial infection. Group B fish, exposed to water containing 0.1 OD660 nm A. hydrophila and 10 μM CuS NPs, survived the infection.At regular intervals, water from both the groups was collected and plated on an LB agar plate for counting the bacterial colonies. Strikingly, the water collected from group A showed higher number of bacterial colonies, which kept proliferating, as evidenced from the formation of uncountable bacterial mat on the LB agar plate after 6 h (Fig. S10A†), whereas the water containing CuS NPs showed a time-dependent decrement in the bacterial colonies, indicating that CuS NPs kill the bacteria and prevent their proliferation (Fig. S10B† and 8). Unlike intramuscular infection, the fish exposed to water containing E. coli, B. subtilis and S. aureus were not infected. This could be attributed to the non-specific nature of the pathogens. However, the addition of CuS NPs killed the bacteria present in the water, as evidenced from the bacterial colony count assay (Fig. 8). These results suggested that CuS NPs may help prevent waterborne diseases.
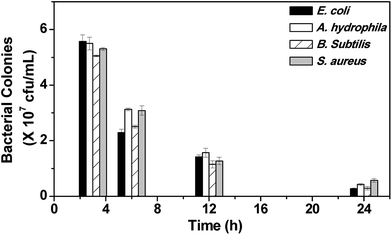 | ||
| Fig. 8 Viable bacterial colonies present in water after treatment with 10 μM CuS NPs. Diluted water (10−4 times) was used for LB agar plating. Experiments were performed in triplicate. | ||
2.6. Evaluation of CuS NP toxicity
The abovementioned studies demonstrate that the NLTA-CuS NPs have good therapeutic potential as an antibacterial agent and water disinfectant. However, to meet clinical standards, NPs should be less or non-toxic. To this end, we evaluated the toxicology parameters in zebrafish through assaying liver carboxylesterase (CES) and brain acetylcholinesterase (AchE) activity. The liver is an important organ for xenobiotic detoxification. Carboxylesterase is an enzyme activated during xenobiotic stress and involved in the hydrolysis of carboxylic esters. AchE catalyzes the breakdown of acetylcholine and other choline esters to facilitate function as a neurotransmitter; therefore, it can serve as a marker for neuronal toxicity. Strikingly, the treatment of zebrafish with CuS NPs at 100 μM (8 times the MIC) concentration had a negligible change in liver carboxylesterase and brain acetylcholinesterase activity (Fig. S11 and S12†). Notably, the fish exposed to 10 μM copper nanoparticles died in 2 h, and there was a considerable reduction in the CES and AchE activity (Fig. S11 and S12†). This result clearly suggests that CuNPs are highly toxic, whereas CuS NPs are non-toxic.Furthermore, the hemocompatibility of CuS NPs was studied by exposing the NPs to human red blood cells (RBC). As shown in Fig. 9, CuS NPs (100 μM) do not induce any adverse change in RBC morphology (Fig. 9B) and the membrane is intact, like that of the control cells (Fig. 9A). However, RBC treated with NH4Cl are wrinkled (Fig. 9C) and undergo lysis to release hemoglobin, indicating that the membranes are damaged (inset of Fig. 9C). At the same time, no hemoglobin is released from the cells treated with CuS NPs (Fig. 9B and S13†), demonstrating intrinsic biocompatibility with human RBCs. These results suggest that NLTA-CuS NPs are quite safe and have excellent antibacterial activity against Gram-positive and Gram-negative bacteria.
3. Materials and methods
3.1. Materials
Copper chloride, hydrazine, ammonium hydroxide and sodium sulfide were obtained from Merck, India. Tyramine, laurylchloride, resazurin, dichlorofluorescein diacetate, acridine orange, ethidium bromide, 5,5′-dithiobis(2-nitrobenzoic acid), acetylcholine iodide, and naphthyl ethylenediamine hydrochloride were purchased from Sigma, India. N-Lauryltyramine (NLTA) was synthesized as per the reported protocol.7 All microbiological media were obtained from Himedia, India. Escherichia coli (MTCC723), Aeromonas hydrophila (MTCC1739T), Staphylococcus aureus (MTCC3160) and Bacillus subtilis (MTCC441) were obtained from the Institute of Microbial Technology, India. The organisms were preserved at 4 °C and sub-cultured at regular intervals of 30 days. All other chemicals and reagents were of the highest analytical grade and commercially available.3.2. Synthesis of copper sulfide nanoparticles
To prepare CuS NPs, first, N-lauryltyramine (NLTA) capped copper nanoparticles were prepared according to the procedure described in ref. 7. In brief, 1 mg of NLTA dissolved in 100 μL of ethanol was added to 50 mL of 2.5 mM NaOH solution. Then, 1 mM of copper chloride and 200 μL of ammonium hydroxide were added to the solution. After 5 min of stirring at 600 rpm, 400 μL of hydrazine hydride was added to the solution, following which the blue solution changed color and turned reddish brown in 6 h. The obtained solution showed characteristic CuNP surface plasmon maximum at 580 nm. The as-obtained CuNPs were directly allowed to react with 1 mM sodium sulfide for 3 h until a green solution was obtained, which suggests the formation of CuS NPs. Then, NLTA-CuS NPs were dialyzed (MWCO: 3 kDa) against water for 24 h before final use. The shape, size, crystallinity and elemental composition of the CuS NPs were investigated via transmission electron microscopy (TEM) and energy dispersive X-ray spectroscopy (EDX). For TEM, an aqueous solution of CuS NPs was drop casted on a graphite grid and air dried prior to analysis with TEM (JEOL JEM-2100F), operating at an accelerating voltage of 200 kV. EDX was measured on an FEI Quanta FEG 200 high-resolution scanning electron microscope. For FTIR, NLTA and NLTA-CuS NPs were freeze dried and ground with KBr to form a pellet and measured in Perkin Elmer FTIR spectrometer with 1 cm−1 resolution.3.3. In vitro antibacterial activity of CuS NPs
Gram-negative (E. coli, A. hydrophila) and Gram-positive (S. aureus, B. subtilis) strains were used for the evaluation of antibacterial activity of CuS NPs. Bacterial cells were cultured aerobically for 12 h at 37 °C in Luria–Bertani (LB) medium. The cultures were maintained by streaking on LB agar plates and incubated at 37 °C for 24 h. Then, pure single colonies were isolated and subcultured every fortnight in a shaking incubator at 37 °C until an optical density of 0.5–0.6 at 660 nm (OD660 nm) was reached.To determine the minimum inhibitory concentration (MIC) of CuS NPs, 100 μL of CuS NPs (100 μM) was added to a 96-well plate and serially diluted and the final volume was made up to 100 μL using LB medium. Then, 100 μL of 1 × 10⁵ cfu mL−1 bacterial cells were seeded into each well and cultured under shaking for 24 h at 37 °C. The OD660 nm at each well was monitored using a Microtiter plate reader (Thermo Scientific Multiscan EX). Furthermore, cell viability was determined by adding 30 μL of resazurin solution (0.01% wt/vol.) to each well and cultured for 2 h at 37 °C.45 The wells with viable cells showed color change from blue to pink and exhibited strong fluorescence. The fluorescence intensity in each well was monitored using a fluorescence microplate reader (Biotech, synergy H1, Japan), setting the excitation and emission at 530 nm and 580 nm, respectively. The efficacy of CuS NPs was further judged by the zone of inhibition (ZOI) assay. Log-phase bacteria cells were swabbed uniformly on LB agar plates using sterile cotton swabs. Wells of 10 mm diameter were made on the plates using gel puncture. Using a micropipette, 50 μL of 5 μM, 10 μM and 100 μM CuS NPs were added to the respective wells and incubated at 37 °C for 24 h. The formation of the zone around the well confirms the antibacterial activity of CuS NPs.
3.4. Evaluation of therapeutic efficacy of CuS NPs in zebrafish
To test the therapeutic efficacy, healthy zebrafish were infected with bacteria and then treated with CuS NPs. Zebrafish were kept in aerated glass tanks containing tap water at 25 ± 2 °C and the infection was initiated through injecting bacterial cells into the fish body (details in ESI†).46 The optimized bacterial dosage for intramuscular infection was 0.1 OD660 nm. About 10 adult zebrafish were intramuscularly injected with 10 μL of freshly prepared bacterial culture (0.1 OD660 nm) and allowed to survive with the infection for the next 3 h. Then, the fish were divided into two groups, each group containing five fish. Fish in group A were labeled as infected controls and those in group B were treated by injecting 10 μL of CuS NPs (10 μM). In another method of treatment, group B fish were treated by exposing the intramuscular infected zebrafish to a water bath containing 10 μM CuS NPs. Mortality of the fish was monitored carefully for 48 h. All experiments were performed in compliance with the CPCSEA guidelines for Laboratory Animal Facilities (Central Act 26 of 1982) and approved guidelines prescribed by the Institutional Animal Ethics Committee (IAEC, SASTRA University, India).The infection in the fish tissue was analyzed by colony forming unit (cfu) counting. Typically, fish were sacrificed (anesthetized by 150 mM MS-222 and euthanized by decapitation) at particular time intervals and the muscle tissue was dissected and homogenized in 1 mL of PBS buffer (10 mM phosphate, 150 mM NaCl, pH −7.4). The homogenate was diluted 10−4 times and plated in triplicate on sterile LB agar plates and incubated at 37 °C for 24 h and the bacterial colonies formed were counted and reported.
3.5. Scanning electron microscopy imaging
The changes in the bacterial morphology of the control (buffer treated) and CuS NP treated cells were analyzed via scanning electron microscopy (SEM) (Tescan Vega 3). For SEM sample preparation, bacteria (1 × 10⁵ cfu mL−1) incubated with 10 μM CuS NPs for 12 h were collected by centrifugation at 6000 rpm for 3 min and fixed with 2.5% glutaraldehyde overnight at 4 °C. After washing three times with PBS, the bacterial cells were dehydrated through sequential treatment with different percentage of ethanol for 15 min. Then, cells were stained with gold sputtering for 35 s and imaged using SEM.3.6. Membrane integrity study
The membrane integrity was evaluated by acridine orange (AO)/ethidium bromide (EB) double staining test.47 Briefly, bacteria (1 × 10⁵ cfu mL−1) incubated with 10 μM CuS NPs for 12 h were collected by centrifugation at 6000 rpm for 3 min at 4 °C and dual stained with AO/EB for 2 h in the dark. After that, 10 μL of the samples was placed on a glass slide with a coverslip and imaged under a fluorescence microscope (Nikon Eclipse). Green and red filters were used for AO and EB, respectively.3.7. Reactive oxygen species (ROS) test
The generation of ROS was quantitatively estimated using dichlorofluorescein diacetate (DCFH2-DA) assay.48 Typically, bacteria (1 × 10⁵ cfu mL−1) incubated with different concentrations of CuS NPs for 12 h were collected by centrifugation at 6000 rpm for 15 min at 4 °C and washed three times with PBS buffer. The pellet was re-suspended in 1 mL PBS buffer and incubated with 100 μM DCFH2-DA for 30 min. After that, the cells were lysed with an alkaline solution, and the supernatant was collected by centrifugation at 6000 rpm for 10 min. The fluorescence intensity of the supernatant was measured in a fluorescence spectrophotometer using a 485 nm excitation wavelength and a 525 nm emission wavelength (JASCO spectrofluorometer FP-8200). Bacterial cells treated with 10 μM hydrogen peroxide served as the positive control and untreated cells were considered as the negative control. The percent changes in fluorescence are expressed as follows:| % = [(sample − negative control)/(positive control − negative control)] × 100 | (1) |
The generation of ROS was qualitatively imaged under a fluorescence microscope. First, E. coli (Gram-negative) and B. subtilis (Gram-positive) (1 × 10⁵ cfu mL−1) were incubated with 10 μM CuS NPs at 37 °C for 12 h. Then, the bacterial solutions were mixed with 100 μM DCFH2-DA and incubated for 30 min in the dark. After that, 10 μL of the samples was placed on a glass slide with a cover-slip and observed under a fluorescence microscope using a green filter.
3.8. Lipid peroxidation assay
The production of ROS might damage the membranes and generate malondialdehyde (MDA). Thiobarbituric acid (TBA) assay was used to determine the MDA in the culture media.49 Briefly, an aliquot of 1 mL of bacteria culture treated with CuS NPs was collected and mixed with 10% trichloroacetic acid. Then, 0.67% of TBA was added and incubated at 95 °C for 1 h. The reaction mixture was cooled to room temperature and subjected to centrifugation at 6000 rpm for 15 min. The absorbance of the supernatant was measured at 532 nm. Untreated cells and cells treated with 10 μM hydrogen peroxide served as negative and positive controls, respectively. The percent of MDA production was determined according to eqn (1).3.9. Reduced glutathione (GSH) assay
Excess generation of ROS may reduce intracellular concentration of GSH. GSH levels in the cells after treatment with CuS NPs (0–10 μM) were estimated by 5-5′-dithiobis(2-nitrobenzoic acid) (DTNB) assay.50 Briefly, the cells were collected after NP treatment and lysed with 10% TCA solution for 15 min on ice. About 200 μL of cell lysate was then mixed with 1800 μL of Tris buffer (30 mM, pH 8.3) and 100 μL of 0.1% DTNB solution and incubated for 90 min in the dark at room temperature. The absorbance was monitored at 412 nm. Untreated cells and cells treated with 10 μM hydrogen peroxide served as negative and positive controls, respectively. The total GSH level was estimated according to eqn (1).3.10. Evaluation of toxicity
In vivo toxicity of CuS NPs was evaluated in a zebrafish model. Liver enzyme (carboxylesterase) and brain enzyme (acetylcholinesterase, AchE) were assayed.17 In a typical procedure, adult zebrafish were injected with 10 μL of 10 μM and 100 μM CuS NPs and mortality, if any, was examined for a period of 48 h. Fish injected with PBS served as controls. After 48 h, fish from the control and NP treated groups were sacrificed and dissected carefully to collect liver and brain tissues. Then, the tissues were immediately homogenized in 1 mL of ice-cold PBS buffer and centrifuged at 10![[thin space (1/6-em)]](https://www.rsc.org/images/entities/char_2009.gif) 000 rpm for 10 min at 4 °C. The obtained supernatant was used in further studies.
000 rpm for 10 min at 4 °C. The obtained supernatant was used in further studies.
Acetylcholinesterase assay was performed according to Ellman degradation protocol.51 Briefly, 100 μL of brain homogenate was diluted with 900 μL of PBS buffer and mixed with 50 μL of 10 mM DTNB solution. Then, 50 μL of 12.5 mM of acetylthiocholine iodide was added and incubated at 30 °C. After 5 min, the reaction mixture turned yellow and the absorbance at 400 nm was measured on an ELISA plate reader (Thermo Scientific Multiscan EX). The activity was expressed as acetylcholine hydrolyzed per min.
The activity of α-carboxylesterase and β-carboxylesterase was determined according to previously reported procedure.17 Briefly, 200 μL of liver homogenate was diluted with 800 μL of PBS buffer and mixed with 5 μL of 250 mM of α-napthylacetate or β-napthylacetate and incubated at room temperature. After 30 min, 250 μL of freshly prepared 0.3% Fast blue B in 3.3% SDS was added to the reaction mixture, leading to the development of dark blue color. After 30 min, the absorbance of the blue color solution was measured at 430 nm and 588 nm for α- and β-carboxylesterase, respectively. The amount of α- and β-carboxylesterase was determined using the standard values and was reported as mM of α- and β-napthol released per min. All toxicity assays were performed in duplicate.
3.11. Hemocompatibility test
Biocompatibility of CuS NPs was investigated on red blood cells (RBC). In this work, human whole blood samples were collected by a trained doctor from volunteers in compliance with the institutional guidelines. Informed consent was obtained from the volunteers. Citrate stabilized blood samples were centrifuged at 6000 rpm for 3 min and washed with PBS buffer. The collected RBC were resuspended in 10 mL of PBS buffer and used in further studies. About 100 μL of RBC was mixed with 100 μM CuS NPs and incubated at 37 °C and 200 rpm for 30 min. The morphological changes in RBC were evaluated by placing 10 μL of the cells on a non-grease glass slide and visualized under a microscope. In addition, the treated RBC and controls were centrifuged at 3000 rpm and the absorbance of the supernatant was noted. RBC mixed with 100 μM NH4Cl and PBS served as positive and negative controls, respectively. All samples were prepared in triplicate at the same time.4. Conclusions
In summary, the zebrafish animal model was adopted to understand the therapeutic efficacy of CuS NPs. Zebrafish infected with Gram-positive and Gram-negative bacteria were successfully treated with a medicated bath of CuS NPs. Treatment with CuS NPs depleted the infectious bacteria from the fish body within 24 h and completely cured them of the infection. Scanning electron microscopy imaging and fluorescence dye study confirmed that CuS NPs kill bacteria through membrane damage and CuS NPs trigger excess production of ROS, mediating oxidative damage over the GSH defense. Liver carboxylesterase and brain acetylcholinesterase activity of zebrafish remained unaffected even in the presence of high concentration of CuS NPs. Hemolytic assay confirmed that CuS NPs are hemocompatible. Being safer, further study with a rodent model would enable NLTA-CuS NPs for advanced clinical testing.Acknowledgements
We thank Dr Thiagarjan for zebrafish toxicity study. We thank DST-FIST (SR/FST/ETI-331/2013) for fluorescence microscopy facility and the central research facility (R&M/0021/SCBT-007/2012-13), SASTRA University for the infrastructure.References
- A. K. Thabit, J. L. Crandon and D. P. Nicolau, Expert Opin. Pharmacother., 2015, 16, 159–177 CrossRef CAS PubMed.
- B. D. Lushniak, Public Health Rep., 2014, 129, 314–316 CrossRef PubMed.
- K. S. Kaye and J. M. Pogue, Pharmacotherapy, 2015, 35, 949–962 CrossRef CAS PubMed.
- R. J. Fair and Y. Tor, Perspect. Med. Chem., 2014, 6, 25–64 Search PubMed.
- J. A. Lemire, J. J. Harrison and R. J. Turner, Nat. Rev. Microbiol., 2013, 11, 371–384 CrossRef CAS PubMed.
- K. P. Miller, L. Wang, B. C. Benicewicz and A. W. Decho, Chem. Soc. Rev., 2015, 44, 7787–7807 RSC.
- A. Raghunath and E. Perumal, Int. J. Antimicrob. Agents, 2017, 49, 137–152 CrossRef CAS PubMed.
- D. Liang, Z. Lu, H. Yang, J. Gao and R. Chen, ACS Appl. Mater. Interfaces, 2016, 8, 3958 CAS.
- Z. Lu, K. Rong, J. Li, H. Yang and R. Chen, J. Mater. Sci.: Mater. Med., 2013, 24, 1465 CrossRef CAS PubMed.
- J. Li, K. Rong, H. Zhao, F. Li, Z. Lu and R. Chen, J. Nanosci. Nanotechnol., 2013, 10, 6806–6813 CrossRef.
- S. Wang, Q. Li, F. Chen, J. Ke and R. Chen, Adv. Powder Technol., 2017, 28, 1332–1339 CrossRef CAS.
- Z. Dai, F. Qin, H. Zhao, J. Ding, Y. Liu and R. Chen, ACS Catal., 2016, 6, 3180–3192 CrossRef CAS.
- F. Qin, H. Zhao, G. Li, H. Yang, J. Li, R. Wang, Y. Liu, J. Hu, H. Sun and R. Chen, Nanoscale, 2014, 6, 5402 RSC.
- X. Zhong, Z. Dai, F. Qin, J. Li, H. Yang, Z. Lu, Y. Liang and R. Chen, RSC Adv., 2015, 5, 69312 RSC.
- Y. Jia, S. Zhan, S. Ma and Q. Zhou, ACS Appl. Mater. Interfaces, 2016, 8, 6841 CAS.
- A. A. Khan Behlol, S. Megarajan, P. Suresh Kumar and V. Anbazhagan, Sens. Actuators, B, 2016, 233, 431–437 CrossRef.
- U. S. Dharsana, M. K. N. Sai Varsha, A. A. Khan Behlol, V. Anbazhagan and R. Thiagarajan, RSC Adv., 2015, 5, 30248–30259 RSC.
- L. Rene Christena, V. Mangalagowri, P. Pradheeba, K. B. Ayaz Ahmed, B. I. Sandhiya Shalini, M. Vidyalakshmi, V. Anbazhagan and N. Sai Subramanian, RSC Adv., 2015, 5, 12899–12909 RSC.
- S. Megarajan, M. Vidhyalakshmi, A. A. Khan Behlol, M. Vandhith, B. R. S. Niranjani, N. Saisubramanian and V. Anbazhagan, RSC Adv., 2016, 6, 87513–87522 RSC.
- Z. G. Cheng, S. Z. Wang, Q. Wang and B. Y. Geng, CrystEngComm, 2010, 12, 144–149 RSC.
- H. Lee, S. W. Yoon, E. J. Kim and J. Park, Nano Lett., 2007, 7, 778–784 CrossRef CAS PubMed.
- Y. X. Zhao and C. Burda, Energy Environ. Sci., 2012, 5, 5564–5576 CAS.
- R. Cai, J. Chen, J. X. Zhu, C. Xu, W. Y. Zhang, C. M. Zhang, W. H. Shi, H. T. Tan, D. Yang, H. H. Hng, T. M. Lim and Q. Y. Yan, J. Phys. Chem. C, 2012, 116, 12468–12474 CAS.
- A. Šetkus, A. Galdikas, A. Mironas, I. Šimkiene, I. Ancutiene, V. Janickis, S. Kačiulis, G. Mattogno and G. M. Ingo, Thin Solid Films, 2001, 391, 275–281 CrossRef.
- S. Goel, F. Chen and W. Cai, Small, 2014, 10, 631–645 CrossRef CAS PubMed.
- G. Ku, M. Zhou, S. Song, Q. Huang, J. Hazle and C. Li, ACS Nano, 2012, 6, 7489–7796 CrossRef CAS PubMed.
- Y. Huang, Y. Lai, S. Shi, S. Hao, J. Wei and X. Chen, Chem.–Asian J., 2015, 10, 370–376 CrossRef CAS PubMed.
- H. Y. Wang, X. W. Hua, F. G. Wu, B. Li, P. Liu, N. Gu, Z. Wang and Z. Chen, ACS Appl. Mater. Interfaces, 2015, 7, 7082–7092 CAS.
- S. Yu, J. Liu, W. Zhu, T. Hu, T. T. Lim and X. Yan, Sci. Rep., 2015, 5, 16369 CrossRef CAS PubMed.
- F. N. Oktar, M. Yetmez, D. Ficai, A. Ficai, F. Dumitru and A. Pica, Curr. Top. Med. Chem., 2015, 15, 1583–1588 CrossRef CAS PubMed.
- J. Ai, E. Biazar, M. Jafarpour, M. Montazeri, A. Majdi, S. Aminifard, M. Zafari, H. R. Akbari and H. G. Rad, Int. J. Nanomed., 2011, 6, 1117–1127 CAS.
- I. Linkov, F. K. Satterstrom and L. M. Corey, Nanomedicine, 2008, 4, 167–171 CrossRef CAS PubMed.
- W. Ye, S. Abel, E. Andreas and L. Dusan, J. Mater. Chem. B, 2015, 3, 7153–7172 RSC.
- C. A. MacRae and R. T. Peterson, Nat. Rev. Drug Discovery, 2015, 14, 721–731 CrossRef CAS PubMed.
- J. Barriuso, R. Nagaraju and A. Hurlstone, Clin. Cancer Res., 2015, 21, 969–975 CrossRef CAS PubMed.
- A. R. Willis, C. Moore, M. Mazon-Moya, S. Krokowski, C. Lambert, R. Till, S. Mostowy and R. E. Sockett, Curr. Biol., 2016, 26, 3343–3351 CrossRef CAS PubMed.
- I. H. Jain, L. Zazzeron, R. Goli, K. Alexa, S. Schatzman-Bone, H. Dhillon, O. Goldberger, J. Peng, O. Shalem, N. E. Sanjana, F. Zhang, W. Goessling, W. M. Zapol and V. K. Mootha, Science, 2016, 352, 54–61 CrossRef CAS PubMed.
- E. Tomaszewska, K. Soliwoda, K. Kadziola, B. Tkacz-Szczesna, G. Celichowski, M. Cichomski, W. Szmaja and J. Grobelny, J. Nanomater., 2013, 2013, 313081 Search PubMed.
- J. S. Kim, E. Kuk, K. N. Yu, J.-H. Kim, S. J. Park, H. J. Lee, S. H. Kim, Y. K. Park, Y. H. Park, C.-Y. Hwang, Y. K. Kim, Y. S. Lee, D. H. Jeong and M. H. Cho, Nanomedicine, 2007, 3, 95–101 CrossRef CAS PubMed.
- S. Chernousova and M. Epple, Angew. Chem., Int. Ed., 2013, 52, 1636–1653 CrossRef CAS PubMed.
- C. Carlson, S. M. Hussain, A. M. Schrand, L. K. B. Stolle, K. L. Hess, R. L. Jones and J. J. Schlager, J. Phys. Chem. B, 2008, 112, 13608–13619 CrossRef CAS PubMed.
- L. Masip, K. Veeravalli and G. Georgiou, Antioxid. Redox Signaling, 2006, 8, 753–762 CrossRef CAS PubMed.
- C. D. Vecitis, K. R. Zodrow, S. Kang and M. Elimelech, ACS Nano, 2010, 4, 5471–5479 CrossRef CAS PubMed.
- B. Ramalingam, T. Parandhaman and S. K. Das, ACS Appl. Mater. Interfaces, 2016, 8, 4963–4976 CAS.
- S. D. Sarker, L. Nahar and Y. Kumarasamy, Methods, 2007, 42, 321–324 CrossRef CAS PubMed.
- M. N. Neely, J. D. Pfeifer and M. Caparon, Infect. Immun., 2002, 70, 3904–3914 CrossRef CAS PubMed.
- K. Liu, P. C. Liu, R. Liu and X. Wu, Med. Sci. Monit. Basic Res., 2015, 21, 15–20 CrossRef PubMed.
- B. Kalyanaraman, V. Darley-Usmar, K. J. Davies, P. A. Dennery, H. J. Forman, M. B. Grisham, G. E. Mann, K. Moore, L. J. Roberts II and H. Ischiropoulos, Free Radical Biol. Med., 2012, 52, 1–6 CrossRef CAS PubMed.
- Y. J. Garcia, A. J. Rodríguez-Malaver and N. Peñaloza, J. Neurosci. Methods, 2005, 144, 127–135 CrossRef CAS PubMed.
- A. E. Cribb, J. S. Leeder and S. P. Spielberg, Anal. Biochem., 1989, 183, 195–196 CrossRef CAS PubMed.
- M. Benabent, E. Vilanova, M. Á. Sogorb and J. Estévez, MethodsX, 2014, 1, 258–263 CrossRef PubMed.
Footnote |
| † Electronic supplementary information (ESI) available: Zeta and particle size analysis, turbidimetry, all bacterial colony count assay, toxicology. See DOI: 10.1039/c7ra05636b |
| This journal is © The Royal Society of Chemistry 2017 |

