 Open Access Article
Creative Commons Attribution 3.0 Unported Licence
Engineered ferritin nanocages as natural contrast agents in magnetic resonance imaging
V. Nandwana†
 ab,
S.-R. Ryoo†
 ab,
S. Kanthalaab,
A. Kumaref,
A. Sharmad,
F. C. Castroa,
Y. Liac,
B. Hoffmand,
S. Lim
 ef and
V. P. Dravid
 *abc
*abc
aDepartment of Materials Science & Engineering, Northwestern University, Evanston, Illinois 60208, USA. E-mail: v-dravid@northwestern.edu
bInternational Institute for Nanotechnology (IIN), Evanston, IL 60208, USA
cApplied Physics Program, Northwestern University, Evanston, IL 60208, USA
dDepartment of Chemistry, Northwestern University, Evanston, IL 60208, USA
eSchool of Chemical and Biomedical Engineering, Nanyang Technological University, 637459, Singapore
fNTU-Northwestern Institute for Nanomedicine, Nanyang Technological University, 637553, Singapore
First published on 12th July 2017
Abstract
We report the development of a self-assembling protein nanocage as a contrast agent for magnetic resonance imaging (MRI). The protein nanocage is derived from genetically engineered ferritin from Archaeoglobus fulgidus (AfFtnAA). Iron (Fe) was loaded in a controlled manner within the core of the ferritin nanocage, resulting in the formation of iron oxide magnetic nanostructures (MNS). Using a variety of structural and magnetic characterization methods, we have demonstrated the magnetic and domain structures of the MNS formed within the protein nanocage and their contribution on water proton relaxation in MRI. With the primary focus on cardiac imaging for identification of atherosclerotic lesion, macrophage cell line was chosen for in vitro studies. The cytocompatibility of Fe-loaded engineered ferritin nanocages ((Fe)AfFtnAA) was confirmed by cell viability and oxidative stress measurements. The ferritin nanocages were successfully internalized by macrophage cells in a dose dependent manner and visualized under MRI. The drop in relaxation time with increasing concentration validated their potential as a contrast agent in MRI. Enhanced uptake and diagnostic capability in MRI of Fe-loaded ferritin nanocages imply their use as a “natural” probe for targeting and imaging plaque macrophages.
1. Introduction
Magnetic resonance imaging (MRI) is a non-invasive diagnostic imaging technique that offers the ability to obtain anatomic and metabolic/functional information of tissues with high spatial and temporal resolution.1,2 Due to the growing concern about radiation exposure of positron emission tomography (PET), single-photon emission computed tomography (SPECT) and computed tomography (CT), MRI is being considered a preferred method in clinical diagnosis.3 The MRI technique is based on the water proton spin relaxation as it is abundant in the tissues. When external magnetic field is applied, water protons align in the direction of magnetic field. Application of the radio-frequency (RF) pulse perturbs the alignment. Subsequently, the protons relax back to the applied magnetic field direction, and magnetostatic energy released during this process is used to record MR images. Relaxation process occurs via two independent relaxation mechanism: longitudinal (T1) and transverse (T2) relaxation, generating T1-weighted and T2-weighted MR images, respectively. The difference in water proton density and local chemical environment of tissues within and between organs results in intrinsic contrast in MR images. However, intrinsic contrast due to poor signal to noise (S/N) ratio is not sufficient to differentiate the tissues from neighbouring ones. Therefore, contrast agents are used to enhance the resolution and contrast of MR images.A good contrast agent should have high relaxivity for either T1- or T2-weighted imaging, favorable pharmacokinetics and biodistribution, biodegradability, and biocompatibility. Though, gadolinium (Gd) based contrast agents have been widely accepted as T1 contrast agents in MRI, they suffer from limited sensitivity (due to insufficient S/N ratio) and potential cytotoxicity.4,5 Recent studies have shown that the use of Gd-based contrast agents may lead to systemic nephronic fibrosis, particularly in patients with acute or chronic renal insufficiency or renal dysfunction.6 Magnetic nanostructures (MNS) based on superparamagnetic iron oxide and metal ferrite nanoparticles have been explored as T2 contrast agents; an alternative and/or complementary to the Gd-based T1 contrast agents. MNS based contrast agents show significantly higher relaxivity and biocompatibility than gadolinium-based complexes.7–9 However, clinical use of MNS based contrast agents has been limited due to translational hurdles such as signal sensitivity, biodistribution, and pharmacokinetics.10–12
A variety of biologically-derived nanomaterials such as ferritin have been proposed as molecular imaging platforms.13–16 Ferritin is an iron storage protein found in most living systems. It is a self-assembled spherical cage-like structure composed of 24 subunits of polypeptide chains with an internal cavity of 8 nm.17 Since the subunits are gene products, the structure and size of ferritin nanocage is precisely controlled at the atomic level. The internal cavity of ferritin can be loaded with small molecules or metal ions.18,19 As the ferritin is naturally size-constraint, they have been used as a template to synthesize monodispersed nanoparticles.20,21 Moreover, the surface of ferritin can be modified either chemically or genetically for targeted delivery.14,22–26 Iron oxide nanoparticles loaded ferritin has been proposed as a potential diagnostic platform with enhancing contrast in MRI.27–29 While the ferritin exterior provides the advantages for translational studies like biocompatibility, biodegradability and possible weak or no immune response, diagnostics makes use of the enhanced localized MR contrast via iron oxide core. However, the relaxivity of the iron oxide loaded ferritin is two order lower than synthetic nanoparticles based contrast agents.30 The poor contrast enhancement of ferritin is due to a lack of fundamental knowledge about the formation mechanism of iron oxide core. Through understanding such mechanism(s), ferritin-based contrast agents with improved relaxivity can be rationally designed.
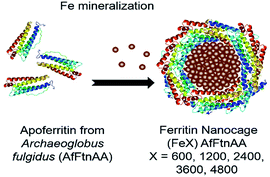
We report the development of a biomimetic platform technology for enhancing contrast in MRI. We have used genetically engineered ferritin from Archaeoglobus fulgidus (AfFtnAA) to produce nanocages that have a slower iron release rate,31 higher iron loading capacity (up to 7200 Fe atoms per cage),22 and higher thermal stability (up to 70 °C) compared to the wild type of ferritin.31 The ferritin nanocages were used as template to load Fe atoms, resulting in formation of magnetic nanostructures (MNS) within their 8 nm core (Scheme 1). By precisely controlling the Fe loading during nanocage formation,22,31,32 ferritin nanocages with tunable Fe amount were obtained and denoted by (FeX)AfFtnAA where X = 0, 600, 1200, 2400, 3600, and 4800 Fe atoms per cage. We have performed in-depth structural, magnetic, and biocharacterization to understand the mechanism of MNS formation within the core of the protein nanocage and their contribution on water proton relaxation in MRI. Macrophage cell line was chosen as a model for in vitro studies with the focus on imaging of atherosclerotic lesions that are generally rich in lipid-laden macrophages.33–35 Biocompatibility of ferritins were confirmed by cell viability and oxidative stress measurements. The drop in relaxation time with increasing concentration validated their potential as a contrast agent in MRI. The ferritin nanocages were internalized by macrophage cells and were successfully visualized via MRI, implying ferritins may serve as a probe for targeting and imaging plaque macrophages.
2. Results and discussion
2.1. Structural and magnetic characterization of ferritin nanocages
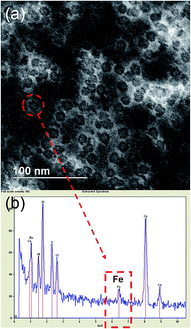
In order to develop ferritin nanocages as MRI contrast agents, the basic structural characterization is required to find out the phase of Fe in the ferritin core. In natural ferritin, Fe forms Fe(O)OH core which is amorphous and have lower magnetization compared to other form of iron oxides such as maghemite (γ-Fe2O3) or magnetite (Fe3O4) that results in poor contrast enhancement.36,37 To characterize the phase of Fe in the ferritin core, we have used several characterization techniques and have found that Fe in the ferritin core is present as a mixture of maghemite (γ-Fe2O3) or magnetite (Fe3O4).Transmission Electron Microscopy (TEM) was done to obtain the size of the core and protein shell. Uranyl acetate was used as a negative stain that clearly showed the well-defined shell structure of ferritins. The size of the core was 8 nm while the overall size of ferritin nanocages was found to be 12 nm (Fig. 1a). Electron Dispersive X-ray (EDX) spectrum on one of the ferritins showing a Fe peak confirmed the presence of Fe in the ferritin nanocage core (Fig. 1b).
Electron energy loss spectroscopy (EELS) is a powerful characterization method for determining the oxidation state of transition metals, including Fe, as any electron transitions from the 2p to 3d orbitals caused by the electron probe will result in distinct L3 and L2 edges. Changing d-orbital occupancy of the transition metal notably affects the L3![[thin space (1/6-em)]](https://www.rsc.org/images/entities/char_2009.gif) :
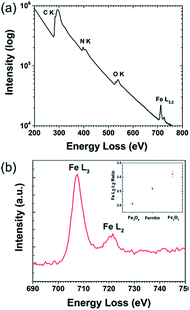
:![[thin space (1/6-em)]](https://www.rsc.org/images/entities/char_2009.gif) L2 intensity ratio, which can be used to determine average oxidation state compared to standard samples. Fig. 2a shows the overall (Fe4800)AfFtnAA EELS spectrum, with an inset high-resolution TEM (HRTEM) image showing the Fe clusters in the (Fe4800)AfFtnAA particles. Although the carbon film substrate contributes to most of the carbon K edge signal, significant Fe L3,2 signal was acquired from the Fe clusters in addition to nitrogen K and oxygen K signal from the (Fe4800)AfFtnAA. Fig. 2b specifically shows the fine structure of the Fe L3 and L2 edges of (Fe4800)AfFtnAA. The L3
L2 intensity ratio, which can be used to determine average oxidation state compared to standard samples. Fig. 2a shows the overall (Fe4800)AfFtnAA EELS spectrum, with an inset high-resolution TEM (HRTEM) image showing the Fe clusters in the (Fe4800)AfFtnAA particles. Although the carbon film substrate contributes to most of the carbon K edge signal, significant Fe L3,2 signal was acquired from the Fe clusters in addition to nitrogen K and oxygen K signal from the (Fe4800)AfFtnAA. Fig. 2b specifically shows the fine structure of the Fe L3 and L2 edges of (Fe4800)AfFtnAA. The L3![[thin space (1/6-em)]](https://www.rsc.org/images/entities/char_2009.gif) :
:![[thin space (1/6-em)]](https://www.rsc.org/images/entities/char_2009.gif) L2 intensity ratio was determined by fitting the EELS background with a standard power-law fit, followed by background subtraction, integrating the intensity of the FWHM of both edges, and dividing to find the ratio. The Fe L3
L2 intensity ratio was determined by fitting the EELS background with a standard power-law fit, followed by background subtraction, integrating the intensity of the FWHM of both edges, and dividing to find the ratio. The Fe L3![[thin space (1/6-em)]](https://www.rsc.org/images/entities/char_2009.gif) :
:![[thin space (1/6-em)]](https://www.rsc.org/images/entities/char_2009.gif) L2 ratio was also calculated from EELS spectra of standard Fe3O4 and Fe2O3 samples to compare to ferritin, and the results can be seen in the inset of Fig. 2b. The calculations show that the L3
L2 ratio was also calculated from EELS spectra of standard Fe3O4 and Fe2O3 samples to compare to ferritin, and the results can be seen in the inset of Fig. 2b. The calculations show that the L3![[thin space (1/6-em)]](https://www.rsc.org/images/entities/char_2009.gif) :
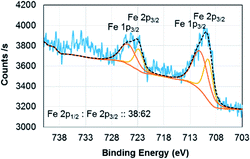
:![[thin space (1/6-em)]](https://www.rsc.org/images/entities/char_2009.gif) L2 ratio of (Fe4800)AfFtnAA (∼2.6) falls between that of Fe3O4 (∼2.1), which has a mix of Fe2+ and Fe3+, and Fe2O3 (∼3.1) that has iron in a 3+ state. These results suggest that the ensemble of ferritin particles consist of Fe in both Fe2+ and Fe3+ states, but more trivalent Fe particles are present. Similar results were found from XPS which show 62% of Fe3+ and 38% of Fe2+ in the (Fe4800)AfFtnAA core (Fig. 3). These values were different than Fe3O4 nanoparticles that showed 45% of Fe3+ and 55% Fe2+, indicating higher % of Fe3+ might have contributed to the formation of Fe2O3 phase in addition of Fe3O4 phase.
L2 ratio of (Fe4800)AfFtnAA (∼2.6) falls between that of Fe3O4 (∼2.1), which has a mix of Fe2+ and Fe3+, and Fe2O3 (∼3.1) that has iron in a 3+ state. These results suggest that the ensemble of ferritin particles consist of Fe in both Fe2+ and Fe3+ states, but more trivalent Fe particles are present. Similar results were found from XPS which show 62% of Fe3+ and 38% of Fe2+ in the (Fe4800)AfFtnAA core (Fig. 3). These values were different than Fe3O4 nanoparticles that showed 45% of Fe3+ and 55% Fe2+, indicating higher % of Fe3+ might have contributed to the formation of Fe2O3 phase in addition of Fe3O4 phase.
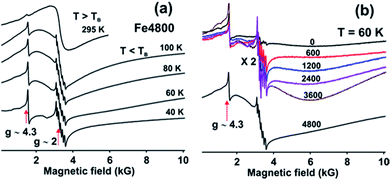
The magnetic nature of Fe3+ in the (Fe4800)AfFtnAA was characterized by Electron Paramagnetic Resonance (EPR) spectroscopy which shows that most of the Fe3+ incorporated into the nanocages forms the superparamagnetic nanocores (SPMNC) and is not present as loosely protein bound Fe3+. Fig. 4a shows EPR spectra of (Fe4800)AfFtnAA recorded at selected temperatures. There are two narrow features of the EPR spectra which are present at all temperatures: (a) the narrow sharp peak at g ∼ 4.3 which comprises a very small part of the total spectral intensity and is attributed to mononuclear Fe3+ in a site of near-rhombic symmetry,38,39 (b) the sharp six-line pattern observed around g ∼ 2 is due to a Mn2+ impurity which is observed even in the unloaded AfFtnAA (Fig. 4b).40 With increase of Fe loading (0–4800) (Fig. 4b), the contribution from Mn2+ does not increase monotonously, which rule out the possibility of “Fe loading” as potential source of Mn2+ impurity. The features from Fe3+ and Mn2+ gain intensity with the lowering of temperature as expected for paramagnetic complexes. These ions are not integrated into the nano-cores. The spectrum at T = 295 K shows a symmetric broad signal (line width peak to peak ∼ 1 kG) cantered around g ∼ 2, which is generally observed for superparamagnetic nanoparticle (SPMNP) above a characteristic temperature called the blocking temperature TB.41,42 SPMNP are magnetically ordered arrays in which the magnetization as a function of temperature undergoes rapid thermal fluctuations; if the characteristic time of these fluctuations is shorter than the experimental observation time, the nanocores show paramagnetic behaviour with large magnetic moment and give rise to the broad symmetric EPR spectra as observed at T = 295 K.42 At low temperatures, T = 100 K, the symmetric EPR spectrum seen at T = 295 K, is replaced by a much broader asymmetric line shape which is spread all over the magnetic field range starting from zero to 10 kG.42,43 This is attributed to the SPMNP below the blocking temperature TB.42 Below TB, the magnetization fluctuation time is equal to or greater than the experimental observation time which lead to a magnetically ordered weakly ferromagnetic state. SPMNC show weak ferromagnetism which is attributed to the misalignment of the antiferromagnetically arranged nanocages leading to a net magnetic moment. The magnetic anisotropy of the nanocages give rise to an asymmetric EPR spectra at low temperatures. As the temperature is lowered (T ≤ 40 K) further, the misalignment of the antiferromagnetic ordering fades away which lead to the reduction in the intensity of the EPR spectrum and probably at very low temperatures it disappears, which indicate complete antiferromagnetic ordering. The EPR spectra of the synthetic ferritin nanocages differ from those of natural ferritin loaded with Fe.42 The latter show coexistence of superparamagnetic and weakly ferromagnetic magnetic phases pointing to a distribution in the SPMNC size. However, for the genetically engineered ferritin which are used in this study, at no temperature do the EPR spectra show signatures of the coexistence of the two magnetic phases. Thus the temperature dependence of the EPR spectra for iron loaded AfFtnAA indicate that the core size distribution is much narrower than that for natural ferritin.
The AfFtnAA was loaded with various doses of Fe (0 to 4800) to test how Fe is incorporated into the core. Fig. 4b shows the EPR spectra of AfFtnAA with various Fe loading at T = 60 K. The sharp feature (at g = 4.3) due to mononuclear Fe does not increase appreciably with Fe loading indicating that majority of Fe is incorporated into the cages and not just loosely bound to the protein shells. For Fe loading of 600–3600, the EPR spectrum at T = 60 K is much broader (line width peak to peak 4000 G) and asymmetric compared to that at higher temperatures (see Fig. 1a, T = 295 K, where the line width is 1000 G) which could be explained with the existing understanding of SPMNP; that the EPR line width increases with lowering of temperature.44 The EPR intensity increases with increase in Fe loading indicating higher magnetic moment which arise from increase of SPMNC core-size. The spectrum for the Fe loading of 4800 is different; the ferritin nanocages have the maximum Fe core size and the core is well below the blocking temperature. To summarize, the EPR spectra of AfFtnAA with increasing Fe loading shows that indeed Fe is incorporating into cores of (Fe4800)AfFtnAA (Fig. 4b). The temperature-dependence of the EPR spectrum of (Fe4800)AfFtnAA (Fig. 4a) confirms that the nano cores are superparamagnetic in the vicinity of room temperature, that they are below the blocking temperature by 100 K, and that the cores have a much narrower size distribution than natural ferritin.
2.2. Contrast enhancement properties
In order to evaluate the potential of ferritin nanocages as contrast agents, r1 and r2 relaxivities were calculated of ferritin nanocages with different Fe loading ((FeX)AfFtnAA where X = 0, 600, 1200, 2400, 3600, and 4800). T1 and T2 relaxation times were calculated at the Fe concentrations ranging from 1 to 10 mM. Though there was no significant change in r1 relaxivity values, a clear trend was observed in r2 relaxivity of the iron-loaded ferritin nanocages (Fig. 5). For ferritin nanocages loaded with up to 2400 Fe atoms per cage, consistently low r2 value was observed. With increasing Fe atoms per cage (>2400), increase in r2 relaxivity was observed. The relaxivity data suggest the mechanism of MNS core formation into the ferritin nanocage (Fig. 5). For initial loading up to 2400 Fe atoms per cage, Fe atoms was conjugated to the ferritin shell and most of them did not participate in the core MNS formation. When loading was increased (3600 Fe atoms per cage), MNS superparamagnetic core formation started to result in slight increase in r2 relaxivity. At the highest loading (4800 Fe atoms per cage), superparamagnetic MNS core formed that resulted in 100% increase in r2 relaxivity. The r2 relaxivity values at the highest iron loading match with the previously reported relaxivity of ferritin.30,45 Though these r2 values are lower than that of chemically synthesized ferrite nanoparticles, it has been successfully used as a MRI contrast agents in several in vivo applications due to its “natural” framework and excellent biocompatibility.16,46,47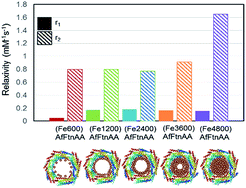 | ||
| Fig. 5 r1 and r2 relaxivity values of Fe-loaded AfFtnAA with different loadings (600 to 4800 Fe atoms per cage) and the hypothesized formation mechanism of superparamagnetic core. | ||
2.3. In vitro studies of ferritin nanocages
3. Experimental
3.1. Materials
RPMI-1640, and penicillin/streptomycin (10![[thin space (1/6-em)]](https://www.rsc.org/images/entities/char_2009.gif) 000 IU per mL and 10
000 IU per mL and 10![[thin space (1/6-em)]](https://www.rsc.org/images/entities/char_2009.gif) 000 mg mL−1, respectively) were purchased from Thermo Fisher Scientific. CellTiter 96 Aqueous One Solution Cell Proliferation Assay kit was purchased from Promega and the DCFDA Cellular ROS detection Assay Kit was from Abcam. The J774 and HepG2 cells were kindly provided by Prof. Colby Shad Thaxton in the Department of Urology, Northwestern University Feinberg School of Medicine.
000 mg mL−1, respectively) were purchased from Thermo Fisher Scientific. CellTiter 96 Aqueous One Solution Cell Proliferation Assay kit was purchased from Promega and the DCFDA Cellular ROS detection Assay Kit was from Abcam. The J774 and HepG2 cells were kindly provided by Prof. Colby Shad Thaxton in the Department of Urology, Northwestern University Feinberg School of Medicine.
3.2. Gene expression and protein purification
Engineered Archaeglobus fulgidus ferritin gene with point mutations at 150 and 151 positions (K150A/R151A) cloned in pET-11a vector (Novagen) was used to recombinantly express ferritin protein following previously described method.22 Escherichia coli BL21-CodonPlus® (DE3)-RIL was transformed with the engineered A. fulgidus ferritin (AfFtnAA) and plated on LB agar plate containing ampicillin and chloramphenicol antibiotics at 100 μg mL−1 and 50 μg mL−1, respectively. LB broth (containing both the antibiotics) was inoculated with an overnight culture incubated at 37 °C with shaking at 200 rpm. The gene overexpression was induced by the addition of 1 mM isopropyl β-D-thiogalactopyranoside (IPTG) at OD600 of 0.6–0.8 for 4 h. Cells were harvested by centrifugation at 4000 × g for 30 min and cell pellets were stored at −80 °C for further use. Cells pellets were resuspended in buffer A (25 mM HEPES, 50 mM NaCl, pH 7.5) and subjected to sonication for cell lysis. The cell lysate was subsequently heat treated at 85 °C for 10 min and the precipitated E. coli proteins were removed by ultracentrifugation at 150![[thin space (1/6-em)]](https://www.rsc.org/images/entities/char_2009.gif) 000 × g at 4 °C for 1 h. The AfFtnAA was purified in a single-step chromatography using an AKTA system (GE Healthcare). Ammonium sulfate at 0.5 M was added to the supernatant and was loaded onto hydrophobic interaction chromatography column (HiPrep 16/10 Phenyl FF; GE Healthcare) pre-equilibrated with buffer B (0.5 M ammonium sulfate, 25 mM HEPES, 50 mM NaCl, pH 7.5). AfFtnAA was eluted with buffer A. Purified protein was completely exchanged with buffer A using 10 kDa MWCO Amicon centrifugal filter (Millipore) and purity of the sample was confirmed using SDS-PAGE. Purified AfFtnAA was stored at 4 °C in buffer A and the concentration was measured using Bradford assay.
000 × g at 4 °C for 1 h. The AfFtnAA was purified in a single-step chromatography using an AKTA system (GE Healthcare). Ammonium sulfate at 0.5 M was added to the supernatant and was loaded onto hydrophobic interaction chromatography column (HiPrep 16/10 Phenyl FF; GE Healthcare) pre-equilibrated with buffer B (0.5 M ammonium sulfate, 25 mM HEPES, 50 mM NaCl, pH 7.5). AfFtnAA was eluted with buffer A. Purified protein was completely exchanged with buffer A using 10 kDa MWCO Amicon centrifugal filter (Millipore) and purity of the sample was confirmed using SDS-PAGE. Purified AfFtnAA was stored at 4 °C in buffer A and the concentration was measured using Bradford assay.
3.3. Iron loading into ferritin
A stock solution of 100 mM Fe(II) sulfate was freshly prepared in 0.1% HCl solution for loading iron into ferritin as previously described.53 For different iron loading, the required moles of the iron solution were added into ferritin protein in order to achieve (FeX)AfFtnAA (X = 600, 1200, 2400, 3600, 4800 iron per protein cage). To overcome ferritin precipitation due to high local concentration, the stock iron solution was added drop-wise and protein concentration was kept in between 0.2 to 0.3 mg mL−1 ferritin in 100 mM HEPES, 50 mM NaCl, and pH 7.5 buffer. After addition, samples were incubated at room temperature for 1 h and at 4 °C overnight. Unbound iron was removed using desalting column (High Prep 26/10; GE Healthcare) and the protein was concentrated using 100 kDa MWCO Amicon filter (Millipore). Finally, the iron amount in ferritin samples was measured with ICP-MS.3.4. Electron paramagnetic resonance (EPR)
EPR experiments were carried out using Bruker ESP300 X-band (MW frequency 9. 4 GHz) spectrometer at different temperatures (40 to 100 K, 300 K). Temperatures below 77 K were reached and varied using oxford instruments helium continuous flow cryostat, and temperature controller. The sample solutions (200 μL) were loaded into the EPR tube and flash frozen into liquid nitrogen before EPR measurements.3.5. Electron energy loss spectroscopy (EELS)
EELS characterization of the ferritin samples was carried out on a JEOL 2100 transmission electron microscope (TEM) operating at 200 kV and equipped with a Gatan Enfina EELS spectrometer. EELS was conducted in TEM mode in order to have a larger probe size, improving the signal to noise ratio and effectively providing EELS spectra averaged over dozens of ferritin particles. A spectrometer entrance aperture with a collection angle of approximately 14 mrad was used. TEM samples were prepared by preparing a dilute solution (5 μg mL−1 Fe) of ferritin particles and directly drop-casting the sample onto a TEM grid with a complete carbon film.3.6. Relaxivity measurements
Apoferritin and ferritin nanocages were dispersed in water were diluted to [Fe] ranging from 1 to 10 mM. T2 relaxation times were determined at 3.0 T Magnetom Verio (Siemens Healthcare, Erlangen, Germany) using the multiple-echo-fast-spin-echo sequence. Multiple echo spin echo sequence with TR = 1290 ms, 8 echo times starting with 9.9 to 79.2 ms, 160 mm FOV, 256 × 256 matrix, slice thickness 3 mm. Given that we had multiple samples with a distribution of T2 relaxation times, we had to limit range of echo times. A commercial 12 channel head coil (diameter ∼ 160 mm) was used. A 1.5 mL Eppendorf centrifuge tube was used as a sample holder. R2 maps were generated using a custom software using Matlab. The signal decay was fit to a single exponential function to estimate T2 on a pixel by pixel basis.3.7. Cell culture
J774 murine macrophage cell line and HepG2 human hepatocellular carcinoma cell line were cultured in RPMI-1640 medium containing 10% heat-inactivated fetal bovine serum (FBS), and penicillin/streptomycin (100 units per mL and 100 μg mL−1, respectively). Cells were maintained at 37 °C in a saturating humidity atmosphere containing 95% air and 5% CO2.3.8. Inductively coupled plasma-mass spectrometry (ICP-MS) analysis
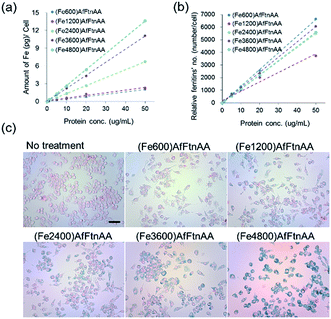
For ICP-MS analysis, J774 cells were plated in 6-well cell culture plate at 3 × 10⁶ cells per well one day before. In the next day, cells were exposed with different concentration range (0–50 μg mL−1) of protein samples for 24 h. Before analysis, cells were rinsed three times with DPBS buffer, trypsinized, and collected by using centrifugation. In each sample tube, 20 μL of solution were used for cell counting. Sample digestion was performed by adding nitric acid to each sample. The amounts of iron ion were determined by ICP-MS. Control sample without any proteins was prepared using the same protocol.3.9. Prussian blue staining
To visualize the iron ion within cells treated with protein samples, Prussian blue staining was performed. For staining, J774 cells were seeded in each well of 24-well culture plate. The following day, cells were incubated with protein samples at a concentration of 5 μg mL−1 for 24 h. Next, cells were rinsed with PBS buffer and fixed with 4% paraformaldehyde solution in PBS buffer. Cells were subsequently incubated with Prussian blue staining solution (a mixture of equal volume of 20% hydrochloric acid and 10% potassium ferrocyanide solution) for 30 min at room temperature, and counterstained with nuclear fast red for 5 min.3.10. Scanning transmission electron microscopy (STEM) and energy dispersive X-ray spectroscopy (EDS)
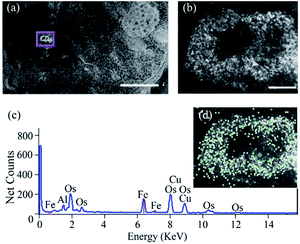
For the STEM sample preparation, the cells were gently scrapped from the flask bottom and fixed with 2.5% glutaraldehyde and 2% formaldehyde (EMS) in PBS for 20 min. The cell suspension was then centrifuged at 0.4g for 5 min to form a tight cell pellet. The pellet was further fixed overnight at 4 °C. OsO4 (EMS) at 1% was used for staining at room temperature for 1 h. Serial ethanol dehydration was performed followed by epoxy resin (EMS, EMBed-12) infiltration and curing at 60 °C. Sections of 150 nm-thick were prepared by ultramicrotome (FC7, Leica) and mounted onto a TEM mesh grid with formvar/carbon coating (FCF200-CU, EMS). In STEM imaging and EDS acquisition, a scanning transmission electron microscope (HD2300, HITACHI) equipped with dual EDS detectors (Thermo Scientific) was employed for analysing ferritin uptake. The STEM was operated at 200 kV, and high angle annular dark field (HAADF) detector was used to generate Z-contrast images of the cellular ultrastructure. Sites with ferritin cages can be located by image intensity, and EDS mapping was conducted with an acquisition time of 20 s per frame to confirm distribution of the ferritin nanocages.3.11. In vitro MR imaging of cell pellets
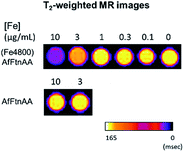
For MR imaging analysis, J774 cells were plated at 8 × 10⁶ cells per well in T75 flask with 70–80% of confluency overnight. Cells were cultivated with protein samples at various concentrations from 0 to 10 μg mL−1 for 24 h at 37 °C. The sample without any treatment was used as a control. The cell pellets were collected after brief rinse with PBS buffer and prepared without bubble for analysis. A T2-weighted MR phantom images were acquired from samples consisting of a set of glass Pasteur pipets having an equal number of cells (10 × 106). Images of the in vitro phantom were obtained by a spin-echo pulse sequence with the following acquisition parameters: TR/TE = 4000/5.7 ms, FOV = 23 × 23 mm2, matrix = 128 × 128, flip angle = 90°, slice thickness = 1 mm and number of slices = 6 by using 7 T Bruker Biospin MRI (Bruker Biospin, Billerica, MA).3.12. Cellular reactive oxidative assay
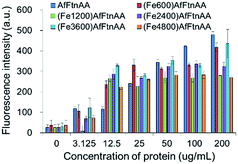
For the ROS measurement, the DCFDA cellular ROS detection assay kit was used according to the manufacture's instruction. For the assay, J774 murine macrophage cells with 25 × 103 cells were plated overnight in a black wall/clear bottom 96-well plate. After 24 h cells were washed briefly with 1× buffer (supplied as 10×), and the freshly prepared DCFDA was added to each well for 45 minutes for cell staining. Stained cells were again washed with 1× buffer, following the incubation with ferritin samples for 12 h. After incubation, cells were washed gently with 1× buffer/PBS and immediately fluorescence intensities were measured by using fluorescence microplate reader (Synergy 4, BioTek) with the excitation wavelength set at 485 nm and emission wavelength at 535 nm. Results were obtained as fluorescent intensity of each sample after background subtraction.3.13. Cell viability test
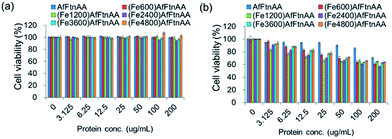
The effect of protein samples on cell viability was determined by MTS assay. For the assay, J774 and HepG2 cells were seeded at 20![[thin space (1/6-em)]](https://www.rsc.org/images/entities/char_2009.gif) 000 cells per well in 96-well plate. After 24 h, cells were incubated with ferritin samples at concentration ranging from 1 to 200 μg mL−1 for 24 h at 37 °C. Following ferritin incubation, cells were briefly washed with PBS and further treated with 20 μL of MTS stock solution into each well for additional 2 hour. MTS assay was used to evaluate the cell viability according to the protocol provided by the manufacturer (CellTiter 96 Aqueous One Solution Cell Proliferation Assay; Promega). The optical densities were recorded at 490 nm and background absorbance at 700 nm was subtracted. Cell viability was estimated as a percentage of the value of the untreated control.
000 cells per well in 96-well plate. After 24 h, cells were incubated with ferritin samples at concentration ranging from 1 to 200 μg mL−1 for 24 h at 37 °C. Following ferritin incubation, cells were briefly washed with PBS and further treated with 20 μL of MTS stock solution into each well for additional 2 hour. MTS assay was used to evaluate the cell viability according to the protocol provided by the manufacturer (CellTiter 96 Aqueous One Solution Cell Proliferation Assay; Promega). The optical densities were recorded at 490 nm and background absorbance at 700 nm was subtracted. Cell viability was estimated as a percentage of the value of the untreated control.
3.14. Statistical analysis
The unpaired two tailed student's t-test from GraphPad Prism software (La Jolla, CA, USA) was used to analyse data of cellular reactive oxidative species detection assay and cell viability assay. Statistical significance was considered for significant for P ≤ 0.05.4. Conclusion
In the present study, we proved the potential of protein-based contrast agent for MRI in an in-depth study by using structural, magnetic, and biological analyses. Ferritin is a ubiquitous endogenous iron storage protein which is composed of 24-meric shell and involved in the regulation of cellular iron level. We used the genetically modified form of ferritin which have a slower iron release rate, higher loading capacity (up to 7200 Fe atoms per cage), and higher stability compared to the wild-type ferritin. By loading a controlled amount of Fe, we demonstrated that the magnetic core was formed within the ferritin nanocage. Through the structural characterization, we found that the self-assembled and well-tuned shell-like structure was observed and the presence of the iron core was clearly identified inside protein nanocage as well. The direct effect of increased iron loading was observed on the superparamagnetic core formation and hence contrast enhancement for MR imaging. For the analysis of biological study, macrophage cell line was chosen as the target cell, since the imaging priority is the atherosclerotic plaque, which is lipid-laden macrophage-rich area, and to have the ferritin accumulate at the developing atherosclerotic lesion. In the biocompatibility assessment, it was exhibited that ferritin did not lead to cytotoxicity and induce ROS irrespective of the amount of iron loaded inside the protein nanocage, which shows a cytocompatible contrast agent. In vitro cellular uptake study showed that ferritin was internalized by macrophage cells and the uptake efficiency increased in a concentration-dependent manner. In addition, the increased MR contrast signal intensity was visualized from cell pellet with internalized ferritin nanocages, corroborating that ferritin can be highlighted as a potential platform for imaging of plaque macrophage cells with further conjugation of specific targeting moieties.Acknowledgements
V. Nandwana and S.-R. Ryoo contributed equally to this work. The authors gratefully acknowledge the support from NTU-NU Institute for Nanomedicine located at the International Institute for Nanotechnology, Northwestern University, USA and the Nanyang Technological University, Singapore. This work made use of the EPIC, Keck-II, and/or SPID facility(ies) of Northwestern University's NUANCE Center, which has received support from the Soft and Hybrid Nanotechnology Experimental (SHyNE) Resource (NSF ECCS-1542205); the MRSEC program (NSF DMR-1121262) at the Materials Research Center; the International Institute for Nanotechnology (IIN); the Keck Foundation; and the State of Illinois, through the IIN.Notes and references
- M. F. Kircher and J. K. Willmann, Radiology, 2012, 263, 633–643 CrossRef PubMed.
- J. K. Willmann, N. van Bruggen, L. M. Dinkelborg and S. S. Gambhir, Nat. Rev. Drug Discovery, 2008, 7, 591–607 CrossRef CAS PubMed.
- L. Schenkman, Science, 2011, 331, 1002–1004 CrossRef PubMed.
- P. Caravan, J. J. Ellison, T. J. McMurry and R. B. Lauffer, Chem. Rev., 1999, 99, 2293–2352 CrossRef CAS PubMed.
- S. Swaminathan, Magn. Reson. Imaging, 2016, 34, 1373–1376 CrossRef CAS PubMed.
- P. H. Kuo, E. Kanal, A. K. Abu-Alfa and S. E. Cowper, Radiology, 2007, 242, 647–649 CrossRef PubMed.
- V. Nandwana, S. R. Ryoo, S. Kanthala, M. De, S. S. Chou, P. V. Prasad and V. P. Dravid, ACS Appl. Mater. Interfaces, 2016, 8, 6953–6961 CAS.
- V. Nandwana, M. De, S. Chu, M. Jaiswal, M. Rotz, T. J. Meade and V. P. Dravid, in Cancer treatment and research, ed. C. A. Mirkin, T. J. Meade, S. Hurst Petrosko and A. H. Stegh, 2015, vol. 166, ch. Theranostic Magnetic Nanostructures (MNS) for Cancer, pp. 51–83 Search PubMed.
- M. De, S. S. Chou, H. M. Joshi and V. P. Dravid, Adv. Drug Delivery Rev., 2011, 63, 1282–1299 CrossRef CAS PubMed.
- Y. X. J. Wang, World J. Gastroenterol., 2015, 21, 13400–13402 CrossRef CAS PubMed.
- Y. X. Wang, Quant. Imag. Med. Surg., 2011, 1, 35–40 Search PubMed.
- M. R. Bashir, L. Bhatti, D. Marin and R. C. Nelson, J. Magn. Reson. Imag., 2015, 41, 884–898 CrossRef PubMed.
- M. Uchida, M. Terashima, C. H. Cunningham, Y. Suzuki, D. A. Willits, A. F. Willis, P. C. Yang, P. S. Tsao, M. V. McConnell, M. J. Young and T. Douglas, Magn. Reson. Med., 2008, 60, 1073–1081 CrossRef CAS PubMed.
- M. Terashima, M. Uchida, H. Kosuge, P. S. Tsao, M. J. Young, S. M. Conolly, T. Douglas and M. V. McConnell, Biomaterials, 2011, 32, 1430–1437 CrossRef CAS PubMed.
- E. Valero, S. Fiorini, S. Tambalo, H. Busquier, J. Callejas-Fernandez, P. Marzola, N. Galvez and J. M. Dominguez-Vera, J. Med. Chem., 2014, 57, 5686–5692 CrossRef CAS PubMed.
- D. P. Cormode, P. A. Jarzyna, W. J. M. Mulder and Z. A. Fayad, Adv. Drug Delivery Rev., 2010, 62, 329–338 CrossRef CAS PubMed.
- M. T. Klem, M. Young and T. Douglas, Mater. Today, 2005, 8, 28–37 CrossRef CAS.
- J. W. M. Bulte, T. Douglas, S. Mann, R. B. Frankel, B. M. Moskowitz, R. A. Brooks, C. D. Baumgarner, J. Vymazal and J. A. Frank, Invest. Radiol., 1994, 29, S214–S216 CrossRef CAS PubMed.
- J. W. M. Bulte, T. Douglas, S. Mann, R. B. Frankel, B. M. Moskowitz, R. A. Brooks, C. D. Baumgarner, J. Vymazal, M. P. Strub and J. A. Frank, J. Magn. Reson. Imag., 1994, 4, 497–505 CrossRef CAS PubMed.
- M. Allen, D. Willits, J. Mosolf, M. Young and T. Douglas, Adv. Mater., 2002, 14, 1562–1565 CrossRef CAS.
- J. Swift, C. A. Butts, J. Cheung-Lau, V. Yerubandi and I. J. Dmochowski, Langmuir, 2009, 25, 5219–5225 CrossRef CAS PubMed.
- B. Sana, E. Johnson, K. Sheah, C. L. Poh and S. Lim, Biointerphases, 2010, 5, Fa48–Fa52 CrossRef PubMed.
- T. Kitagawa, H. Kosuge, M. Uchida, M. M. Dua, Y. Iida, R. L. Dalman, T. Douglas and M. V. McConnell, Mol. Imaging Biol., 2012, 14, 315–324 CrossRef PubMed.
- M. Uchida, D. A. Willits, K. Muller, A. F. Willis, L. Jackiw, M. Jutila, M. J. Young, A. E. Porter and T. Douglas, Adv. Mater., 2009, 21, 458–462 CrossRef CAS.
- M. Uchida, M. L. Flenniken, M. Allen, D. A. Willits, B. E. Crowley, S. Brumfield, A. F. Willis, L. Jackiw, M. Jutila, M. J. Young and T. Douglas, J. Am. Chem. Soc., 2006, 128, 16626–16633 CrossRef CAS PubMed.
- E. G. Walsh, D. R. Mills, S. Lim, B. Sana, K. E. Brilliant and W. K. C. Park, J. Nanopart. Res., 2013, 15, 1409–1418 CrossRef.
- J. R. Charlton, V. M. Pearl, A. R. Denotti, J. B. Lee, S. Swaminathan, Y. M. Scindia, N. P. Charlton, E. J. Baldelomar, S. C. Beeman and K. M. Bennett, J. Nanomed. Nanotechnol., 2016, 12, 1735–1745 CrossRef CAS PubMed.
- K. L. Fan, C. Q. Cao, Y. X. Pan, D. Lu, D. L. Yang, J. Feng, L. N. Song, M. M. Liang and X. Y. Yan, Nat. Nanotechnol., 2012, 7, 459–464 CrossRef CAS PubMed.
- Y. Z. Zhao, M. M. Liang, X. Li, K. L. Fan, J. Xiao, Y. L. Li, H. C. Shi, F. Wang, H. S. Choi, D. F. Cheng and X. Y. Yan, ACS Nano, 2016, 10, 4184–4191 CrossRef CAS PubMed.
- K. M. Bennett, E. M. Shapiro, C. H. Sotak and A. P. Koretsky, Biophys. J., 2008, 95, 342–351 CrossRef CAS PubMed.
- B. Sana, E. Johnson, P. Le Magueres, A. Criswell, D. Cascio and S. Lim, J. Biol. Chem., 2013, 288, 32663–32672 CrossRef CAS PubMed.
- B. Sana, C. L. Poh and S. Lim, Chem. Commun., 2012, 48, 862–864 RSC.
- J. H. S. Pang, M. J. Jiang, Y. L. Chen, F. W. Wang, D. L. Wang, S. H. Chu and L. Y. Chau, J. Clin. Invest., 1996, 97, 2204–2212 CrossRef CAS PubMed.
- X. M. Yuan, Free Radical Res., 1999, 30, 221–231 CrossRef CAS PubMed.
- W. Li, L. H. Xu, C. Forssell, J. L. Sullivan and X. M. Yuan, Exp. Biol. Med., 2008, 233, 818–826 CrossRef CAS PubMed.
- Y. Piao, J. Kim, H. B. Na, D. Kim, J. S. Baek, M. K. Ko, J. H. Lee, M. Shokouhimehr and T. Hyeon, Nat. Mater., 2008, 7, 242–247 CrossRef CAS PubMed.
- G. H. Zhao, F. Bou-Abdallah, P. Arosio, S. Levi, C. Janus-Chandler and N. D. Chasteen, Biochemistry, 2003, 42, 3142–3150 CrossRef CAS PubMed.
- G. A. Clegg, J. E. Fitton, P. M. Harrison and A. Treffry, Prog. Biophys. Mol. Biol., 1980, 36, 56–86 CAS.
- J. S. Griffith, Mol. Phys., 1964, 8, 213–216 CrossRef CAS.
- J. A. Weil and J. R. Bolton, Electron paramagnetic resonance: elementary theory and practical applications, Wiley-Interscience, Hoboken N J, 2nd edn, 2007 Search PubMed.
- W. F. Brown, Phys. Rev., 1963, 130, 1677–1686 CrossRef.
- M. P. Weir, T. J. Peters and J. F. Gibson, Biochim. Biophys. Acta, 1985, 828, 298–305 CrossRef CAS.
- R. Berger, J. C. Bissey and J. Kliava, J. Phys.: Condens. Matter, 2000, 12, 9347–9360 CrossRef CAS.
- R. Berger, J. C. Bissey, J. Kliava, H. Daubric and C. Estournes, J. Magn. Magn. Mater., 2001, 234, 535–544 CrossRef CAS.
- K. M. Bennett, H. Zhou, J. P. Sumner, S. J. Dodd, N. Bouraoud, K. Doi, R. A. Star and A. P. Koretsky, Magn. Reson. Med., 2008, 60, 564–574 CrossRef PubMed.
- B. Iordanova and E. T. Ahrens, NeuroImage, 2012, 59, 1004–1012 CrossRef CAS PubMed.
- B. Iordanova, T. K. Hitchens, C. S. Robison and E. T. Ahrens, PLoS One, 2013, 8, e72720 CAS.
- Z. Zhang, N. Mascheri, R. Dharmakumar and D. Li, Cytotherapy, 2008, 10, 575–586 CrossRef CAS PubMed.
- S. H. Bakhru, E. Altiok, C. Highley, D. Delubac, J. Suhan, T. K. Hitchens, C. Ho and S. Zappe, Int. J. Nanomed., 2012, 7, 4613–4623 CrossRef CAS PubMed.
- M. Wabler, W. L. Zhu, M. Hedayati, A. Attaluri, H. M. Zhou, J. Mihalic, A. Geyh, T. L. DeWeese, R. Ivkov and D. Artemov, Int. J. Hyperthermia, 2014, 30, 192–200 CrossRef CAS PubMed.
- S. Singh, T. Shi, R. Duffin, C. Albrecht, D. van Berlo, D. Hohr, B. Fubini, G. Martra, I. Fenoglio, P. J. Borm and R. P. Schins, Toxicol. Appl. Pharmacol., 2007, 222, 141–151 CrossRef CAS PubMed.
- E. J. Park, J. Choi, Y. K. Park and K. Park, Toxicology, 2008, 245, 90–100 CrossRef CAS PubMed.
- X. Liu, W. Jin and E. C. Theil, Proc. Natl. Acad. Sci. U. S. A., 2003, 100, 3653–4365 CrossRef CAS PubMed.
Footnote |
| † These authors equally contributed to this work. |
| This journal is © The Royal Society of Chemistry 2017 |

