 Open Access Article
Creative Commons Attribution 3.0 Unported Licence
Pitting resistivity of Ni-based bulk metallic glasses in chloride solution
Khadijah M. Emran * and
Hanaa AL-Refai
Chemistry Department, College of Science, Taibah University, Al-Madinah Al-Monawarah, Saudi Arabia. E-mail: kabdalsamad@taibahu.edu.sa
First published on 27th July 2017
Abstract
Resistance of new Ni70Cr21Si0.5B0.5P8C≤0.1Co≤1Fe≤1 (VZ1) and Ni72.65Cr7.3Si6.7B2.15C≤0.06Fe8.2Mo3 (VZ2) glassy alloys to pitting corrosion was studied in 0.25 M sodium nitrate solution, with or without addition of chloride ions, using electrochemical impedance spectroscopy (EIS), cyclic polarization (CP) and electrochemical frequency modulation (EFM) techniques. Pitting and passivation potentials, corrosion current density and corrosion rate were analyzed relative to the chloride ion concentration. Focusing on the anodic part of the CP scan, the Ni-based glassy alloys in neutral solution acquired passive behavior before the onset of rapid alloy dissolution at the pitting potential. This potential was greatly reduced by the addition of Cl− ions. The aggressive ions led to a sharp increase of current at potentials significantly below the value required for pitting in the neutral medium and enhanced the formation and growth of the pits. A wider potential range free from pitting corrosion was observed for the VZ1 alloy. X-ray photoelectron spectroscopy (XPS), scanning electron microscopy (SEM), and atomic force microscopy (AFM) were conducted to assess the composition and morphology of the corrosion products and to provide supporting evidence for the electrochemical measurements.
1 Introduction
Bulk metallic glasses (BMGs) are considered to be the materials of the future because of their disordered atomic structure and the absence of grain boundaries.1,2 Ni-based glassy alloys are considered as one of the most important BMGs, having unique and unconventional characteristics.3 The Ni-based glassy alloy has a good corrosion resistance in natural fresh water, excellent resistance to corrosion in alkaline media, such as sodium and potassium hydroxide, and has been used in various fields.4 Ni–Cr-metalloid bulk glassy alloys, which exhibit superior corrosion resistance, have been studied in different aqueous media, including boiling 6N HNO3 with or without Cr6+ ions.5 They have also been intensively studied to further improve their corrosion resistance. For example, the formation of passive films on Ni82.3Cr7Fe3Si4.5B3.2 and Ni75.5Cr13Fe4.2Si4.5B2.8 in aqueous HCl and H3PO4 have been reported.6,7Ni–Cr-metalloid bulk glassy alloys, which exhibit superior corrosion resistance, have been studied in different aqueous media, including boiling 6N HNO3 with or without Cr6+ ions.5 They have also been intensively studied to further improve their corrosion resistance. For example, the formation of passive films on Ni82.3Cr7Fe3Si4.5B3.2 and Ni75.5Cr13Fe4.2Si4.5B2.8 in aqueous HCl and H3PO4 have been reported.6,7
It is generally acknowledged that pitting is the most common and most hazardous form of corrosion. It is very dangerous, widespread, and difficult to detect.8 The Cl− ion is more aggressive than other halide ions because of its smaller diameter. It is readily adsorbed on weak areas of the passive film, resulting in the initiation of pitting.9 Many studies of passivation and pitting corrosion resistance have been reported for Ni–Cr alloys in NaCl solution.10–14 These studies have shown that the presence of an inner barrier layer (Cr2O3) is a primary factor for enforcing passivity and that a higher Cr content in the alloy enhances resistance to pitting corrosion.
The primary goal of this study was to characterize the susceptibility/resistance of the new VZ1 and VZ2 alloys to pitting corrosion processes. The study combined electrochemical frequency modulation (EFM), electrochemical impedance spectroscopy (EIS) and cyclic polarization (CP) measurements with surface analytical measurements using X-ray photoelectron spectroscopy (XPS), scanning electron microscopy (SEM), and atomic force microscopy (AFM) techniques. Comparison of the results for the two alloys under identical conditions can yield additional information on the influence of Cr percentage in Ni-based glassy alloys (as an alloying element) on corrosion resistance.
2 Experimental
Two new Ni-based BMG alloys with nominal compositions (wt%) of Ni70Cr21Si0.5B0.5P8C≤0.1Co≤1Fe≤1 (VZ1) and Ni72.65Cr7.3Si6.7B2.15C≤0.06Fe8.2Mo3 (VZ2) were investigated in this work. These glassy alloys were produced by rapid solidification as ribbons of about 40–74.5 mm width and 25 μm thickness. The test electrolytes used in the study were 0.25 M NaNO3 solutions containing different concentrations (0.001, 0.01, 0.1, and 0.15 M) of NaCl, which were prepared from reagent grade chemical and double distilled water. All chemicals were obtained from Aldrich chemical company. The electrochemical measurements were performed in typical three-compartment glass cells containing three electrodes: the working electrode (WE), which was the alloy under study with a working area of 100 mm2; the counter-electrode (CE) was a platinum wire; the reference electrode (RE) was saturated Ag/AgCl. Electrochemical measurements were conducted on an Interface 1000™, Gamry Potentiostat/Galvanostat/ZRA analyzer. The potential of the examined alloy was recorded as a function of time over a period of 1 h until it had become stable. For EFM analysis the baseline frequency was 0.1 Hz, input frequencies of 2 and 5 Hz were used with amplitudes of 10 mV over 4 cycles, bandwidth was 0.1 < Δf (Hz) < 1.5 and the corrosion process under investigation was passive. The EIS measurements were performed over the range of 800 kHz (initial frequency) to 0.1 Hz (final frequency), 10 points per decade. A small, alternating current (e.g., 10 mV amplitude) was applied during the measurement to stimulate the current response from the alloy without affecting its performance. Cyclic polarization curves were obtained with a potential sweep rate of 1 mV s−1. The potential was swept from cathodic to anodic directions after the impedance run from −800 mV to 1200 mV.X-ray photoelectron spectroscopy (XPS) measurements were carried out using a monochromatic Al Kα X-ray source operating at 300 W (Kratos Axis Ultra DLD). The area of the analyzed surface was approximately 5 mm × 5 mm. Before analyses, the surfaces were cleaned by Ar+ sputtering and the survey spectra were collected at a fixed analyzer pass energy of 160 eV.
The surface condition and chemical composition of the alloys surface after cyclic polarization were examined using a JEOL JSM-6000 scanning electron microscope (SEM). AFM measurements were carried out in contact mode with a constant scanning forces adjusted to 225 nN (10−9 N), a scanned area of 5 × 5 μm and resolution of 256 × 256 pixels.
3 Results and discussion
3.1 Impedance measurements after chloride addition
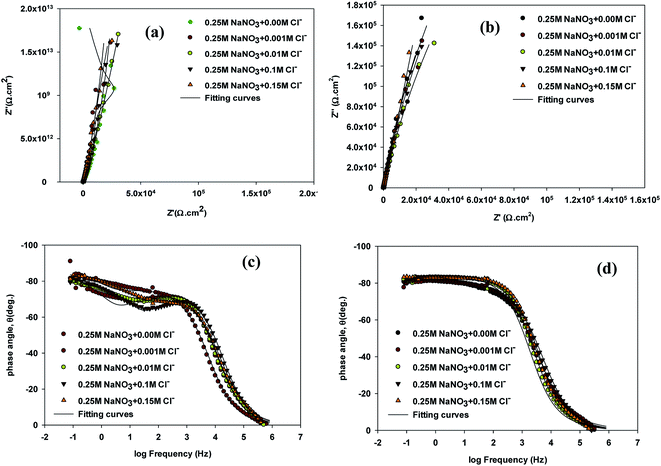
To investigate the impact of chloride ion on passive film thickness and susceptibility of VZ1 and VZ2 alloys to pitting corrosion in neutral solution in the passive potential range, different quantities concentrations (0.001, 0.01, 0.1, and 0.15 M) of NaCl were added to 0.25 M NaNO3 solution at 27 °C after exposure duration of 1 h in test solution. The impedance plots for VZ1 and VZ2 alloys are shown in Fig. 1. As can be observed in Fig. 1a and b, similar complex impedance plots were obtained for VZ1 and VZ2 alloys at different concentrations, except for VZ1 in 0.25 M NaNO3 alone, which was characterized by a straight capacitive upwards line that turned left towards negative values. This extended from intermediate frequencies down to the low frequency range corresponding to the passivation process.15 There was only one slight deviation from a straight capacitive line at the high frequency range, indicating a fast charge transfer process at the metal/solution interfaces. The capacitive arc at low frequencies resulted from the diffusion through the porous surface film, which is a characteristic property of a passive surface. Moving towards the high frequency region, another small capacitive loop was observed, corresponding to a fast charge transfer process. The impedance plots for VZ2 alloy (Fig. 1a) were not substantially different from those of VZ1 alloy (Fig. 1b), but the passive film resistance of the VZ1 alloy was higher than that of the VZ2 alloy. This indicated that the different proportions of alloying elements (7.3% Cr and 8.2% Fe) decreased the impedance but did not change other aspects of the passivation behavior.Bode plots exhibited two time constants, as shown in Fig. 1c and d. The capacitive loop in the high frequency region represents the electric charge transfer process. The second capacitive loop in the low frequency region is associated with a diffusion processes through the corrosion products and inside the pits.16
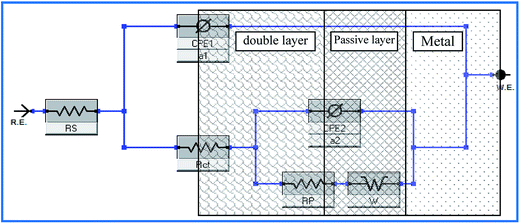
To interpret electrochemical behavior, the electrical circuit shown in Fig. 2 was used with a smallest error of fit of about χ2 (10−3) and a circuit description code (CDC) of Rs(Q1[Rct(Q2(RfW))]). The circuit model consisted of a parallel combination of a capacitor, Q1(CPE1), and a charge transfer resistor, Rct, in series with a resistor, Rs, representing the solution resistance. Another combination (Q2(RfW)) of a passive film capacitor, Q2(CPE2), passive film resistance, Rf, and a Warburg impedance, W, representing the diffusion process, was included. The relevance of the use of diffusion/migration impedance to describe the passive film system has been demonstrated.17 Fitted experimental data are plotted as solid lines in Fig. 1, and the values of the fitting parameters are presented in Table 1. The general trend for both two alloys for the variation of the values of the charge transfer resistance (Rct), which is inversely proportional to the constant phase elements (CPE1) of the double layer, with NaCl molar concentration was to decrease over the whole concentration range (0.001–0.15 M), Table 1. There was no indication of a critical concentration, suggesting that the chloride ion caused pitting corrosion. The polarization resistance of the inner barrier layer Rf was in the kΩ cm2 range for VZ1 alloy in all media investigated, with a maximum value of 5.75 kΩ cm2 at 0.001 M NaCl and a minimum value of 2.96 kΩ cm2 at 0.15 M NaCl.
| Alloys | Con. NaCl, M | Rct, Ω cm2 | CPE1, Q1 × 10−5, Ω−1 cm−2 sn1 | n1 | Rf, Ω cm2 | CPE2, Q2 × 10−5, Ω−1 cm−2 sn2 | n2 |
|---|---|---|---|---|---|---|---|
| VZ1 | 0.0 | 3.40 × 10⁸ | 1.03 | 0.88 | 2.42 × 10⁵ | 2.31 | 0.90 |
| 0.001 | 8.84 × 10⁷ | 1.37 | 0.83 | 5.76 × 10³ | 3.54 | 0.82 | |
| 0.01 | 9.94 × 10⁶ | 1.23 | 0.84 | 3.05 × 10³ | 3.59 | 0.86 | |
| 0.1 | 9.87 × 10⁶ | 1.25 | 0.83 | 3.98 × 10³ | 3.63 | 0.82 | |
| 0.15 | 8.70 × 10⁶ | 1.29 | 0.81 | 2.96 × 10³ | 4.37 | 0.78 | |
| VZ2 | 0.0 | 1.67 × 10⁸ | 1.36 | 0.93 | 3.86 × 10⁵ | 1.01 | 0.69 |
| 0.001 | 7.06 × 10⁷ | 1.10 | 0.93 | 5.01 × 10³ | 2.91 | 0.90 | |
| 0.01 | 1.37 × 10⁷ | 1.19 | 0.89 | 3.08 × 10³ | 8.96 | 0.98 | |
| 0.1 | 3.74 × 10⁶ | 1.50 | 0.89 | 5.26 × 10³ | 7.96 | 0.90 | |
| 0.15 | 4.49 × 10⁵ | 1.66 | 0.88 | 4.99 × 10³ | 0.89 | 0.90 |
The Rct values for the VZ2 alloy were lower than those measured for the VZ1 alloy because the passive layer could not cover the whole VZ2 alloy surface when the specimen was exposed in neutral solutions. The corrosion rate of the surface covered by the passive layer was lower than that of the surface without the passive layer (localized corrosion).18 This clearly indicates that the morphology of the surface film microstructure is the crucial factor affording VZ1 alloy better intrinsic resistance to corrosion in chloride solutions. The Rct values for both alloys in 0.25 M NaNO3 containing different concentrations of Cl− were several orders of magnitude lower, Table 1, than the values obtained for chloride-free solution, implying high corrosion behavior due to the severely corrosive nature of the Cl− ion.
3.2 Cyclic polarization (CP) measurements after chloride addition
The cyclic polarization data recorded after immersing the VZ1 and VZ2 alloys for 1 h in 0.25 M NaNO3 or for 1 h in 0.25 M NaNO3 + 0.15 M NaCl are presented in Fig. 3a and b and in Fig. 3c and d, respectively. Table 2 shows an irregular shift of the corrosion potential (Ecorr) for VZ1 toward more positive values, associated with increased corrosion current density, at higher Cl− ion concentration. Comparatively, the corresponding values for the VZ2 alloy were almost unchanged (≤2 mV vs. Ag/AgCl). In addition, values of icorr for VZ1 increased as the Cl− concentration increased, but were still lower than the icorr values for the VZ2 alloy because the higher Cr content (21%) confers resistance to the corrosive action of Cl− ions. Consequently, the dissolution process is slow. Focusing on the anodic part of the cyclic polarization scan, passive behavior was observed for all samples before the onset of rapid alloy dissolution at break down potential (pitting potential, Epit). At Epit, the current rises sharply and stable pits begin to grow. Between Epit and the repassivation or protection potential (Erep), no new pits develop. Initiation and propagation of pits continued until the reverse potential scan reached the repassivation potential, Erep, at which point the pits were repassivated. Below Erep pits do not continue to grow.19,20 These pits will not initiate at Ecorr because the repassivation potential (Erep) is more noble than the corrosion potential.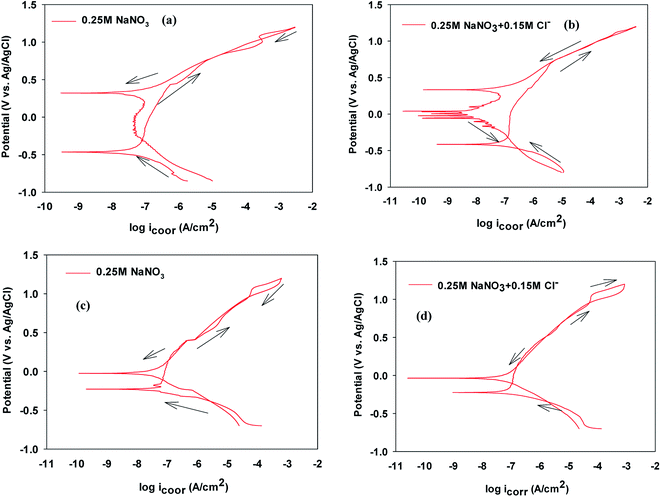 | ||
| Fig. 3 Cyclic polarization curves of VZ1 and VZ2 alloys in the absence and presence of NaCl at 27 °C. | ||
| Alloys | Con. NaCl, M | EFM | CP | ||||||||
|---|---|---|---|---|---|---|---|---|---|---|---|
| icorr, μA cm−2 | −βc, mV per decade | Corrosion rate × 10−3, mmpy | CF-2 | CF-3 | −Ecorr, mV | icorr, μA cm−2 | −βc, mV per decade | Epit, mV | Erep, mV | ||
| VZ1 | 0.0 | 0.08 | 120 | 1.40 | 1.40 | 2.64 | 465 | 0.02 | 110 | 447 | 1045 |
| 0.001 | 0.14 | 110 | 2.11 | 1.19 | 2.37 | 453 | 0.02 | 111 | 192 | 1051 | |
| 0.01 | 0.19 | 119 | 26.6 | 1.57 | 2.02 | 400 | 0.04 | 112 | 160 | 1020 | |
| 0.1 | 0.43 | 122 | 30.2 | 1.46 | 2.16 | 440 | 0.04 | 116 | 131 | 1001 | |
| 0.15 | 0.49 | 120 | 32.3 | 1.23 | 2.47 | 415 | 0.09 | 114 | 131 | 1043 | |
| VZ2 | 0.0 | 0.09 | 59 | 1.50 | 1.89 | 2.98 | 231 | 0.03 | 80 | 231 | 980 |
| 0.001 | 0.15 | 56 | 2.57 | 1.19 | 2.37 | 225 | 0.04 | 71 | 187 | 1010 | |
| 0.01 | 0.35 | 56 | 36.4 | 1.67 | 2.34 | 223 | 0.04 | 75 | 143 | 1010 | |
| 0.1 | 0.35 | 65 | 39.2 | 1.46 | 2.46 | 222 | 0.05 | 72 | 41 | 980 | |
| 0.15 | 0.68 | 63 | 39.6 | 1.78 | 2.47 | 220 | 0.07 | 76 | 34 | 966 | |
The potential difference (Epit − Erep) can be used as an approximate measure of the hysteresis loop area, where smaller potential differences represent better resistance of the alloy to pitting corrosion.21 Higher values of the potential difference (Epit − Ecorr) exhibit a wider potential range free of pitting corrosion under these conditions.22
As can be seen in Fig. 4a, in the absence of NaCl the hysteresis loop area (Epit − Erep) value for VZ1 alloy was about 597.20 mV vs. Ag/AgCl, compared to a value of 750 mV vs. Ag/AgCl for VZ2 alloy in 0.25 M NaNO3. These values increased gradually for both alloys when NaCl was added to the neutral solutions, reflecting the better pitting corrosion resistance of VZ1 alloy. In addition, the potential range free of pitting corrosion for the VZ1 alloy curve (Epit − Ecorr) was wider than that of the VZ2 alloy. The values were 913.30 mV vs. Ag/AgCl for VZ1 and 461.6 mV vs. Ag/AgCl for VZ2 alloy in chloride-free solution. This confirms that the degree of corrosion was lower in VZ1 alloy compared to VZ2 alloy because the higher proportion of Cr (21%) increased resistance to pitting corrosion. The potential range decreased gradually as the Cl− ion concentration increased. These results indicate that the susceptibility of the alloys to pitting corrosion at higher chloride ion concentrations is due to Cl− ion aggravating the conditions for formation and growth of pits.23 The Cl− ion is more aggressive than other halide ions due to its smaller diameter and consequent ability to more readily penetrate the passive film.9
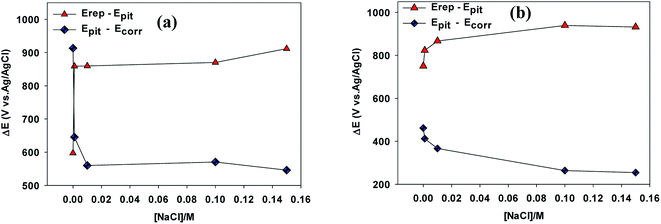 | ||
| Fig. 4 Variation of the different ranges defined between Ecorr, Epit and Erep as a function of Cl− ion concentrations for VZ1 and VZ2 alloys at 27 °C. | ||
The linear relationships between Epit values and Cl− ion concentration on the cyclic polarization curves for VZ1 and VZ2 alloys are shown in Fig. 5a and b. It can be seen that Epit shifted to more negative values (active direction) for both alloys and decreased logarithmically as the chloride ion concentration increased, according to eqn (1):24
Epit = a + b![[thin space (1/6-em)]](https://www.rsc.org/images/entities/char_2009.gif) log log![[thin space (1/6-em)]](https://www.rsc.org/images/entities/char_2009.gif) CCl− CCl−
| (1) |
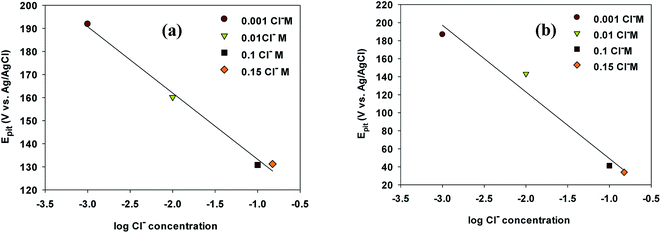 | ||
| Fig. 5 Pitting potential of Ni-base glassy alloys in 0.25 M NaNO3 at varying concentrations of NaCl for VZ1 and VZ2 alloys at 27 °C. | ||
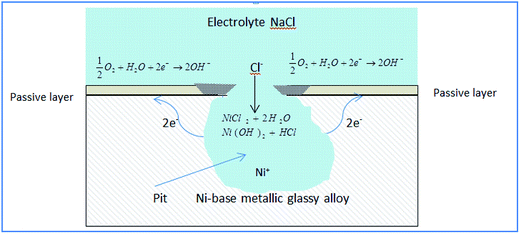
Passive film breakdown and pit initiation can be explained by an adsorption mechanism. During adsorption, pits initiate at weak sites of the passive film where Cl− ions displace oxygen and form soluble metal–anion complexes. This enhances transfer into the electrolyte leading to local thinning of the passive film until complete film removal.9 The alloy surface is exposed to the electrolyte and a galvanic cell is produced in which the base elements in the alloy act as the anode and the passive layer acts as the cathode.
Fig. 6 shows a propagating pit (actively growing) in the Ni-based glassy alloy/NaCl solution system.
According to Fig. 6, anodic reactions within the pit are described by (eqn (2)):
| Ni → Ni+2 + 2e− | (2) |
The electrons flow to the cathode (passivated surface) where they are consumed in the cathodic reaction (eqn (3)):
 | (3) |
As a result of cathodic and anodic reactions, the electrolyte within the pit acquires positive charge while the electrolyte surrounding the pit becomes negatively charged. The positively charged pit attracts negative chloride ions and soluble metal–anion complexes are formed eqn (4):
| NiCl2 + 2H2O → Ni(OH)2 + HCl | (4) |
The reaction between Ni2+ and water increases the acidity of the electrolyte inside the pit, accelerating the corrosion process, and the corrosion products that form around the pit separate its electrolyte.23
3.3 Electrochemical frequency modulation (EFM) measurements
Based on the data presented in Table 2, the VZ1 alloy exhibited outstanding corrosion resistance, having low corrosion rate values (<0.02 mmpy (ref. 25)) at Cl− ion concentrations of 0.001 and 0.01 M. At Cl− ion concentrations of 0.1 and 0.15 M, it exhibited excellent corrosion resistance (0.02–0.1 mmpy (ref. 25)). The VZ2 alloy at 0.001 M Cl− ion concentration exhibited outstanding corrosion resistance (<0.02 mmpy (ref. 25)), whereas it exhibited excellent corrosion resistance (0.02–0.1 mmpy (ref. 25)) at NaCl concentrations ranging from 0.001 to 0.15 M.It should be noted that the calculated values of icorr obtained by EFM were higher than the values obtained from the polarization measurements. It is quite easy for the perturbation frequency in this Ni-based glassy alloy/NaCl solution system to be too high, which will cause excessive capacitive behavior of the electrochemical double layer on the current response and result in polarization resistance that is too low and a corrosion rate that is too high.26 To avoid the capacitive influence, the frequency should be as low as possible. The causality factors were determined and found to be very close to the theoretical values according to EFM theory. Sometimes, deviation in causality factor values can be due to high resistivity of the studied alloy. The three different electrochemical techniques showed similar behavior.
3.4 Morphological and structural characterizations
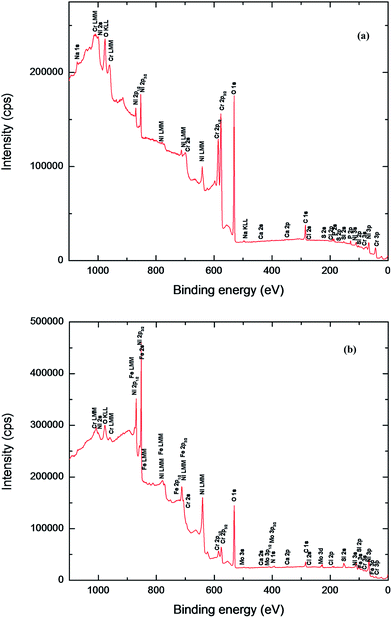 | ||
| Fig. 7 XPS survey spectra of Ni-based glassy alloys in 0.25 M NaNO3 solution at 27 °C; (a) VZ1 alloy, (b) VZ2 alloy. | ||
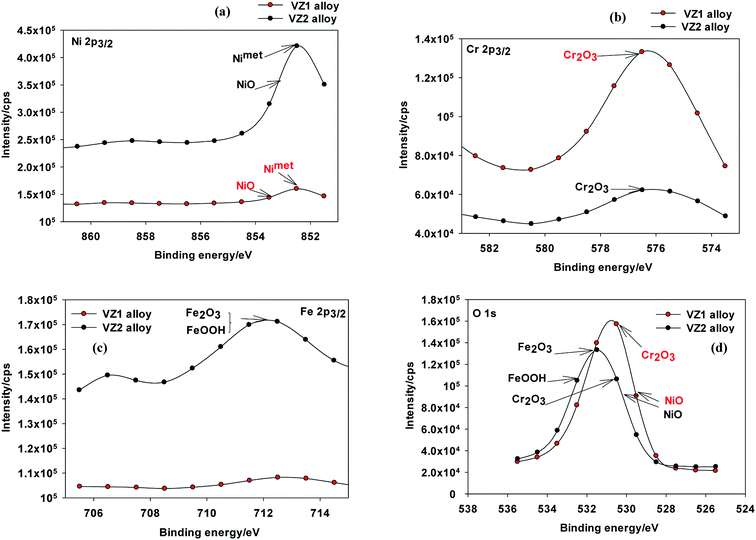 | ||
| Fig. 8 XPS spectra of passive films formed on Ni-based glassy alloys in 0.25 M NaNO3 solution at 27 °C; (a) Ni 2p3/2, (b) Cr 2p3/2, (c) Fe 2p3/2, and (d) O 1s. | ||
The strong BE peaks found at 711.6 eV in the Fe 2p3/2 spectra (Fig. 8c) can be assigned to trivalent iron compounds such as Fe2O3 and/or FeOOH.30 The analysis of the O 1s spectra (Fig. 8d) can be separated into four distinct components. The peak at about 529.9 eV corresponds to the binding energy of NiO and the peak at 530.3 eV may be due to the oxygen atom bonded to Cr3+ in the various chromium oxides.10 The peak at 531.3 eV is due to O2−, which confirms the presence of an oxygen atom bonded to Fe3+ in Fe2O3. The peak observed at 532.7 eV is attributed to an OH− group bonded to Fe3+ in FeOOH.30 Passive films on the VZ1 alloy may be different in structure and composition compared to the passive films formed on VZ2 alloy. The passive films on Ni–Cr alloys are reported to be composed of Cr2O3 and NiO. Jabs et al.31 reported that the passive films formed on Ni–(20, 34)Cr alloys in 1 M NaOH solution had a duplex layered structure composed of inner Cr2O3 and outer NiO layers. Boudin et al.32 also proposed a duplex layered structure with inner Cr2O3 and outer Ni(OH)2 or Ni oxyhydroxide layers for the passive films formed on Ni–(5.6–27.3)Cr alloys in pH 9.2 borate solution. As mentioned above and according to XPS analyses of Ni–Cr alloys,11,13,33 passive films formed on VZ1 alloy are commonly described by a duplex layer of Cr2O3/NiO, while passive films on VZ2 alloy are considered to be composed of NiO, Cr2O3, Fe2O3, and FeOOH.
4. Conclusion
Two Ni-based bulk metallic glasses, with nominal compositions of Ni70Cr21Si0.5B0.5P8C≤0.1Co≤1Fe≤1 (VZ1) and Ni72.65Cr7.3Si6.7B2.15C≤0.06Fe8.2Mo3 (VZ2), were studied in aqueous 0.25 M sodium nitrate solution with and without addition of chloride ion. EIS analysis revealed that the VZ1 alloy exhibited higher corrosion resistance compared to the VZ2 alloy. This was attributed to the formation of passive films with a duplex structure composed of an outer porous layer at high frequency and an inner compact barrier layer of Cr2O3 at lower frequency. Enhanced corrosion of Ni-based glassy alloys occurred at higher Cl− ion concentrations, since the potential range of passivity was shortened and both the pitting (Epit) and repassivation (Erep) potentials became less noble. VZ1 alloy showed a relatively lower value of passive current density and a smaller anodic hysteresis loop area compared to VZ2 alloy in neutral chloride media. This was due to the higher Cr content (21%), which enhances Cr2O3 formation. Alloying elements are very important factors to stabilize an alloy against localized corrosion. The presence of Cr (21%) leads to increased corrosion resistance for nickel-based glassy alloys. It accumulates in the passive layer as Cr2O3 or oxyhydroxide.Acknowledgements
The authors would like to thank Dr Hartmann Thomas from Vacuumschmelze GmbH for providing the specimens.References
- E. Axinte, Mater. Des., 2012, 35, 518–556 CrossRef CAS.
- J. P. Chu, J. Jang, J. Huang, H. Chou, Y. Yang, J. Ye, Y. Wang, J. Lee, F. Liu and P. Liaw, Thin Solid Films, 2012, 520, 5097–5122 CrossRef CAS.
- Y. Zeng, C. Qin, N. Nishiyama and A. Inoue, J. Alloys Compd., 2010, 489, 80–83 CrossRef CAS.
- H. Kim, D. Mitton and R. Latanision, Corros. Sci., 2010, 52, 801–809 CrossRef CAS.
- C. Qin, K. Asami, H. Kimura, W. Zhang and A. Inoue, Electrochim. Acta, 2009, 54, 1612–1617 CrossRef CAS.
- S. Arab and K. Emran, Phys. Chem. News, 2009, 50, 130–138 CAS.
- S. T. Arab, K. M. Emran and H. A. Al-Turaif, J. Saudi Chem. Soc., 2014, 18, 169–182 CrossRef.
- J. Bhandari, F. Khan, R. Abbassi, V. Garaniya and R. Ojeda, J. Loss Prev. Process Ind., 2015, 37, 39–62 CrossRef CAS.
- J. Soltis, Corros. Sci., 2015, 90, 5–22 CrossRef CAS.
- J. Grosseau-Poussard, J. Dinhut, J. Silvain and R. Sabot, Appl. Surf. Sci., 1999, 151, 49–62 CrossRef CAS.
- A. C. Lloyd, J. J. Noël, S. McIntyre and D. W. Shoesmith, Electrochim. Acta, 2004, 49, 3015–3027 CrossRef CAS.
- M. Rao, Mater. Corros., 2009, 60, 49–52 CrossRef CAS.
- P. Jakupi, D. Zagidulin, J. Noël and D. Shoesmith, Electrochim. Acta, 2011, 56, 6251–6259 CrossRef CAS.
- B. Ter-Ovanessian, N. Mary and B. Normand, J. Electrochem. Soc., 2016, 163, C410–C419 CrossRef CAS.
- M. Slemnik, Anti-Corros. Methods Mater., 2008, 55, 20–26 CrossRef CAS.
- N. Mahato and M. Singh, Port. Electrochim. Acta, 2011, 29, 233–251 CrossRef CAS.
- B. Ter-Ovanessian, C. Alemany-Dumont and B. Normand, Electrochim. Acta, 2014, 133, 373–381 CrossRef CAS.
- H. Li, H. Yu, T. Zhou, B. Yin, S. Yin and Y. Zhang, Mater. Des., 2015, 84, 1–9 CrossRef CAS.
- W. Peter, R. Buchanan, C. Liu, P. Liaw, M. Morrison, J. Horton, C. Carmichael and J. Wright, Intermetallics, 2002, 10, 1157–1162 CrossRef CAS.
- Y. Chen, L. Chou and H. Shih, J. Mater. Sci. Eng. A, 2005, 396, 129–137 CrossRef.
- H. Liu, Y. Leng, G. Wan and N. Huang, Surf. Coat. Technol., 2011, 206, 893–896 CrossRef CAS.
- E. Kikuti, R. Conrrado, N. Bocchi, S. R. Biaggio and R. C. Rocha-Filho, J. Braz. Chem. Soc., 2004, 15, 472–480 CrossRef CAS.
- R. T. Loto, J. Mater. Environ. Sci., 2013, 4, 448–459 CAS.
- W. A. Badawy, K. M. Ismail and A. M. Fathi, Electrochim. Acta, 2005, 50, 3603–3608 CrossRef CAS.
- M. G. Fontana, Corrosion engineering, Tata McGraw-Hill Education, 2005.
- L. Han and S. Song, Corros. Sci., 2008, 50, 1551–1557 CrossRef CAS.
- S. Ningshen, M. Sakairi, K. Suzuki and S. Ukai, Corros. Sci., 2014, 78, 322–334 CrossRef CAS.
- B.-P. Zhang, H. Habazaki, A. Kawashima, K. Asami and K. Hashimoto, Corros. Sci., 1992, 33, 1519–1528 CrossRef CAS.
- S. T. Arab, K. M. Emran and H. A. Al-Turaif, J. Korean Chem. Soc., 2012, 56, 448–458 CrossRef CAS.
- P. Singh, V. Srivastava and M. Quraishi, J. Mol. Liq., 2016, 216, 164–173 CrossRef CAS.
- T. Jabs, P. Borthen and H. H. Strehblow, J. Electrochem. Soc., 1997, 144, 1231–1243 CrossRef CAS.
- S. Boudin, J. L. Vignes, G. Lorang, M. Da Cunha Belo, G. Blondiaux, S. Mikhailov, J. Jacobs and H. Brongersma, Surf. Interface Anal., 1994, 22, 462–466 CrossRef CAS.
- H. Jang and H. Kwon, ECS Trans., 2007, 3, 1–11 CAS.
| This journal is © The Royal Society of Chemistry 2017 |

