 Open Access Article
Creative Commons Attribution 3.0 Unported Licence
Prediction of mechanical properties of 2D solids with related bonding configuration
Peter Hess
Institute of Physical Chemistry, University of Heidelberg, D-69120 Heidelberg, Germany. E-mail: peter.hess@urz.uni-heidelberg.de
First published on 7th June 2017
Abstract
Our knowledge of the mechanical behavior of 2D solids lags far behind the information available on their electronic properties, despite their relevance for any technological application. A chemistry-based reference model is introduced that allows the unknown mechanical properties to be estimated from a limited data base for groups of atomic and molecular monolayers with similar bonding configuration. This nanometrological approach is demonstrated for the well-studied graphene-like monolayers boronitrene and phosphorene, and the group IV-A monolayers graphene, silicene, germanene, and stanene with hexagonal structure. Comparable results were obtained for the less studied group VI-B molecular layers WS2, MoS2, WSe2, MoSe2, WTe2, and MoTe2. With the ratios of a known property of the group members to that of the reference compound, unknown fracture properties were extracted using a prototype for calibration of this property. The reference model yields very good agreement with existing data for the graphene-like monolayers. For the transition metal dichalcogenides (TMDs) results are still needed for a detailed comparison. The model can be applied to any group of atomic- and molecular layers with a related bonding configuration and stoichiometry. In view of the fast-growing family of 2D solids, the chemical reference model will provide a versatile tool to estimate unknown fracture properties from a minimal data base.
1. Introduction
The mechanical properties of selected two-dimensional (2D) solids have been extensively studied and are considered to be unique and outstanding. However, the properties relevant for stability and durability under the mechanical forces occurring during application are not as well known for most members of the rapidly increasing 2D family as other properties, such as their electronic properties.1 The mechanical properties are crucial for manufacturing, their integration into devices, and their performance during operation.2 Especially experimental studies on freely suspended monolayers are lagging far behind the fast growth of the number of 2D solids with promising properties.3 In fact, measurements of the Young's modulus and fracture strength, e.g., by nanoindentation, are limited to a few systems.While for the best-studied monolayer, graphene, the value of the linear Young's modulus is known quite well, the nonlinear fracture strengths given in the literature for uniaxial tension in the zigzag and armchair directions and for biaxial tension exhibit scatter over a window of more than 30%. This uncertainty further increases when the line or edge energy of graphene is considered.4 The situation becomes worse if we include other 2D group IV-A materials, going from graphene to silicene, germanene, and stanene. Most of them possess promising properties of practical interest.5–7 For other groups of 2D solids with related chemical and physical properties and similar bonding configuration, such as the group VI-B transition metal dichalcogenides (TMDs or TMDCs), even less is known, especially for the group members with high mass, despite increasing attention.8,9
The main source of information on mechanical behavior comes from density functional theory (DFT) calculations and to some extent from molecular dynamics (MD) simulations. Since MD simulations often deviate systematically from the more accurate DFT calculations, the latter are presently the most reliable and most extended source for mechanical properties. For this reason predominantly first-principles DFT data is used in this study to extend our knowledge of fracture mechanics with the ‘reference model’ introduced below.
The main purpose of this work is to introduce a generally applicable chemical reference model that allows the simultaneous treatment of all members of a group of 2D crystals with related chemistry and bonding configuration. The extraction of information by this model is demonstrated for the most extensively studied groups of 2D solids, namely the graphite-like monolayers of h-BN and phosphorene, the group IV-A elements, and the three-layer molecular sheets of group VI-B TMDs. These groups are currently attracting special interest owing to their spectrum of electronic properties ranging from conductors to semiconductors and insulators.
2. Methods
As mentioned above, in this work the intrinsic mechanical properties of 2D materials with the same type of covalent 2D bonding configuration are investigated. This allows a systematic estimate of unknown fracture properties of a group of 2D solids with a minimal data base. To achieve this goal, for example, the strongest 2D solid of the group (often the best studied member of the group) is selected as a reference or standard. By relating a known property of the group members, such as the Young's modulus, to that of the reference material, ratios can be determined that give access to other related but unknown properties of the group, such as failure properties. To verify this procedure the property to be extracted for the group members must be known for just one compound, which is used as a representative or prototype of the group for this partially unknown property. Consequently, the accuracy of this particular property of the prototype plays an important role in the estimation of this property for the other group members, since the prototype is used for calibration. Property ratios of the already known property, needed for evaluation, were studied here for both linear and nonlinear mechanical properties of single-atomic monolayers and of tri-atomic molecular layers.The theoretical basis for the general applicability of the concept is a similar chemical bonding configuration, such as a hexagonal honeycomb layer, where localized covalent bond stretching and bond rupture processes occur in a comparable chemical environment. This environment controls bond extension and dissociation and therefore to a large extent the mechanical behavior. In the case of the Young's modulus or stiffness it is the extension of bonds in the linear regime and in the case of fracture it is bond breaking, which takes place in the nonlinear region of the interaction potential. For this reason ratios of the Young's moduli and of the fracture strengths were compared to extract information on the influence of nonlinearity in the mechanical behavior.
The correlation within a group of related 2D compounds is based on the rather unique combination of interrelated chemical and physical properties, which is hardly observed in conventional materials. Furthermore, in binary systems, such as TMDs, the composition plays an important role. Relationships between elementary and composed compounds preferentially exist within the different groups of the periodic table, which is mainly responsible for the generation of characteristic sets of related compounds. The specific 2D behavior is due to the strong covalent in-plane bonding with the same stoichiometry in these atomic and molecular layers. The crucial influence of stoichiometry on the mechanical behavior of these nanostructures can hardly be overestimated. Another important point, already mentioned above, is the reduced dimensionality, leading to chemically closed 2D structures with saturated covalent bonds.
In the following study mainly mean mechanical properties originating from DFT computations are considered, often neglecting anisotropy effects (zigzag, armchair), the type of applied tension (uniaxial, biaxial), and the influence of temperature. At present, the deviations between independent studies are often much larger than the variation of mechanical properties with the direction of the applied tension or the nature of strain. The purpose is to find a consistent set of quantities describing fracture mechanics reliably, avoiding the large uncertainties still found in the literature, or to supply the first estimates. Reliable intrinsic values are urgently needed to judge the detrimental effects of defects on the ideal mechanical behavior. Furthermore, such a set of mechanical properties may also be sufficient for rough estimates relevant, for example, for the simulation of complex biological systems or practical engineering purposes.
3. Results
3.1 Single-atomic graphene-like monolayers
| E2D (N m−1) (stiffness) | Ratios (from stiffness) | σ2D (N m−1) (from stiffness) | σ2D (N m−1) (literature) | |
|---|---|---|---|---|
| Graphene | 340 (ref. 4) | 1.0 | 37 prototype | 37 (ref. 4) |
| Boronitrene | 270 (ref. 10) | 0.79 | 29 correlation | 28 (ref. 10) |
| Phosphorene | 92 (ref. 11) | 0.27 | 10 correlation | 10 (ref. 11) |
| Silicene | 61 (ref. 7) | 0.18 | 6.7 correlation | 6.6 (ref. 7) |
| Germanene | 43 (ref. 7) | 0.13 | 4.7 correlation | 4.4 (ref. 7) |
| Stanene | 25 (ref. 7) | 0.074 | 2.7 correlation | 2.4 (ref. 7) |
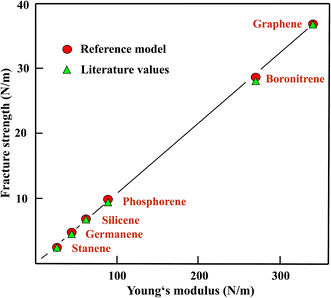
Fig. 1 shows the fracture strengths obtained with the reference model from the ratios of the Young's moduli and the strengths taken from the literature, plotted versus the corresponding Young's moduli. This figure supports the finding of a useful, easy access to the strength values of the whole chemically related group of monolayers with a plane or buckled hexagonal structure by the reference model, taking graphene as the reference of the Young's moduli of the group and also as a prototype for the strength of these graphene-like compounds.
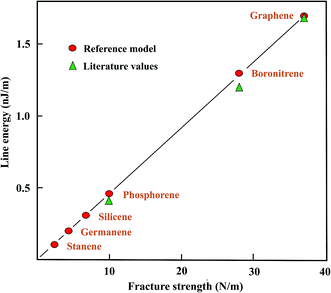
In the following, values of the largely unknown line (edge) energies of plane and buckled graphene-like monolayers are determined from strength ratios obtained from the literature values. Graphene is used as the prototype, with a mean line energy of 1.7 nJ m−1,18–20 to estimate the line energies of the graphene-like monolayers. It should be mentioned that also larger line energies of graphene of 2.0 and 2.5 nJ m−1 have been reported for the armchair and zigzag directions, respectively,21 which would require a higher line energy for calibration. The correlation of the ratios of the fracture strengths with line energies are presented in Table 2. In addition, Table 2 collects the sparsely available literature data, originating mainly from DFT studies.
| Strength ratios (from literature) | γ 1D (nJ m−1) (from strength) | γ1D (nJ m−1) DFT calc. | |
|---|---|---|---|
| Graphene | 1.0 | 1.7 prototype | 1.7 (ref. 18–20) |
| Boronitrene | 0.76 | 1.3 correlation | 1.2 (ref. 22 and 23) |
| Phosphorene | 0.27 | 0.46 correlation | ≤0.39 (ref. 24–26) |
| Silicene | 0.18 | 0.31 correlation | — |
| Germanene | 0.12 | 0.20 correlation | — |
| Stanene | 0.065 | 0.11 correlation | — |
The graphical presentation in Fig. 2 illustrates the correlation between the line energies, estimated with the fracture strength ratios and theoretical calculations. The strength ratios lead to upper limits since edge stabilization by reconstruction is not taken into account. Good agreement between the correlated and theoretical line energies of the armchair direction is found for boronitride,22,23 and for phosphorene edges.24–26 The line energies resulting from the strength correlation may decrease within the group of related compounds by more than a factor of ten, as can be seen in Fig. 2. Unfortunately, no results could be found for the three remaining group IV-A elements.
| Strength ratios (from literature) | KIC (N m−1/2) (from strength) | KIC (N m−1/2) (literature) | |
|---|---|---|---|
| Graphene | 1.0 | 1.1 × 10⁻³ prototype | 1.1 × 10⁻³ (ref. 4 and 10) |
| Boronitrene | 0.76 | 0.84 × 10⁻³ correlation | 0.94 × 10⁻³ (ref. 27), 0.73 × 10⁻³ (ref. 28) |
| Phosphorene | 0.27 | 0.30 × 10⁻³ correlation | — |
| Silicene | 0.18 | 0.20 × 10⁻³ correlation | 0.16 × 10⁻³ (ref. 28) |
| Germanene | 0.12 | 0.13 × 10⁻³ correlation | — |
| Stanene | 0.065 | 0.07 × 10⁻³ correlation | — |
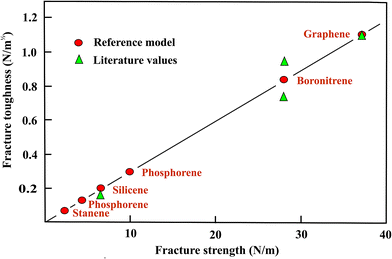
In Fig. 3 the toughness values based on the strength ratios with graphene as the reference are displayed as a function of the fracture strengths. Similar to the situation observed for the line energies, the strength ratios provide a good description of fracture toughness. Since it is still not clear whether the armchair or zigzag direction has the lowest toughness in boronitrene, mean values are shown in Fig. 3. The only result presently available for silicene indicates a large decrease of the fracture toughness within the considered group of monolayers that is consistent with the comparable variation of the fracture strength ratios (see Fig. 3).
3.2 Results for transition metal dichalcogenides
In Table 4 the average values of the zigzag and armchair directions of the Young's moduli and fracture strengths are displayed, together with the ratio of the stiffness of each compound normalized to WS2, which has the highest stiffness in this group. For the best-studied tungsten chalcogenide, WS2, the Young's modulus measured by nanoindentation38,39 is somewhat larger than the stiffness obtained by DFT calculations.31 While DFT calculations indicate a relatively small anisotropy for the Young's moduli, a substantial anisotropy is predicted for the fracture strengths.35 It is important to note that the fracture strength determined experimentally for MoS2 is substantially larger than the one calculated for the weakest zigzag direction, however, it is in reasonable agreement with the strengths in the armchair direction.40 The Young's moduli and mean strengths of the TMDs presented in Table 4 follow surprisingly well the factor 10 rule. Note that this is no longer true for the strengths in the zigzag or armchair directions.
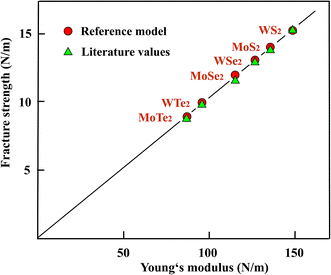
In Fig. 4 the fracture strengths resulting from the reference model applied to the stiffness and strength values from the literature are plotted versus the Young's moduli of the TMDs. As can be seen in Fig. 4, the reference model allows a reasonable estimate of the mean fracture strengths of the chemically more complex three-layer sheets of TMDs, just as in the case of atomic monolayers. It is important to note that also the Young's moduli can be used to estimate useful strength values. The stiffness belongs to the most easily accessible and most accurate mechanical properties and therefore provides an easy access.
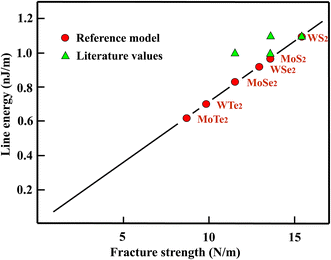
For WS2 a line energy of 1.1 nJ m−1 was found by DFT calculations that is taken as the prototype.44 As expected from the bond energy, the line energy of MoS2 is with 1.0 nJ m−1 about 10% smaller.44 Comparable values, obtained by first principles calculations, have been reported for the zigzag direction of MoS2 (1.1 nJ m−1) and MoSe2 (1.0 nJ m−1).45 Based on these latter results the line energy of WS2 should be around 1.2 nJ m−1. Such a higher line energy is supported by a much larger value of 1.4 nJ m−1 reported for MoS2.46 The line energies estimated by the reference model with the ratios of the fracture strengths and 1.1 nJ m−1 as the prototype value, as well as the results of DFT calculations are displayed in Table 5.
| Strength ratios (from literature) | γ1D (nJ m−1) (from strength) | γ1D (nJ m−1) DFT, MO | |
|---|---|---|---|
| WS2 | 1.0 | 1.1 prototype | 1.1 (ref. 44) |
| MoS2 | 0.88 | 0.97 correlation | 1.0 (ref. 44), 1.1 (ref. 45) |
| WSe2 | 0.84 | 0.92 correlation | — |
| MoSe2 | 0.75 | 0.83 correlation | 1.0 (ref. 45) |
| WTe2 | 0.64 | 0.70 correlation | — |
| MoTe2 | 0.56 | 0.62 correlation | — |
In addition, the complete set of calculated and correlated line energy data is plotted in Fig. 5 versus the critical fracture strengths. For the well-studied sulfides the results agree well within the relatively large errors involved in this quantity. Unfortunately, results are still completely missing for the tellurides.
| Strength ratios (from literature) | KIC (N m−1/2) (from strength) | KIC (N m−1/2) (literature) | |
|---|---|---|---|
| WS2 | 1.0 | 0.91 × 10⁻³ corr. | — |
| MoS2 | 0.88 | 0.80 × 10⁻³ prot. | 0.80 × 10⁻³ (ref. 47) |
| WSe2 | 0.84 | 0.76 × 10⁻³ corr. | — |
| MoSe2 | 0.75 | 0.68 × 10⁻³ corr. | — |
| WTe2 | 0.64 | 0.58 × 10⁻³ corr. | — |
| MoTe2 | 0.56 | 0.51 × 10⁻³ corr. | — |
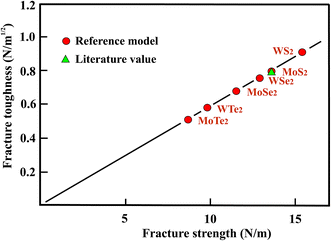
In Fig. 6 the predictions of the reference model for the critical stress intensity factor of the TMDs are shown, based on the only toughness value obtained by MD simulations for MoS2. Therefore, a comparison with literature data was not possible and additional results on the heavier TMDs are urgently needed to come to a final conclusion on the predictive power of the reference model in this case.
4. Discussion
The groups of 2D solids investigated above suggest a comparable accuracy for ratios originating from the Young's moduli and the fracture strengths (see Fig. 1 and 4). This surprising result indicates that the more versatile stiffness data, usually available first for any new material, may allow to extract reasonable information on the mechanical failure behavior. It is worth noting that the linear Young's modulus, describing linear bond extension and not nonlinear bond dissociation, is usually the most accurate mechanical property. This is an important conclusion concerning the quite limited data base needed for an application of the reference model to estimate unknown data.Furthermore, the best-studied group member and not necessarily the strongest compound can be selected as a representative for a particular property to be determined for the remaining group members. Of course, without any experimental or theoretical information a compound cannot be included in the correlation. However, for many chemically related groups in the fast-growing family of 2D solids theoretical values of the Young's moduli usually become available very soon after their discovery. Therefore, the application of the reference model allows early insight into the varying mechanical behavior resulting from the characteristic changes in the related chemical bonding configurations.
For the presently best studied group of the graphene-like monolayers, a comparison of estimated fracture properties with theoretical results for at least some compounds was possible. The modeled and calculated properties agree quite well, using the Young's moduli and fracture strengths to determine the reference ratios. Since much less information on fracture mechanics is available for the TMDs it is currently not possible to draw a final conclusion on the accuracy of the values predicted for the line energy and fracture toughness. In fact, a toughness value could be found only for one representative of the group, which was employed as the prototype and therefore an independent comparison of estimated toughnesses was not possible.
The TMDs form a rich family of 2D crystals, which contains, besides the most commonly studied group of VI-B compounds considered here, also the group V–B compounds NbS2, NbSe2, and TaS2. Very limited or no mechanical information exists for the new classes of 2D materials uncovered only recently such as the group IV-A monochalcogenides with the formula MX (M = Ge, Sn and X = S, Se), the hexagonally structured group III–VI binary monolayers MX (M = B, Al, Ga, In and X = O, S, Se, Te)48 and the group IV-B transition metal trichalcogenides (TMTs) with the common formula MX3 (M = Ti, Zr, Hf and X = S, Se, Te).49 The main representative of the latter group is TiS3 with first information on its favorable mechanical stability and electronic properties.49
In an exhaustive data collection, 103 2D compounds were categorized, distinguishing between atomic materials such as graphene, rare earth materials, semimetals, TMDs and halides, and synthetic organic materials.50 To date, experimental data exists only for a very small fraction of these compounds. For TMDs and oxides, the electronic structure has been studied for 51 compounds by first-principles calculations.51 Computations of the binding energy of prospective layered structures identified 1053 easily and 791 potentially exfoliable compounds, containing many structural prototypes.52 This prospect broadens the basis of 2D materials for groups with chemical relationships substantially and demands for an enormous effort in the characterization of the mechanical behavior of at least those potential 2D materials with promising chemical and physical properties.
5. Conclusions
It is demonstrated that the Young's moduli and fracture strengths of graphene-like monolayers can be used to estimate intrinsic fracture properties such as the strength, line energy, and fracture toughness by employing the reference model. These ideal properties are of great value to judge the detrimental effects of defects. The reference model provides a versatile method to determine unknown mechanical properties of the compounds of a chemically related group if for one group member used as prototype for calibration, the mechanical property required is already known. The whole family of potentially 1844 2D solids consists of many such groups,52 which can be treated by the reference model with a minimum data base of experimental and/or theoretical information. Consequently, the introduced nanometrological approach will be a versatile and easily applied tool to complement our knowledge of fracture mechanics.Acknowledgements
Financial support of the work by the Steinbeis Technology Transfer Center Heidelberg (STZ 269) is gratefully acknowledged.References
- S. Z. Butler, S. M. Hollen, L. Gao, Y. Cui, J. A. Gupta, H. R. Gutiérrez, T. F. Heinz, S. S. Hong, J. Huang, A. F. Ismach, E. Johnston-Halperin, M. Kuno, V. V. Plashnitsa, R. D. Robinson, R. S. Ruoff, S. Salahuddin, J. Shan, L. Shi, M. G. Spencer, M. Torrones, W. Windl and J. E. Goldberger, ACS Nano, 2013, 7, 2898–2926 CrossRef CAS PubMed.
- D. Akinwande, C. J. Brennan, J. S. Bunch, P. Egberts, J. R. Felts, H. Gao, R. Huang, J.-S. Kim, T. Li, Y. Li, K. M. Liechti, N. Lu, H. S. Park, E. J. Reed, P. Wang, B. I. Jakobson, T. Zhang, Y.-W. Zhang, Y. Zhou and Y. Zhu, Extreme Mechanics Letters, 2017, 13, 42–77 CrossRef.
- A. Castellanos-Gomez, V. Singh, H. S. J. van der Zant and G. A. Steele, Ann. Phys., 2014, 527, 27–44 CrossRef.
- P. Hess, J. Appl. Phys., 2016, 120, 124303 CrossRef.
- B. Peng, H. Zhang, H. Shao, Y. Xu, G. Ni, R. Zhang and H. Zhu, Phys. Rev. B, 2016, 94, 245420 CrossRef.
- R. John and B. Merlin, Cryst. Struct. Theory Appl., 2016, 5, 43–55 Search PubMed.
- B. Mortazavi, O. Rahaman, M. Makaremi, A. Dianat, G. Cuniberti and T. Rabczuk, Phys. E, 2017, 87, 228–232 CrossRef CAS.
- X. Huang, Z. Zeng and H. Zhang, Chem. Soc. Rev., 2013, 42, 1934–1946 RSC.
- M. Chhowalla, H. S. Shin, G. Eda, L.-J. Li, K. P. Loh and H. Zhang, Nat. Chem., 2013, 5, 263–275 CrossRef PubMed.
- P. Hess, Nanotechnology, 2017, 28, 064002 CrossRef PubMed.
- Q. Wei and X. Peng, Appl. Phys. Lett., 2014, 104, 251915 CrossRef.
- Z.-D. Sha, Q.-X. Pei, Z. Ding, J.-W. Jiang and Y.-W. Zhang, J. Phys. D: Appl. Phys., 2015, 48, 395303 CrossRef.
- V. Sorkin, Y. Cai, Z. Ong, G. Zhang and Y. W. Zhang, Crit. Rev. Solid State Mater. Sci., 2017, 42, 1–82 CrossRef CAS.
- N. Lui, J. Hong, R. Pidaparti and X. Wang, Nanoscale, 2016, 8, 5728–5736 RSC.
- H. Zhao, Phys. Lett. A, 2012, 376, 3546–3550 CrossRef CAS.
- J. Zhao, H. Liu, Z. Yu, R. Quhe, S. Zhou, Y. Wang, C. C. Liu, H. Zhong, N. Han, J. Lu, Y. Yao and K. Wu, Prog. Mater. Sci., 2016, 83, 24–151 CrossRef CAS.
- L. Tao, C. Yang, L. Wu, L. Han, J. Song, S. Wang and P. Lu, Mod. Phys. Lett. B, 2016, 30, 1650156 CrossRef.
- A. I. Rusanov, Nanoscale, 2014, 6, 8130–8133 RSC.
- K. Kim, V. I. Artyukhov, W. Regan, Y. Liu, M. F. Crommie, B. I. Yakobson and A. Zettl, Nano Lett., 2012, 12, 293–297 CrossRef CAS PubMed.
- T. Zhang, X. Li, S. Kadkhodaei and H. Gao, Nano Lett., 2012, 12, 4605–4610 CrossRef CAS PubMed.
- K. V. Bets and B. I. Jakobson, Nano Res., 2009, 2, 161–166 CrossRef CAS.
- Y. Liu, S. Bhowmick and B. I. Yakobson, Nano Lett., 2011, 11, 3113–3116 CrossRef CAS PubMed.
- B. Huang, H. Lee, B.-L. Gu, F. Liu and W. Duan, Nano Res., 2012, 5, 62–72 CrossRef CAS.
- J. Gao, X. Liu, G. Zhang and Y.-W. Zhang, Nanoscale, 2016, 8, 17940–17946 RSC.
- V. Vierimaa, A. V. Krasheninnikov and H.-P. Komsa, Nanoscale, 2016, 8, 7949–7957 RSC.
- V. Sorkin and Y. W. Zhang, Nanotechnology, 2015, 26, 235707 CrossRef CAS PubMed.
- X. Wei, S. Xiao, F. Li, D.-M. Tang, Q. Chen, Y. Bando and D. Golberg, Nano Lett., 2015, 15, 689–694 CrossRef CAS PubMed.
- T. Rakib, S. Mojumder, S. Das, S. Saha and M. Motalab, 2017, arXiv:1701.01193 [cond-mat.mtrl-sci].
- A. Tabarraei and X. Wang, Mater. Sci. Eng., A, 2015, 641, 225–230 CrossRef CAS.
- V. Sorkin, H. Pan, H. Shi, S. Y. Quek and Y. W. Zhang, Crit. Rev. Solid State Mater. Sci., 2014, 39, 319–367 CrossRef CAS.
- J. Kang, S. Tongay, J. Zhou, J. Li and J. Wu, Appl. Phys. Lett., 2013, 102, 012111 CrossRef.
- H.-P. Komsa, J. Kotakoski and S. Kurasch, Phys. Rev. Lett., 2012, 109, 035503 CrossRef PubMed.
- Z. Lin, B. R. Carvalho, E. Kahn, R. Lv, R. Rao, H. Terrones, M. A. Pimenta and M. Terrones, 2D Mater., 2016, 3, 022002 CrossRef.
- R. Zhang, V. Koutsos and R. Cheung, Appl. Phys. Lett., 2016, 108, 042104 CrossRef.
- J. Li, N. V. Medhekar and V. B. Shenoy, J. Phys. Chem. C, 2013, 117, 15842–15848 CAS.
- D. M. Guzman and A. Strachan, J. Appl. Phys., 2014, 115, 243701–243708 CrossRef.
- M. K. Jana, A. Singh, D. J. Late, C. R. Rajamathi, K. Biswas, C. Felser, U. V. Waghmare and C. N. R. Rao, J. Phys.: Condens. Matter, 2015, 27, 285401 CrossRef PubMed.
- K. Liu, Q. Yan, M. Chen, W. Fan, Y. Sun, J. Suh, D. Fu, S. Lee, J. Zhou, S. Tongay, J. Ji, J. B. Neaton and J. Wu, Nano Lett., 2014, 14, 5097–5103 CrossRef CAS PubMed.
- K. Liu and J. Wu, J. Mater. Res., 2016, 31, 832–844 CrossRef CAS.
- S. Bertolazzi, J. Brivio and A. Kis, ACS Nano, 2011, 5, 9703–9709 CrossRef CAS PubMed.
- Y. Ding, Y. Wang, J. Ni, L. Shi, S. Shi and W. Tang, Phys. B, 2011, 406, 2254–2260 CrossRef CAS.
- H. Lui, N. Han and J. Zhao, RSC Adv., 2015, 5, 17572–17582 RSC.
- H. Toulhoat, P. Raybaud, S. Kasztelan, G. Kresse and J. Hafner, Catal. Today, 1999, 50, 629–636 CrossRef CAS.
- S.-L. Xiao, W.-Z. Yu and S.-P. Gao, Surf. Sci., 2016, 653, 107–112 CrossRef CAS.
- Y. Yang, X. Li, M. Wen, E. Hacopian, W. Chen, Y. Gong, J. Zhang, B. Li, W. Zhou, P. M. Ajayan, Q. Chen, T. Zhu and J. Lou, Adv. Mater., 2016, 29, 1604201 CrossRef PubMed.
- Z. Qi, P. Cao and H. S. Park, J. Appl. Phys., 2013, 114, 163508 CrossRef.
- X. Wang, A. Tabarraei and D. E. Spearot, Nanotechnology, 2015, 26, 175703 CrossRef PubMed.
- S. Demirci, N. Avazil, E. Durgun and S. Cahangirov, Phys. Rev. B, 2017, 95, 115409 CrossRef.
- J. Dai, M. Li and X. C. Zeng, Wiley Interdiscip. Rev.: Comput. Mol. Sci., 2016, 6, 211–220 CrossRef CAS.
- P. Miro, M. Audiffred and T. Heine, Chem. Soc. Rev., 2014, 43, 6537–6554 RSC.
- F. A. Rasmussen and K. S. Thygesen, J. Phys. Chem. C, 2015, 119, 13169–13183 CAS.
- N. Mounet, M. Gibertini, P. Schwaller, A. Merkys, I. E. Castelli, A. Cepellotti, G. Pizzi and N. Marzari, 2016, arXiv:1611.05234vl [cond-mat.mtrl-sci].
| This journal is © The Royal Society of Chemistry 2017 |

