 Open Access Article
Dissociation mechanism of H2 molecule on the Li2O/hydrogenated-Li2O (111) surface from first principles calculations
Xianggang Kong a,
You Yub,
Shenggui Maa,
Tao Gao*a,
Chengjian Xiaoc and
Xiaojun Chenc
aInstitute of Atom and Molecular Physics, Sichuan University, Chengdu 610065, People's Republic of China. E-mail: gaotao@scu.edu.cn; Fax: +86 28 85405234; Tel: +86 28 85405234
bCollege of Optoelectronic Technology, Chengdu University of Information Technology, Chengdu 610225, People's Republic of China
cInstitute of Nuclear Physics and Chemistry, China Academy of Engineering Physics, Mianyang 621900, People's Republic of China
First published on 13th July 2017
Abstract
Hydrogen molecules in a purge gas are known to enhance the release of tritium from lithium ceramic materials, which has been demonstrated in numerous in-pile experiments. The static computational results suggest that the molecular adsorption of H2 on the “ideal” Li2O/hydrogenated-Li2O (111) surface encounters high dissociation barriers in various entrance channels. The surface chemical inertness of the plane can be broken by introducing vacancy defects. In the present work, a combination of static DFT calculations and ab initio molecular dynamics has been performed to investigate the H2 dissociative mechanism. Our theoretical results, that the end-on oriented H2 could dissociate on the hydrogen monomer vacancy surface with one hydrogen atom ejected into the gas phase by the abstraction channel and the parallel H2 molecule dissociates on the hydrogen dimer vacancy surface with two hydroxyls forming, suggest that hydrogen vacancy defects facilitate the adsorption and dissociation of H2 molecule. The presence of the O2− ion induced by the hydrogen vacancy provides some low energy states in which the H2 electrons can be accommodated. This is very instructive for the comprehension of phenomena that occur during the operation of a thermonuclear reactor.
1. Introduction
Lithium oxide (Li2O) is a material of technological interest in the fields of fusion reactors as a blanket breeding material and in power electronic devices, such as high-energy lithium secondary batteries.1–8 Because of its high lithium atomic density and high melting point, to name just a few properties, the Li2O ceramic has been considered as a prospective candidate breeder for the production of tritium in future thermal nuclear reactors. As we all know that the solid surface portion first suffers interaction with the external environment, we take it for granted that surface investigations are an issue of intense interest. The structural and electronic properties of lithium oxide surfaces have been investigated theoretically based on empirical potentials,9 Hartree–Fock10–12 or density-functional theory (DFT) approaches12 and experimentally by X-ray, ultraviolet photoemission, and electron-energy-loss spectroscopies.13–15 These studies confirm the stable existence of (111) surfaces, as predicted by Tasker et al.16 Obviously, it is known that various changes in the Li2O ceramic in the reactor are mainly induced by irradiation.17 The formation and properties of radiation-induced defects and radiolysis products have been investigated extensively.18–25 The tritium (T) generated by the 6Li(n,α)3H reaction mainly exists as the hydroxyl group –OT on the surface of lithium oxide.26–30 The interaction of hydrogen and its isotopes with the Li2O surfaces have been investigated using Fourier transform infrared absorption spectroscopy (FT-IR),27–31 thermal desorption spectroscopy (TDS),32,33 and work function measurements.34 And it is found that the desorption of tritium by a recombination reaction is an activated process with the activation energy of 0.95 eV at 493–533 K.32Hydrogen in the purge gas is known to enhance the release of tritium in the form of HT from lithium ceramic materials. This “accelerator” role of hydrogen has been demonstrated in numerous in-pile experiments on tritium release,35,36 of which the mechanism is deduced to be the isotope exchange reactions of H2 with surface hydroxyl groups.37 One more reasonable interpretation concluded that the HT enhancement is effected by irradiation defects, which induce the dissociation of H2 molecules.27,38,39 H2 adsorption on adjacent sites to these –OT is considered to enhance the recombination reaction of –OT and –OH and be beneficial to the improvement of tritium release. However, the detail reaction mechanisms from the atomic view, to the best of our knowledge, have scarcely been elucidated, which motivates our present study based on first-principles molecular dynamics simulations. The dissociative adsorption on the surface is often a crucial step. In ref. 31, it is suggested that H–H bond breaking requires a defective surface that exposes low coordinated sites, which provides a direction for our present work. On the perfect surfaces of MgO and TiO2, which are similar cases, a molecular adsorption energy of just less than 0.05 eV and a dissociation activation energy as high as 2.2 and 2.01 eV,40,41 respectively, have been found. Meanwhile, for both oxide surfaces the dissociative chemisorption of H2 was found exothermic on low coordination sites. Understanding of the mechanism by which hydrogen enhances tritium release could also pave the way to research on the adsorption mechanism of hydrogen on Li4SiO4 in our subsequent work. Therefore, here we introduce ab initio molecular dynamics (AIMD) simulations as a reliable and versatile tool for investigating the process of hydrogen adsorption on a reduced lithium oxide surface. Though the azimuth angle of the H2 molecule on the substrate is related to the dissociation activation energy, it is enough to select especially two cases with H2 parallel and perpendicular to the surface to investigate the dissociative micro-mechanism.
The paper is organized as follows: a description of the theoretical procedure that accounts for the DFT calculation details is made first. The Results and discussion section begins with an instruction about the surface geometric structure, followed by the adsorption of H2 molecules on Li2O (111) and the hydrogenated-Li2O surface, the dissociation energy barrier of H2, and then the dissociation process from AIMD simulations. Finally, the main conclusions are summarized in Section 4.
2. Theory and methods
Our spin-polarized density functional calculations are performed using the Vienna Ab initio Simulation Package.42–44 The PW91 generalized gradient approximation and projector-augmented wave potential are employed to describe the exchange–correlation energy and treat the valence electron–ion interaction, respectively.45,46 The cutoff energy for the plane-wave expansion is set to be 400 eV. The calculated lattice constant is 4.639 Å, which is in good agreement with the experimental value of 4.614 Å and theoretical value of 4.631 Å.6,47 The bond length of the H2 molecule is computed to be 0.749 Å, which is quite consistent with the experimental value 0.741 Å.48 In our present study, we constructed the Li2O (111) surface using the (2 × 2) supercell with periodically repeated slabs of four trilayers, namely twelve periodically repeated atomic layers. In the x–y plane, the cell axes are in the (110) and (1![[1 with combining macron]](https://www.rsc.org/images/entities/char_0031_0304.gif) 0) directions. The surface Brillouin is sampled by a 4 × 4 × 1 k-point distribution using the Monkhorst–Pack scheme.49 The convergence criterion for the electronic self-consistent cycle has been fixed to 10−6 eV in the total energy per cell. Geometry optimizations are performed within a conjugate-gradient algorithm until the convergence criterion of forces (10−2 eV Å−1) is reached. When the geometries are optimized, the atoms in the bottom two trilayers are constrained at their bulk positions. A vacuum layer of 15 Å was placed along the z direction to eliminate the interaction between periodic surface images. The asymmetry of the slab induces a net dipole, that is, a spurious electrostatic interaction between the slab and its periodic images along the z axis. In order to remove this effect, a dipolar correction along the normal direction of the slab has been applied. The surface energy is calculated according to the equation:
0) directions. The surface Brillouin is sampled by a 4 × 4 × 1 k-point distribution using the Monkhorst–Pack scheme.49 The convergence criterion for the electronic self-consistent cycle has been fixed to 10−6 eV in the total energy per cell. Geometry optimizations are performed within a conjugate-gradient algorithm until the convergence criterion of forces (10−2 eV Å−1) is reached. When the geometries are optimized, the atoms in the bottom two trilayers are constrained at their bulk positions. A vacuum layer of 15 Å was placed along the z direction to eliminate the interaction between periodic surface images. The asymmetry of the slab induces a net dipole, that is, a spurious electrostatic interaction between the slab and its periodic images along the z axis. In order to remove this effect, a dipolar correction along the normal direction of the slab has been applied. The surface energy is calculated according to the equation:
 | (1) |
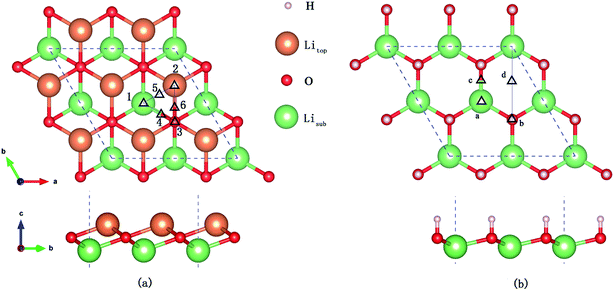
Six possible symmetry adsorption sites for H2 molecules on Li2O (111) surfaces are considered: 1 – atop-sub-Li, 2 – atop-Li, 3 – atop-O, 4 – bridge-Li, 5 – bridge-O, and 6 – bridge-sub-Li, as shown in Fig. 1a. For each adsorption site, two different orientations of the H–H axis have been taken into account, parallel and perpendicular to the surface. The adsorption energy of one H2 molecule on the Li2O surfaces (Eads) is defined as:
| Eads = Eslab+H2 − Eslab − EH2 | (2) |
In the in-pile reactor, lithium atoms of the outermost layer are first exposed to neutron irradiation, and the generated tritium atoms bond to oxygen atoms form –OT hydroxyl groups.26–30 Because of the identical chemical properties of the isotope atoms, we substitute the four lithium atoms of the uppermost layer with hydrogen atoms in the simulations, which are identical to the model set up by Oda and his co-workers.26 Four possible symmetry adsorption sites for the H2 molecules on a hydrogenated-Li2O surface are considered, as shown in Fig. 1b.
The projectile of gas H2 molecule on the Li2O (111) surface is simulated by performing ab initio theory molecular dynamics (AIMD) calculations, which are performed using the Verlet algorithm with a time step of 0.5 fs through microcanonical ensemble, namely NVE simulations that keep the number of atoms N, the cell size V, and the total energy E constant. In this simulation, the forces necessary to integrate the equations of motion are determined “on the fly” by first principles calculations. A larger (4 × 4) surface unit cell was also examined, and found no significant influence of the bound dissociated hydrogen atoms surrounding the oxygen atoms. Moreover, the adsorption energies of H2 on the perfect Li2O (4 × 4) surface unit cell are calculated, which consist of a (2 × 2) model, as tabulated in Table 3. If not otherwise noted, the (2 × 2) surface structure is used to reduce the computational cost in the present work.
3. Results and discussion
3.1. Structural properties of Li2O (111) surface
| Layer (from top layer) | Before relaxation | After relaxation | with H atom | Δ | ΔH |
|---|---|---|---|---|---|
| 1st (Li/T) | 0.38457 | 0.38313 | 0.39241 | −0.00144 | 0.00784 |
| 2nd (O) | 0.35710 | 0.35758 | 0.35202 | 0.00658 | −0.00508 |
| 3rd (Li) | 0.32963 | 0.32983 | 0.33391 | 0.00020 | 0.00428 |
| d12 | 0.02747 | 0.02555 | 0.04039 | −6.99% | 47.03% |
| d23 | 0.02747 | 0.02775 | 0.01811 | 1.02% | −34.07% |
When four outermost lithium atoms are substituted by four hydrogen atoms, the newly formed hydroxyl groups are oriented perpendicularly to the surface and the O–H bond length is 0.967 Å. It can be seen from Table 1 that the hydrogen atoms sit in a higher position compared with the substituted lithium atoms. Meanwhile, the relaxed bond angle of ∠H–O–Li is 103°, slight smaller than the bond angle, about 115°, in the lithium hydroxide crystal bulk.51 The difference may come from a reduced coordination. The calculated vibrational frequency of adsorbed –OH is 3796 cm−1 which is slightly larger than the experimental value of 3677 cm−1 by 3%,27 but still acceptable. And the calculated vibrational frequency, 2787 cm−1, of –OD agrees well with the experimental value of 2731 cm−1.29 Moreover, the predicted vibrational frequency of the adsorbed surface –OT needs confirmation by experimental measurement.
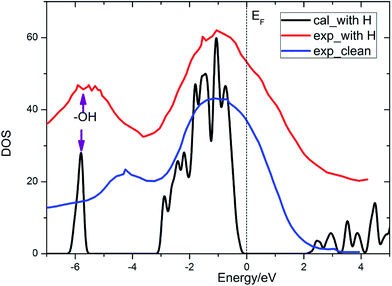
It is known that lithium oxide is a wide gap insulator, for which the measurement value from optical absorption spectroscopy is 6.6 eV.4 With a similar technical parameter as Islam and coworkers,4 we obtain an identical gap value of 5.00 eV. The discrepancy mainly comes from the drawback of the GGA method itself. However, this method can provide results of acceptable quality. The band gap for the Li2O (111) surface is reduced in contrast to that of the bulk crystal, ascribed to the presence of surface excitation. In the present work, we also calculate the total density of state of the Li2O surface with the uppermost four lithium atoms substituted by four hydrogen atoms, which agree well with the experimental curve,26 as shown in Fig. 2. The peak of the surface hydroxyl group locates at 6 eV below the Fermi energy level. What is discussed above verifies the reliability of the theoretical calculations and surface models that we set. In the following parts, we investigate the interactions between H2 and the established surface models.
3.2. Adsorption of H2 on Li2O (111) systems
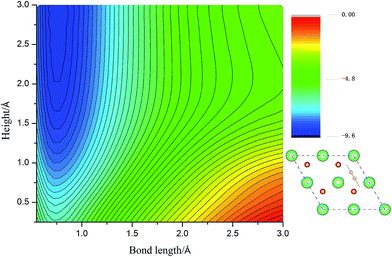
Calculated adsorption energies. The adsorption energies of H2 molecules on Li2O (111) surface are calculated with eqn (2), which is not corrected by zero-point energy, summarized in Table 2. Geometry relaxations for these adsorption models give rise to the free slab and an isolated H2 molecule. The adsorption energies on both the perfect Li2O surface and the hydrogenated-Li2O surface are found to range from 0.013 to 0.047 eV, which is the same magnitude as the adsorption energy of H2 molecules on the MgO (001)41 and the two fold coordinated surface oxygen site of anatase (101) surface.40 The almost identical values between the adsorption energies of H2 on the (2 × 2) and (4 × 4) supercells indicate that our present model is large enough. Because of the nearly negligible adsorption energies, it can be judged that this is a weak physisorption process with respect to H2 molecules on the (111) surface. We all know that low adsorption energies are favor the release of tritium gas, but go against the isotope exchange reactions of H2 with surface hydroxyl groups. Our conclusion is very consistent with the work of Taniguchi et al.,39,52 namely, H2 can hardly dissociate on the ‘ideal’ Li2O surface, ascribed to the saturated chemical bonds between anions and cations. We verify this viewpoint further by calculating the potential energy surface, which works as a function of height (center of mass of H2 high over the surface) and bond length of H2, as depicted in Fig. 3. It is reported that H2 molecules exist in the form of OH on the surface by dissociating and bonding to the O atom.27 It is known that the dissociation process will spend less energy if the hydrogen molecule bond breaking is accompanied by the formation of a strong adsorbate–substrate bond simultaneously. Based on this viewpoint, one hypothesizes that the pathways in which the hydrogen molecule remains essentially parallel to the surface with the atoms orientated towards the oxygen sites are the energetically favorable ones. The two-dimensional cut of the dissociation pathway is plotted in Fig. 3. The plot is obtained by interpolating about 200 calculated points scanning different bond lengths of H2, dH–H, and the height of the center of mass above the surface, h. From the plot, one can see that the dissociation path is not active. It is noted that the potential energy increases monotonically along the reaction coordinate, which means it will not lead to dissociative adsorption because of the screening of the lithium layer. The hydrogenated-Li2O surface shares some common features with pure Li2O surface, which are energetically unfavorable for hydrogen molecule to move close to the lithium atom before being chemisorbed by oxygen atoms, as depicted in Fig. 4. The activation energies calculated by Taniguchi et al. for the hydrogen molecule adsorption reaction on the cluster model of the (110) surface are 2.97 and 2.60 eV, corresponding to the terrace site and the oxygen vacancy site, respectively.52 In spite of being less endothermic than the present results, it is still a high potential barrier for hydrogen molecule dissociation.
| Species | H2/free | OH | OD | OT | ||||
|---|---|---|---|---|---|---|---|---|
| Present | Other | Present | Other | Present | Other | Present | Other | |
| a Calculated value.b Experimental value. | ||||||||
| d(H–H/O–H) | 0.749 | 0.743a (ref. 48) | 0.967 | 0.970b (ref. 48) | 0.967 | 0.970b (ref. 48) | 0.967 | 0.970b (ref. 48) |
| 0.740b (ref. 48) | ||||||||
| Frequency | 4458 | 4400b (ref. 48) | 3796 | 3677b (ref. 27) | 2787 | 2731a (ref. 29) | 2342 | |
| 3642a (ref. 48) | 2710b (ref. 30) | |||||||
| 3738b (ref. 48) | 2824a (ref. 51) | |||||||
| Perfect surface | Hydrogenated-Li2O surface | |||||
|---|---|---|---|---|---|---|
| Site | Perpen. surf. | Parall. surf. | Supercell | Site | Perpen. surf. | Parall. surf. |
| 1 | 0.028 | 0.022 | 0.028 | a | 0.038 | 0.027 |
| 2 | 0.047 | 0.013 | 0.047 | b | 0.021 | 0.028 |
| 3 | 0.013 | 0.031 | 0.014 | c | 0.046 | 0.025 |
| 4 | 0.043 | 0.046 | 0.044 | d | 0.035 | 0.033 |
| 5 | 0.044 | 0.025 | 0.045 | — | — | |
| 6 | 0.026 | 0.039 | 0.026 | — | — | |
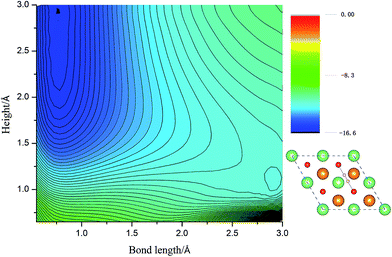 | ||
| Fig. 3 The two-dimensional cut of the PES for the dissociation pathway shown in the inset. The hydrogen molecular axis is parallel to the nearest O–O bond. The contour spacing is 0.2 eV per molecule. | ||
 | ||
| Fig. 5 The site of the hydrogen vacancy on the hydrogenated-Li2O surface. (a) Monomer vacancy, (b) dimer vacancy. | ||
The monomer vacancy case. One can clearly see the energetic process from the initial molecular physisorption with a height of 2.25 Å and bond length of 0.76 Å to the final dissociative adsorption from Fig. 6. The most distinct feature in Fig. 6 is that the calculated potential energy exhibits a barrierless process toward dissociative adsorption. The transition state with an almost negligible barrier, 0.03 eV, is located at a distance of 1.61 Å above the O atom, where the H–H bond length is elongated to 0.81 Å. Considering the temperature effect, that is, the actual operation circumstances in the nuclear fusion reactor, the H2 molecule should suffer dissociation without a hitch.
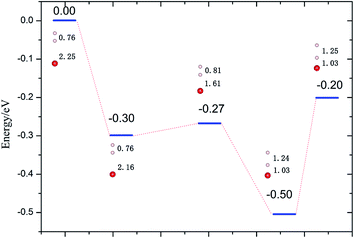 | ||
| Fig. 6 Dissociation energies profile of H2 perpendicular to the hydrogenated-Li2O (111) surface atop of the H vacancy. The bond lengths of H–H (dH–H) and O–H (dO–H) are in Å. | ||
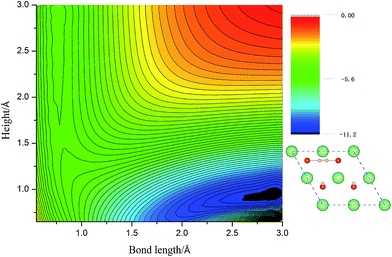
The dimer vacancy case. Here we remove two adjacent H atoms and, accordingly, the dimer vacancy forms. Fig. 7 shows a two-dimensional cut of the PES of H2 on hydrogenated-Li2O, which is displayed as a function of the molecular bond length b and molecular center of mass distance h from the relaxed surface. It is to be noted that this is a favored configuration for the H2 molecule to dissociate, of which the dissociation barrier is about 0.2 eV. The lower activation energy enables the dissociation reaction easier.
3.3. Simulation of the dissociation of the H2 molecule by AIMD
Up to now, we have investigated ample reaction barriers of H2 molecules on the perfect surface and reduced surface, respectively, and found that the H vacancy defect site is in favor of the dissociation reaction. Next, we further simulate the reaction process by the AIMD method and reveal the reaction mechanism. As aforementioned, we consider a (2 × 2) surface unit cell in our calculations.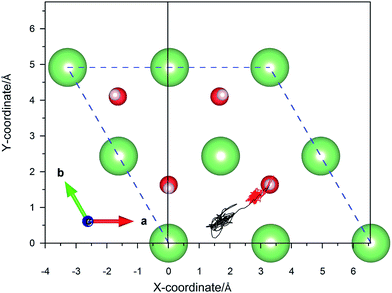 | ||
| Fig. 8 Calculated trajectories of hydrogen atoms upon the dissociative adsorption on a hydrogenated-Li2O surface with an H monomer vacancy. | ||
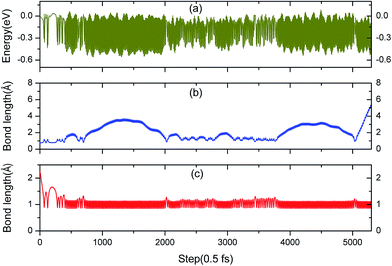
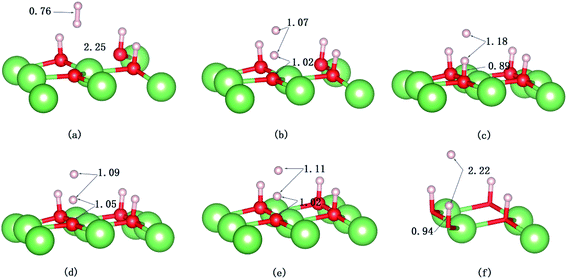
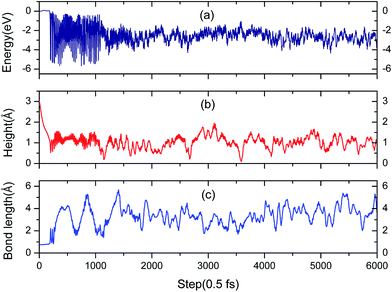
Fig. 9a shows that the system experiences no barrier to a reaction in the entrance channel and reaches the first equilibrium state of −0.3 eV. The change in energy is the result of the rapid dissociation of the H2 molecule and the fluctuation tendency of the potential during the initial 23 fs is in consistent with our previous CI-NEB studies. Hereafter, the upper hydrogen atom vibrates in this localized area and when the H–H bond length enlarges, the distance of O–H will decrease simultaneously, and vice versa. Every time it moves away the surface, the upper hydrogen atom first moves closer to the lower one, as depicted in Fig. 10a and b, due to the repulsion interaction. Finally, the upper hydrogen atom is ejected back into the gas phase at 2750 fs. Accordingly, we could consider this reaction as dominated by an abstraction mechanism,56 whereby one hydrogen atom from H2 bonds an O atom of the surface while the other one is ejected back into the air.
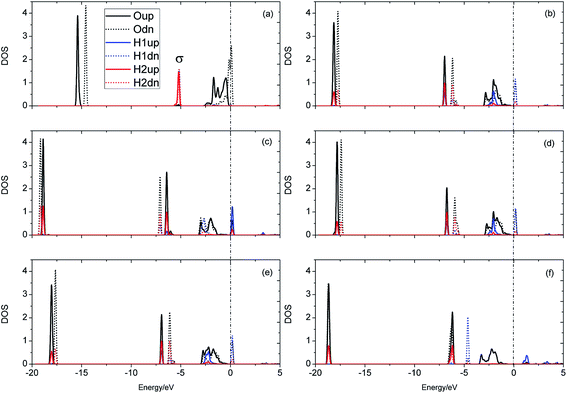
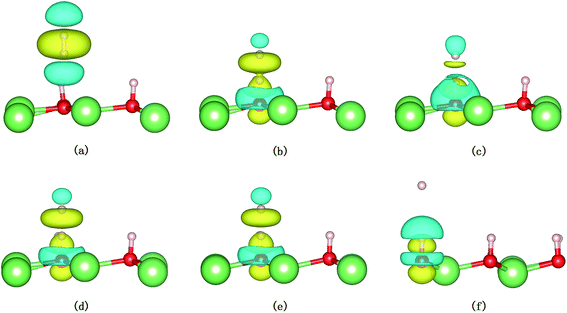
The evolution of the electronic structure during the adsorption and dissociation of a H2 molecule on a hydrogenated-Li2O surface is of great theoretical importance and thus has been studied in depth. We here have connected it with the structure, charge density, and Bader charge analysis to illustrate the H2 dissociation mechanism. Analysis of the difference charge density and Bader charge during the dissociation reveals the transfer of charge and the subsequent formation of two fragments: a hydroxide group and a hydrogen atom. Here we define the charge density difference of the system to be the difference between the adsorbate system and the sum of isolated hydrogen molecule and hydrogenated-Li2O slab, which shows charge redistribution and net charge transfer between the surface and hydrogen molecule. Due to the fact that only the nearest neighbors are directly involved in the chemisorption bond formation, here we consider the LDOS of the system. The snapshots in Fig. 10 show the initial configuration together with 5 cases of the dissociated products. In the initial physisorption state, H2 sits above the H vacancy with the H–H bond perpendicular to the surface, where the σ orbital is below the Fermi level of −5 eV and has no overlap with substrate atom and a defect related state appears right above the valence band edge, as shown in Fig. 11a. As a result of the hydrogen vacancy, the p state orbital of the substrate O atom is not completely occupied until it bonds to the lower H atom, as shown in Fig. 11f. There is a minor charge transfer from upper H atom to the lower one in contrast to a free molecule due to the electrostatic effect. When it approaches the surface further, at t = 32 ps, as shown in Fig. 10b, the breaking H–H bond is stretched to 1.07 Å and the H–Osurface distance is 1.02 Å. The p states of the O atom, as a whole, shift downward to a lower energy level, as shown in Fig. 11b. In the meantime, the H2 molecular orbital is broadened into several energy bands through electronic hybridizations with the substrate O atom. Corresponding to this state, O atoms capture electrons from the lower H atom, while the upper H atom gets a minor charge only. At the first transition state, t = 34 fs, the breaking H–H bond is stretched to 1.18 Å and the H–Osurface distance is shortened to 0.89 Å, which is smaller than the free –OH due to the transformation of kinetic energy into potential energy. At this moment, the Bader charge of the O atom increases to 7.36 electrons while the lower H atom decreases to 0.49 electrons. In contrast, the charge transfers back from the O atom again when the lower H atom bounces up at t = 37 fs and 60 fs in light of the calculated results plotted in Fig. 12, which is verified by the similarity of Fig. 11b with Fig. 11d and e. Finally, the upper H atom flies away from the surface after obtaining enough kinetic energy due to the repulsion of the OH underneath. The spin of the O atom is fully quenched to zero, as shown in Fig. 11e. Meanwhile, the Bader charge of the O atom increases to 7.45 electrons and the lower H atom decreases to 0.42 electrons. Fig. 13 shows that, in the entire dynamic simulation, the lower hydrogen atom works as charge donator while the upper hydrogen atom and oxygen atom can be viewed as acceptors, which is consistent with the PDOS and Bader charge analysis. Similar to the hydrogen molecule on the transition metal surface (e.g. Pd,57–59 Cu,60,61 and Pt,62 etc.) that charge transfer from the substrate to the molecule, which results in reduction and dissociation due to the interaction of the H2 σg orbital with the d bands, the H2 molecule loses some charge and is oxidized by the oxygen atoms due to the interaction of the σg orbital with the p bands. One step further, all the atomic orbitals are saturated and form a steady electronic structure for the perfect hydrogenated-Li2O surface, whereas the partial filling d orbitals of the transition metal surface serve as sinks for the s electrons of the H2 molecule. It has been both theoretically and experimentally shown that abstractive chemisorption is favored for collisions with the incident molecule oriented end-on.56,63 Yourdshahyan et al.64 suggest that charge transfer to form O2− occurs prior to a significant lengthening of the internal O2 bond and at a greater gas-surface distance for end-on collisions on the Al surface. For the H2 molecule adsorption system, a similar situation has been found. In the end-on geometry, the outer H atom is too far away from the surface to form a bond before the charge transfer occurs sequentially. Different from the situation of O2 impinging on the Al surface and obtaining some charge, H2 loses charge on the hydrogenated-Li2O surface.
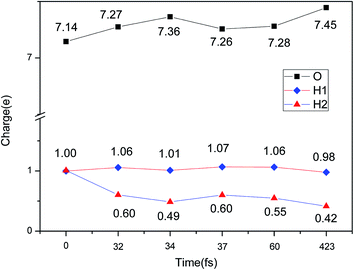 | ||
| Fig. 12 Evolution of the charge change during H2 dissociation on hydrogenated-Li2O (111) by a Bader charge analysis. | ||
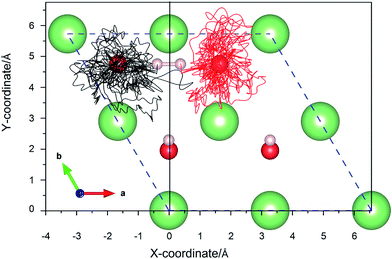 | ||
| Fig. 14 The xy-projections of calculated trajectories of the hydrogen atoms upon the dissociative adsorption on a hydrogenated-Li2O surface with an H dimer vacancy. | ||
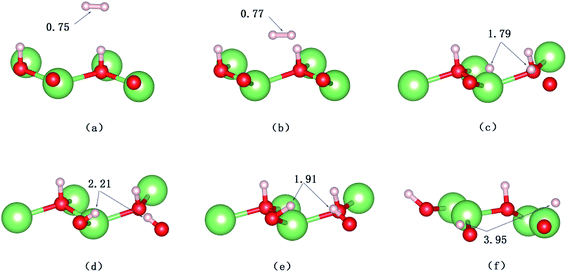
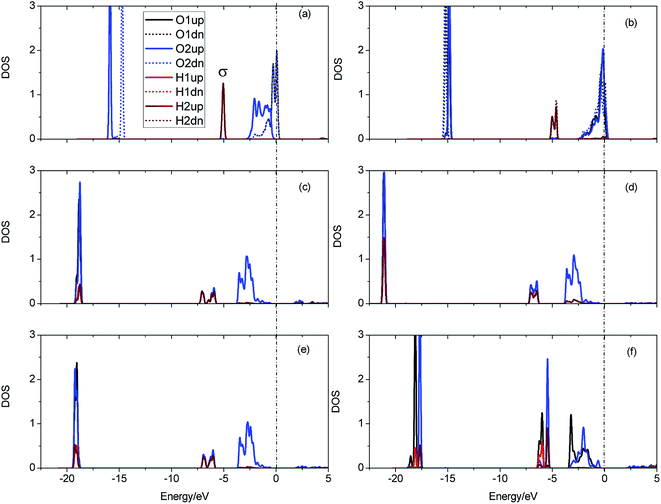
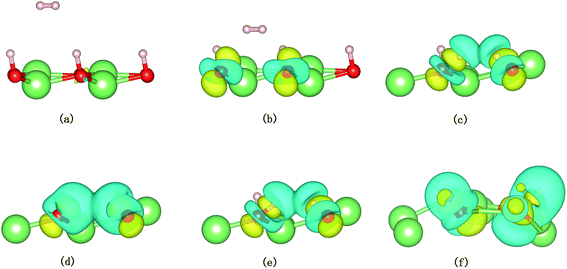
A structural analysis of the dissociation process and a part of the subsequent dynamics of the two fragments are presented in Fig. 16. The advent of the adsorbate's dissociative adsorption on the substrate is accompanied by the breaking and forming of chemical bonds, which means an electronic redistribution between the reactants. Therefore, the microscopic mechanism of the dissociative adsorption process could be explained by the changes of electronic structure manifested by the density of states (DOS) projected on the involved orbitals, which can furnish valuable insights into the adsorbate–substrate interactions. In the following section, we analyze the electronic redistribution along the simulation process, combining the structure, charge density difference and Bader charge analysis. The H2 molecule starts its motion 3 Å above the topmost oxygen atom, of which the σ orbital, below the Fermi level of about ∼5 eV, has no hybridization with the substrate atom. The spin splitting occurs at the valence band area and the Fermi level crosses the top of the valence band due to the hydrogen dimer vacancy. After starting the dynamics, the molecule moves toward the surface, and the corrugated potential energy surface steers the molecule so that it reaches the most favorable adsorbed configuration. The dissociation process can be characterized by increasing the donation of the electrons from σ orbital of the H2 molecule to the surface, in particular the oxygen atom, which corresponds to a gradual lowering of the p peak below the Fermi level (Fig. 17). At 40 fs, the H2 molecule approaches nearer to the surface and the H–H bond elongates to 0.77 Å. The system electron reorganization further proceeds and the spin splitting narrows down due to the electrostatic interaction, as shown in Fig. 17b. This shows that the electronic orbitals of the adsorbate still have not hybridized with the substrate, which could be verified by the charge density difference analysis presented in Fig. 19b. At t = 100 fs it enters into the dissociation adsorption state. The H–H distance enlarges to 1.79 Å, indicating that the adsorbed H2 is fully dissociated. And one femtosecond later, the separated hydrogen atoms bind to the superficial oxygen atoms and the H–H bond length becomes larger than ∼2.21 Å. The H2 molecular orbital further vanishes through hybridizations with the p electrons of the O atom, as shown in Fig. 16c and d. Simultaneously, the p states projected onto the O atoms near the Fermi level broaden gradually following the decrease of H–O distance. The Bader charge analysis results tell us that this is a process of charge transfer from hydrogen molecule to the substrate but has nothing to do with the superficial lithium atom, just as shown in Fig. 18. The charge depletion around the hydrogen atoms and the charge accumulation around the superficial oxygen atoms clearly show us the newly formed hydroxyl in Fig. 19c and d. Because of the nonzero velocity, H atoms will continue to move closer toward the O atom. After reaching the smallest length of the O–H bond, the H atoms will be repulsed back. As shown in Fig. 16e, the H–H distance decreases to 1.91 Å. The electrons transfer back from the O atoms to the H atoms again. However, two dissociated H atoms vibrate around the O atoms in the following simulation. Here we randomly choose a state at t = 1320 fs; the H–H reach a length of 3.95 Å. Because of the surface deformation, the degeneracy of the electronic orbitals of the H atoms and the O atoms vanished.
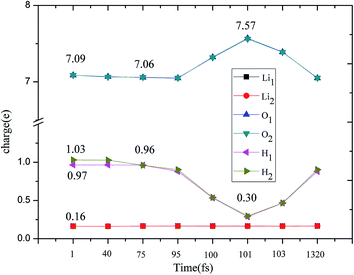 | ||
| Fig. 18 Evolution of charge change during the H2 dissociation on Li2O (111) by a Bader charge analysis. | ||
During the H2 molecule dissociation process, first, a certain number of electrons of H2 transit to the antibonding orbitals, which induce the H–H bond breaking, and then more electrons transfer from the H atoms to the O atoms due to the strong oxidizability of the hydrogen dimer vacancy. The H2 molecule entering the dimer vacancy gains quite a significant amount of kinetic energy and transfers its energy towards substrate vibrations within one to two picoseconds. In this process, the presence of two O− radicals induced by the hydrogen vacancies plays a key role for H2 dissociation, which provide some low energy states in which the H2 electrons can be accommodated.
4. Conclusions
The dissociation mechanisms of H2 on the nonstoichiometric Li2O (111) surface have been elucidated using AIMD simulations. The validity of the surface models has been attested by comparing various properties, such as the lattice parameters, total density of states, and vibrational frequencies of the adsorbed hydroxyl, with the available literature data. By means of density functional theory, we investigate the dissociation PES of H2 on the surfaces (Li2O and hydrogenated-Li2O surfaces) and conclude that the high barrier goes against H2 dissociation on the perfect surface, but for the nonstoichiometric surface it does not. According to this, we performed the AIMD simulations on the nonstoichiometric surface, and found the end-on oriented H2 could dissociate on the hydrogen monomer vacancy surface with one hydrogen atom ejected into the gas phase by the abstraction channel, while a parallel H2 molecule dissociated on the hydrogen dimer vacancy surface with two hydroxyls forming. In a good deal of these reactions, the surface atoms (especially the oxygen atom) with a low coordination number seem to play an important role. The dimer vacancy site is less active in interactions with the H2 molecule due to the geometry relaxation, which gives rise to an activation energy. Both cases augment the hydroxyl density and increase the recombination reaction probability, which may aid in releasing tritium gas. Even though our research has shed some light on the function of the hydrogen vacancy on a Li2O/hydrogenated-Li2O (111) surface for hydrogen molecule dissociation, our present investigation is far from enough. The stepped surface may supply some other active sites.Acknowledgements
The present work is supported by the ITER plan of the Ministry of Science and Technology of China (Grant No. 2014GB111001), and the National Nature Science Foundation of China (Grant No. 11547224).References
- C. Johnson and G. Hollenberg, J. Nucl. Mater., 1984, 123, 871–881 CrossRef CAS.
- N. Roux, C. Johnson and K. Noda, J. Nucl. Mater., 1992, 191, 15–22 CrossRef.
- G. Federici, C. Wu, A. Raffray and M. Billone, J. Nucl. Mater., 1992, 187, 1–31 CrossRef CAS.
- M. M. Islam, T. Bredow and C. Minot, J. Phys. Chem. B, 2006, 110, 9413–9420 CrossRef CAS PubMed.
- M. Hayoun and M. Meyer, Surf. Sci., 2013, 607, 118–123 CrossRef CAS.
- Y. Duan and D. C. Sorescu, Phys. Rev. B: Condens. Matter Mater. Phys., 2009, 79, 014301 CrossRef.
- P. Goel, N. Choudhury and S. Chaplot, Phys. Rev. B: Condens. Matter Mater. Phys., 2004, 70, 174307 CrossRef.
- M. Gupta, P. Goel, R. Mittal, N. Choudhury and S. Chaplot, Phys. Rev. B: Condens. Matter Mater. Phys., 2012, 85, 184304 CrossRef.
- M. Taylor, C. Sims, G. Barrera, N. Allan and W. Mackrodt, Phys. Rev. B: Condens. Matter Mater. Phys., 1999, 59, 6742 CrossRef CAS.
- A. Sutjianto, S. Tam, R. Pandey, L. Curtiss and C. Johnson, J. Nucl. Mater., 1995, 219, 250–258 CrossRef CAS.
- T. Ouazzani, A. Lichanot and C. Pisani, J. Phys. Chem. Solids, 1995, 56, 915–918 CrossRef CAS.
- M. M. Islam and T. Bredow, J. Phys. Chem. C, 2008, 113, 672–676 Search PubMed.
- L. Liu, V. E. Henrich, W. Ellis and I. Shindo, Phys. Rev. B: Condens. Matter Mater. Phys., 1996, 54, 2236 CrossRef CAS.
- S. Tanaka, M. Taniguchi and H. Tanigawa, J. Nucl. Mater., 2000, 283, 1405–1408 CrossRef.
- V. Mauchamp, P. Moreau, G. Ouvrard and F. Boucher, Phys. Rev. B: Condens. Matter Mater. Phys., 2008, 77, 045117 CrossRef.
- P. Tasker, J. Phys. C: Solid State Phys., 1979, 12, 4977 CrossRef CAS.
- K. Noda, K. Uchida, T. Tanifuji and S. Nasu, Phys. Rev. B: Condens. Matter Mater. Phys., 1981, 24, 3736 CrossRef CAS.
- V. Grishmanov, S. Tanaka and T. Terai, J. Nucl. Mater., 1997, 246, 126–130 CrossRef CAS.
- D. Yamaki, T. Tanifuji and K. Noda, J. Nucl. Mater., 1998, 258, 549–554 CrossRef.
- K. Okuno and H. Kudo, J. Nucl. Mater., 1986, 138, 31–35 CrossRef CAS.
- F. Beuneu, P. Vajda, G. Jaskierowicz and M. Lafleurielle, Phys. Rev. B: Condens. Matter Mater. Phys., 1997, 55, 11263 CrossRef CAS.
- O. Slagle, T. Kurasawa, R. Verrall and G. Hollenberg, J. Nucl. Mater., 1992, 191, 214–218 CrossRef.
- K. Noda, Y. Ishii, H. Matsui and H. Watanabe, J. Nucl. Mater., 1985, 133, 205–208 CrossRef.
- K. Noda, Y. Ishh, H. Matsui and H. Watanabe, Radiat. Eff. Defects Solids, 1986, 97, 297–305 CrossRef CAS.
- N. Masaki, K. Noda, H. Watanabe, R. Clemmer and G. Hollenberg, J. Nucl. Mater., 1994, 212, 908–911 CrossRef.
- T. Oda, H. Tanigawa and S. Tanaka, Fusion Sci. Technol., 2003, 44, 485–489 CAS.
- S. Tanaka, M. Taniguchi, M. Nakatani, D. Yamaki and M. Yamawaki, J. Nucl. Mater., 1995, 218, 335–338 CrossRef CAS.
- T. Kurasawa and V. Maroni, J. Nucl. Mater., 1983, 119, 95–101 CrossRef CAS.
- M. Taniguchi, S. Tanaka and T. Yoneoka, J. Nucl. Mater., 1995, 226, 178–184 CrossRef CAS.
- T. Oda, Y. Oya and S. Tanaka, J. Nucl. Mater., 2004, 329, 1256–1259 CrossRef.
- S. Tanaka and M. Taniguchi, J. Nucl. Mater., 1997, 248, 101–105 CrossRef CAS.
- T. Tanifuji, D. Yamaki and S. Jitsukawa, J. Nucl. Mater., 2004, 329–333, 1266–1269 CrossRef CAS.
- T. Tanifuji, K. Noda, S. Nasu and K. Uchida, J. Nucl. Mater., 1980, 95, 108–118 CrossRef CAS.
- T. Yokota, A. Suzuki, K. Yamaguchi, T. Terai and M. Yamawaki, J. Nucl. Mater., 2000, 283, 1366–1369 CrossRef.
- K. Munakata, T. Shinozaki, K. Inoue, S. Kajii, Y. Shinozaki, R. Knitter, N. Bekris, T. Fujii, H. Yamana and K. Okuno, Fusion Eng. Des., 2008, 83, 1317–1320 CrossRef CAS.
- C. E. Johnson, K. Noda and N. Roux, J. Nucl. Mater., 1998, 258–263, 140–148 CrossRef CAS.
- A. Baba, M. Nishikawa, T. Eguchi and T. Kawagoe, Fusion Eng. Des., 2000, 49, 483–489 CrossRef.
- D. Yamaki, A. Iwamoto and S. Jitsukawa, J. Nucl. Mater., 2000, 283–287, 1414–1418 CrossRef CAS.
- M. Taniguchi and S. Tanaka, J. Nucl. Mater., 1998, 258, 531–536 CrossRef.
- U. Aschauer and A. Selloni, Phys. Chem. Chem. Phys., 2012, 14, 16595–16602 RSC.
- G. Wu, J. Zhang, Y. Wu, Q. Li, K. Chou and X. Bao, J. Alloys Compd., 2009, 480, 788–793 CrossRef CAS.
- G. Kresse and J. Hafner, Phys. Rev. B: Condens. Matter Mater. Phys., 1993, 47, 558–561 CrossRef CAS.
- G. Kresse and J. Hafner, Phys. Rev. B: Condens. Matter Mater. Phys., 1994, 49, 14251 CrossRef CAS.
- G. Kresse and J. Furthmüller, Phys. Rev. B: Condens. Matter Mater. Phys., 1996, 54, 11169 CrossRef CAS.
- P. E. Blöchl, Phys. Rev. B: Condens. Matter Mater. Phys., 1994, 50, 17953 CrossRef.
- J. P. Perdew, K. Burke and M. Ernzerhof, Phys. Rev. Lett., 1996, 77, 3865 CrossRef CAS PubMed.
- T. Farley, W. Hayes, S. Hull, M. Hutchings and M. Vrtis, J. Phys.: Condens. Matter, 1991, 3, 4761 CrossRef CAS.
- H. T. Chen, Y. M. Choi, M. Liu and M. Lin, ChemPhysChem, 2007, 8, 849–855 CrossRef CAS PubMed.
- H. J. Monkhorst and J. D. Pack, Phys. Rev. B: Solid State, 1976, 13, 5188 CrossRef.
- A. Lichanot, M. Gelize, C. Larrieu and C. Pisani, J. Phys. Chem. Solids, 1991, 52, 1155–1164 CrossRef CAS.
- H. Tanigawa and S. Tanaka, J. Nucl. Sci. Technol., 2001, 38, 1004–1006 CrossRef CAS.
- M. Taniguchi and S. Tanaka, Fusion Eng. Des., 1998, 39, 707–712 CrossRef.
- R. Shah, A. De Vita and M. Payne, J. Phys.: Condens. Matter, 1991, 3, 4761 CrossRef.
- H. Kudo and K. Okuno, J. Nucl. Mater., 1985, 133, 192–195 CrossRef.
- G. Henkelman, B. P. Uberuaga and H. Jónsson, J. Chem. Phys., 2000, 113, 9901–9904 CrossRef CAS.
- L. C. Ciacchi and M. C. Payne, Phys. Rev. Lett., 2004, 92, 176104 CrossRef PubMed.
- A. Groß, ChemPhysChem, 2010, 11, 1374–1381 CrossRef PubMed.
- A. Groß and A. Dianat, Phys. Rev. Lett., 2007, 98, 206107 CrossRef PubMed.
- W. Dong and J. Hafner, Phys. Rev. B: Condens. Matter Mater. Phys., 1997, 56, 15396 CrossRef CAS.
- C. Díaz, E. Pijper, R. Olsen, H. Busnengo, D. Auerbach and G. Kroes, Science, 2009, 326, 832–834 CrossRef PubMed.
- F. Nattino, A. Genova, M. Guijt, A. S. Muzas, C. Díaz, D. J. Auerbach and G.-J. Kroes, J. Chem. Phys., 2014, 141, 124705 CrossRef PubMed.
- D. A. McCormack, R. A. Olsen and E. J. Baerends, J. Chem. Phys., 2005, 122, 194708 CrossRef PubMed.
- M. Binetti, O. Weiße, E. Hasselbrink, A. J. Komrowski and A. C. Kummel, Faraday Discuss., 2000, 117, 313–320 RSC.
- Y. Yourdshahyan, B. Razaznejad and B. I. Lundqvist, Phys. Rev. B: Condens. Matter Mater. Phys., 2002, 65, 075416 CrossRef.
| This journal is © The Royal Society of Chemistry 2017 |

