 Open Access Article
Creative Commons Attribution 3.0 Unported Licence
Molecular dynamics simulation of Keggin HPA doped Nafion® 117 as a polymer electrolyte membrane†
S. Akbaria,
M. T. Hamed Mosavian *a,
F. Moosavi
 b and
A. Ahmadpoura
aChemical Engineering Department, Faculty of Engineering, Ferdowsi University of Mashhad, Iran. E-mail: mosavian@um.ac.ir; Tel: +98-51-38805040
bDepartment of Chemistry, Faculty of Science, Ferdowsi University of Mashhad, Iran
First published on 15th September 2017
Abstract
Heteropoly acids (HPAs) are important conductive materials with numerous potential applications in fuel cells. Keggin HPAs, as a promising example, have frequently been used as a doping agent in fuel cell membranes. A molecular-level understanding of morphological alteration caused by HPAs is very important for designing membranes with high proton conductivity at elevated temperatures. In the present study, a morphological insight is gained by means of molecular dynamics (MD) simulation of three different HPAs as doping components, i.e. [Xn+W12O40]8−n (X ≡ P5+, Si4+, and Al3+), at various degrees of hydration. Moreover, the influence of the anionic charge of HPA on the dynamic properties of protons is investigated. In addition to water cluster analysis, this study presents the activation energies for diffusion of water molecules and hydronium ions through the composite membranes. The results show the advantage of using HPAs as a dopant in fuel cell membranes.
1. Introduction
Due to high energy efficiency with minimal pollution, proton exchange membrane fuel cells (PEMFCs) can potentially be used as alternative energy sources for a variety of applications.1,2 For transportation and stationary power applications, operating a PEMFC at temperatures above 100 °C prevents anode catalyst poisoning by CO and improves the kinetics of fuel oxidation. The relatively high temperature needed for efficient fuel oxidation and the other aforementioned advantages may adversely affect the proton conductivity of perfluorosulfonic acid (PFSA) membranes. Water molecules are an important and influential component in the proton conductivity of PFSAs. Therefore, the proton conductivity of PFSA will certainly decrease at high temperatures due to the decreasing water content in the membrane.3 Therefore, there is an increasing interest in modifying existing PFSAs with remarkable conductivity rather than using Nafion at higher temperatures. Some researchers have already tried to substitute a suitable alternative membrane with a PFSA membrane. In recent years, new membranes have been investigated, including sulfonated aromatic polymers,4–8 blended Nafion/sulfonated poly(ether ether ketone),9 polysulfone,10,11 and polyimide.12,13In the pursuit of modification options for suitable Nafion alternatives, heteropoly acids (HPAs) are considered as a promising additive to improve PFSA performance at elevated temperatures. Because of their high intrinsic ionic conductivity in the solid state and structural diversity, these materials are found to be suitable for incorporation into a wide variety of membrane materials.14–16
By immersing a membrane in solutions of a HPA, Malhotra and Datta17 investigated the effect of impregnation of Nafion® with phosphotungstic acid (H3PW12O40; hereafter denoted by PW3−) on fuel cell outputs at elevated temperatures (110 °C). They reported the power density of a fuel cell with the impregnated membrane as ∼465 mV cm−2 at 0.5 V, which was significantly higher than that of conventional polymer electrolyte membrane (PEM) fuel cells. Moreover, they concluded that PW12 particles provide high concentrations of protons in the membrane pores and thereby improve proton transport through conductive domains. A hybrid Nafion®–silica membrane was also doped with PW3− and silicotungstic acid (H4SiW12O40; hereafter denoted by SiW4−).18 Antonucci et al.18 obtained the best electrochemical performance with a PW3−-based membrane. They reported that the maximum power density for a SiW4−-based membrane was even lower than that for a bare Nafion®–silica membrane. Tian and Savadogo19,20 fabricated a Nafion®/SiW4− composite membrane with different concentrations of SiW4−. The water uptake of the SiW4− doped membrane was significantly higher than that of Nafion® 117 and increased with the SiW4− concentration.19 Apart from the pretreatment conditions, the ionic conductivity of the composite Nafion®/SiW4− membrane was reported to be higher than that of a membrane without HPA.20 Different HPA additives such as PW3− and SiW4− were incorporated into cast Nafion® membrane by Ramani et al.;21 they showed that PW3− as a dopant does not enhance water uptake, although it significantly increases proton conductivity at different temperatures and relative humidity. Improvements in conductivity were attributed to lowering of the activation energy of proton hopping. In similar research carried out by Tazi and Savadogo,22 a membrane loaded with PW3− showed a comparable ionic conductivity (1.6 × 10⁻² Ω−1 cm−1) to that of a Nafion®/SiW4− membrane (9.5 × 10⁻² Ω−1 cm−1) with the same thickness.
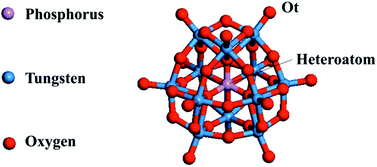
The so-called Keggin structured polyoxometalate (POM, Fig. 1) family had the most applications in composite membranes during the past decade. They are generally distinguished by their central heteroatoms as well as solvation and ion pairing features in water. In fact, changing the type of their heteroatom plays a crucial role in ion pairing and solvation features in aqueous media.22,23 Although improving cell performances with HPA particles has been generally approved in the literature, the exact morphology of a doped membrane is a subject of debate due to the variation in ionic conductivity and hydrophilic features of different HPAs. Molecular dynamics (MD) simulation has been carried out to study Nafion® membranes at various hydrations, resulting in a number of proposed morphological insights.24–29 Both experimental and theoretical studies accept that the Grotthuss mechanism in the proton transport process improves when HPA particles are imbedded in a membrane.17,30,31 Herring et al.32 investigated the transport properties of water and protons in PFSA membranes doped with HPAs, both experimentally and theoretically. These authors reported a discrepancy between experimental and theoretical enhancements when the HPA doping level was increased. It was believed that the Grotthuss mechanism of proton transport improves as the HPA content is increased. Noticeably, the observed discrepancy increases if the HPA contains anions with a higher charge, comparing SiW4− with PW3−. Consequently, in order to shed light on changes in the structural and transport properties of PFSA membranes induced by different HPAs, it is necessary to scrutinize the morphology of composite membranes.
In this study, classical MD simulation was performed on HPA doped Nafion® to explain how the anionic charge affects the membrane proton conductivity. The global aims of this study are as follows:
•Evaluating and comparing the morphological changes in side chains induced by HPAs.
•Exploring the charge effect on membrane properties.
•Studying the role of HPAs in the formation of water clusters in the hydrated membrane.
•Investigating the effect of HPAs on transport properties and the activation energy of diffusion at different hydration levels.
2. Simulation methods
2.1. Molecular models
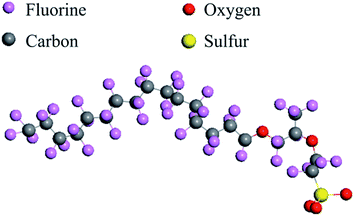
Fig. 2 shows the chemical structure of Nafion monomer. We consider 40 polymer chains in which each chain consists of 10 monomers (10 SO3−) and both ends are terminated by F atoms (682 atoms). The membrane was hydrated with 7.1, 9.7, 15.5, and 23.4 wt% of water molecules, which is quantified by factor λ, i.e. λ is defined as the ratio of water molecules to the number of SO3− groups (λ = 5, 7, 12, and 20 respectively). Based on the study by Paddison and Elliott,34 all sulfonate groups for λ ≥ 3 are completely ionized by H3O+. Hence, 100 hydronium ions were added to the simulation box while keeping charge neutrality. To investigate the influence of HPA addition on the structural and dynamic properties of Nafion, the systems were doped with approximately 15 wt% of PW3−, SiW4−, and H5AlW12O40 (hereafter denoted by AlW5−) particles.Prior to MD simulations, the optimized structure of HPA was explored by DFT at the B3LYP/LANL2DZ level of theory using Gaussian 09 (ref. 35) software. The partial charges were also assigned by the CHELPG method.36 The full set of partial charges is represented in Table S1 (ESI†). Force field parameters for HPA particles are given in ref. 24. The classical hydronium model for hydronium ions was taken from ref. 37. The flexible three-centered (F3C) model was used to simulate the water molecules;38 in addition, a recently modified DREIDING force field by Mabuchi et al.29 was used for Nafion chains. The Lorentz–Berthelot mixing rules were implemented to calculate the intermolecular interactions. Long-range electrostatic interactions were calculated from the Ewald summation39 with a tolerance factor of 1 × 10⁻⁶.
2.2. Simulation procedures
Minimization of each system was carried out using the steepest descent algorithm.40 In order to obtain the initial configuration at every hydration level, the procedure implemented by Mabuchi et al.29 was applied. Briefly, the following steps were implemented to obtain the initial structures: (1) NPT MD simulation with T = 600 K and P = 1 MPa; it should be noted that the value of ε for Nafion is reduced to 1/100 magnitude at this step; (2) NPT MD simulation in which the Lennard-Jones (LJ) potentials were returned to their normal values at T = 300 K and P = 1 atm for 100 ps; (3) NPT MD simulations with temperature variation between 300 K and 600 K for 250 ps; this step was repeated four times; (4) equilibrium NPT MD simulation at T = 300 K and P = 1 atm for 300 ps. The final simulated density was calculated while the system reached stable equilibrium. The cubic box length and the simulated density for each hydration are presented in Table S3 (ESI†). It should be mentioned that the calculated densities for the annealing process showed less than 0.5% variation with experimental data (see Fig. S2†).The production run was obtained by integrating equations of motion through a leapfrog algorithm41 for 2 ns at 300 K and 1 atm. The time step was considered to be 1 fs. A canonical ensemble (NVT) was used and the trajectory of molecules was collected every 0.1 ps (20![[thin space (1/6-em)]](https://www.rsc.org/images/entities/char_2009.gif) 000 configurations). All MD simulations were conducted using the DL_POLY package42 with periodic boundary conditions and a cutoff distance of 15 Å for the Coulomb potential. The cutoff distance for van der Waals interactions was 12 Å. The pressure was maintained constant using the Berendsen barostat,43 and the Nose–Hoover thermostat44 was applied for temperature control. The temperature was 353.15 K and the pressure was considered to be 1 atm. The relaxation time for both the thermostat and barostat was 0.1 ps.
000 configurations). All MD simulations were conducted using the DL_POLY package42 with periodic boundary conditions and a cutoff distance of 15 Å for the Coulomb potential. The cutoff distance for van der Waals interactions was 12 Å. The pressure was maintained constant using the Berendsen barostat,43 and the Nose–Hoover thermostat44 was applied for temperature control. The temperature was 353.15 K and the pressure was considered to be 1 atm. The relaxation time for both the thermostat and barostat was 0.1 ps.
3. Results and discussion
MD simulations were performed on HPA/Nafion composite membranes with the same concentration of HPA except for the anionic charges. As the electrostatic interaction strength between POM and hydronium ions changes in each case, the behavior of the hydronium ion in the vicinity of the side chain of Nafion was considered. The following sections describe the analysis of the static features at the target doping level for Nafion and the influence of the anionic charge on the morphology of the composite membranes (Section 3.1). The water–proton dynamics are addressed in Section 3.2. Finally, the activation energy of diffusion for protons and water molecules is discussed in Section 3.3.3.1. Morphological assessment
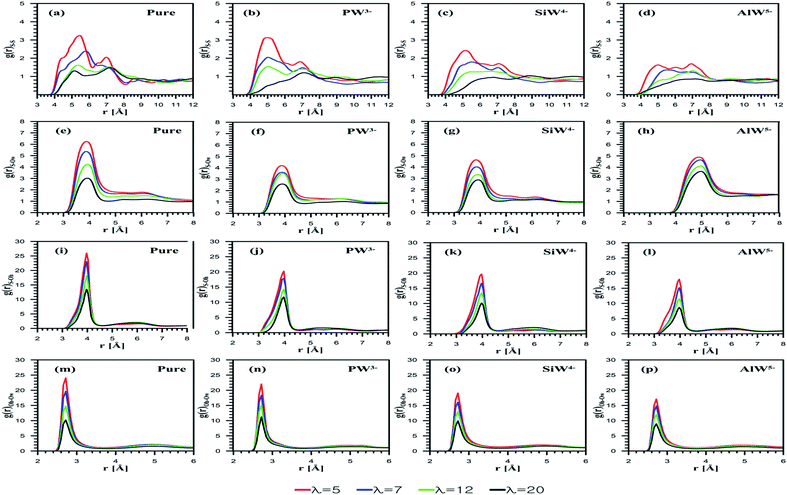
The radial distribution function (RDF) emphasizes membrane nanostructural variation with changing dopants (PW3−, SiW4−, and AlW5−) as well as the hydration level. The interaction between sulfonate groups can be investigated using S–S RDFs as shown in Fig. 3a–d. Due to an increase in the solvation of water molecules around the sulfonate groups, the S–S interaction decreases as the hydration increases for both undoped and doped membranes. The coordination numbers (CN) are reported in Table 1. In agreement with the study by Devanathan et al.,28 a decrease in the CN was observed as the hydration level increased (data are not shown). For the composite membranes considered, Nafion doped with PW3− demonstrates the strongest sulfonate–sulfonate interactions, while the membrane with the highest negatively charged anion, i.e. AlW5−, exhibits relatively weak interactions. This suggests that phase segregation in the PFSA membrane is more probable at higher HPA anionic charges. According to a study by Wu et al.,45 the improved phase segregation results in larger/elongated water domains. This phenomenon, which is frequently reported,19,21,46 could be responsible for the enhanced water uptake of HPA doped membranes. In order to prove this hypothesis, it is helpful to investigate side-chain and anion solvation using RDF plots.| g(r) | Dopants | λ = 5 | λ = 7 | λ = 12 | λ = 20 |
|---|---|---|---|---|---|
| S–S (6.5 Å) | PW3− | 1.80 | 1.60 | 1.18 | 1.09 |
| SiW4− | 1.74 | 1.58 | 1.10 | 0.80 | |
| AlW5− | 1.68 | 1.50 | 1.01 | 0.67 | |
| S–Ow (4.6 Å) | PW3− | 1.87 | 2.40 | 3.74 | 4.34 |
| SiW4− | 1.88 | 2.52 | 3.93 | 4.55 | |
| AlW5− | 2.00 | 2.70 | 4.00 | 4.58 | |
| S–Oh (4.4 Å) | PW3− | 1.40 | 1.08 | 0.77 | 0.52 |
| SiW4− | 1.25 | 1.01 | 0.70 | 0.49 | |
| AlW5− | 1.11 | 1.00 | 0.57 | 0.48 | |
| Ow–Oh (3.2 Å) | PW3− | 2.63 | 3.41 | 3.76 | 4.16 |
| SiW4− | 2.77 | 3.50 | 3.91 | 4.27 | |
| AlW5− | 2.89 | 3.52 | 4.02 | 4.30 | |
| Ot–Ow (3.5 Å) | PW3− | 2.22 | 3.01 | 3.82 | 4.64 |
| SiW4− | 2.17 | 2.88 | 3.69 | 3.91 | |
| AlW5− | 2.07 | 2.79 | 3.43 | 3.62 | |
| Ot–Oh (3.4 Å) | PW3− | 0.59 | 0.54 | 0.51 | 0.45 |
| SiW4− | 0.65 | 0.61 | 0.57 | 0.51 | |
| AlW5− | 0.72 | 0.66 | 0.62 | 0.53 |
Fig. 3e depicts the S–Ow RDFs for undoped Nafion at all the considered hydration levels. The peak height of the sulfonate–water interaction decreases with λ. The influences of the HPA anionic charge on sulfur–oxygen of water interactions are also examined using S–Ow RDFs. Fig. 3f–h shows these curves for PW3−, SiW4−, and AlW5− doped membranes, respectively. It is found that the peak heights for the AlW5− composite membrane are higher than for PW3− and SiW4− doped membranes. On the other hand, the SiW4−/Nafion composite gives higher peaks than the PW3− doped membrane. This indicates that H2O molecules are more loosely bound to SO3− as the anionic charge increases. The first minimum of the S–Ow RDFs for PW3−/Nafion, SiW4−/Nafion, and AlW5−/Nafion systems is observed at 4.6 Å, which is similar to that of the undoped systems. The CN is found to be highest for Nafion doped with AlW5− (Table 1). In other words, the CN increases with the anionic charge for all hydration levels (AlW5− > SiW4− > PW3−). It is worth mentioning that hydration around the sulfonate group in the doped membrane is lower than in the undoped membrane. This may be due to the hydrophilic features of HPAs, where water molecules tend to accumulate around POM particles (as discussed later).
The S–Oh RDF represents the sulfonate–hydronium ion interaction, as shown in Fig. 3j–l. In agreement with the investigations performed by Mabuchi et al.29 and Venkatnathan et al.47 on hydrated PFSA membranes, the SO3−–H3O+ interaction decreases as the hydration level increases due to mediation by water molecules. The SO3−–H3O+ interactions are affected by the anionic charge of HPAs loaded in Nafion®. For the doped membranes, the peak intensity for SO3−–H3O+ in the PW3−/Nafion system is highest and that for AlW5−/Nafion is the lowest, at each λ value. For doped membranes, the CN of hydronium ions around the sulfonate group decreases with the hydration level (Table 1). As expected, the AlW5− particles attract more hydronium ions as they have a greater negative charge than SiW4− and PW3− anions; consequently, the CN depends on anionic charges and varies inversely; i.e. (PW3− > SiW4− > AlW5−).
As is clear from Fig. 3m–p, the hydration of hydronium ions increases with water content. For HPA doped membranes, Oh–Ow RDFs exhibit similar peaks at 3.20 Å, although the anionic charge increases their intensity. At λ = 5, the CN of the first shell is 2.02, 2.63, 2.77 and 2.89 for the undoped, PW3−/Nafion, SiW4−/Nafion and AlW5−/Nafion systems, respectively (see Table 1 for more detail). The first CN is 3.53 for the undoped membrane and 4.16, 4.27, and 4.30 for PW3−/Nafion, SiW4−/Nafion, and AlW5−/Nafion, respectively, at λ = 20. It can be concluded that the CN increases with the water uptake for all the considered systems.
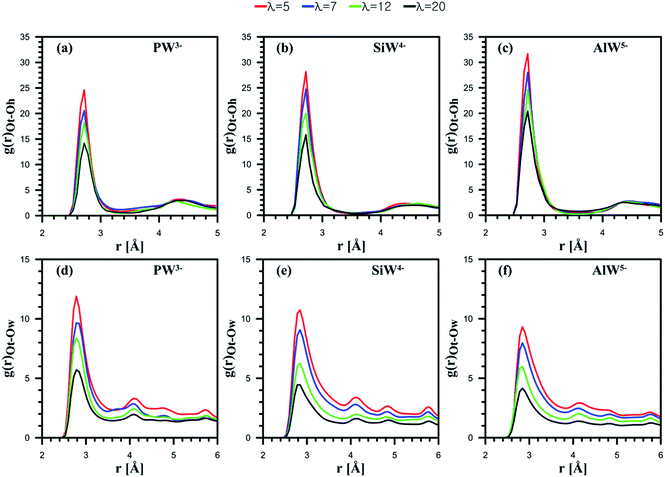
Next, the behavior of H3O+ ions or H2O molecules around HPA particles was investigated. The outermost atom of POM that can interact with H2O molecules or H3O+ ions is the terminal oxygen atom of the Keggin structure (see Fig. 1). Note that the atom is shown by Ot. Ot–Oh and Ot–Ow RDFs are presented in Fig. 4.
For all the considered POMs, as Fig. 4a–c shows, the interaction between H3O+ and Ot diminishes as λ increases. Indeed, an anion with a greater charge can coordinate more hydronium ions. The CNs reported in Table 1 confirm this observation. Overall, the results suggest that the least-charged PW3− anion contains the minimum number of ion pairs with hydronium ions, while the most charged AlW5− anion involves the highest number of ion pairs.
HPA hydration with respect to Ot–Ow RDFs reveals that the interaction between H2O and Ot weakens as the anionic charge increases; however, their distance is not affected by the hydration level (Fig. 4d–f). Furthermore, for all the considered dopants, the interaction between H2O and Ot decreases with the water uptake. The highest CN belongs to the anion with the least charge (Table 1). In fact, the hydrophilic features of HPAs48 and cation–anion attraction facilitate the formation of water clusters containing hydronium in PFSA systems, which may improve proton transport. It can be concluded that if PFSA is doped with HPAs, the presence of hydrophilic particles not only improves water uptake but also facilitates the formation of water clusters. The results of the present simulation are in good agreement with the experimental data reported by Tazi and Savadogo.22 They stated that water uptake for a Nafion®/PW3− composite membrane (48%) was higher at 135 °C than for a Nafion®/SiW4− composite membrane (27%).
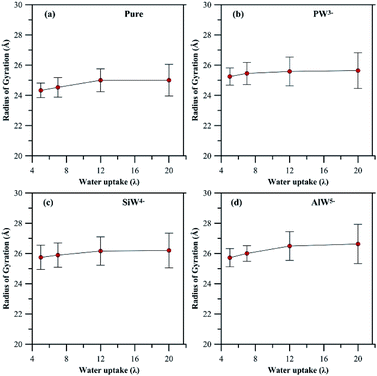
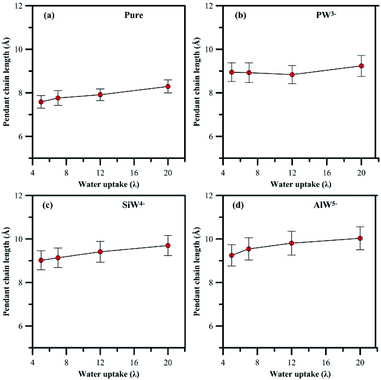 | ||
| Fig. 5 Variation in length of pendant side chain with hydration, (a) undoped membrane, (b–d) HPA doped membrane. | ||
In general, addition of HPA to a PFSA membrane influences the rigidity of the pendant chain and the phase segregation in the membrane, which are also sensitive to hydration. A clear view (Fig S4 and S5†) of the phase segregation in HPA doped Nafion® can be seen by comparing with a snapshot of undoped Nafion® at λ = 5.
 | (1) |
As described in the following sections, the formation of water clusters in the membrane was investigated to determine whether HPA particles facilitate the process.
3.2. Structure factor
To quantitatively evaluate the nanostructural arrangement of doped membranes and the size of water clusters inside the composite matrix, the structure factor, S(k), was obtained by Fourier transform of a pair distribution function for oxygen atoms in water molecules using the following equation:
 | (2) |
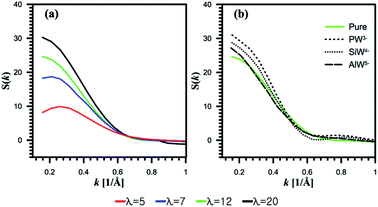 | ||
| Fig. 7 Structure factor S(k) for oxygen of water molecules. (a) Undoped systems. (b) HPA doped systems at λ = 12. | ||
It is found that the peak position at λ = 12 is slightly affected by the addition of AlW5− (Fig. 7b). However, as the anionic charge decreases, the peaks shift to lower k and their intensities dramatically increase for both SiW4− and PW3−. This observation indicates that the center of the mass distance between water clusters increases with the anionic charge. The hydrophilic HPA particles can bridge the hydrophilic domain to form continuous water domains. This observation agrees well with a SAXS experiment conducted by Herring et al.30
Furthermore, Meng et al.32 investigated a 3M ionomer doped with PW3− and SiW4− using SAXS measurements. They believed that HPA with a charge of −4 interacts differently with a PFSA membrane than HPA with a charge of −3. As discussed in Section 3.1, PW3− showed the highest hydration level; as a result, it can produce larger water clusters by merging water domains.
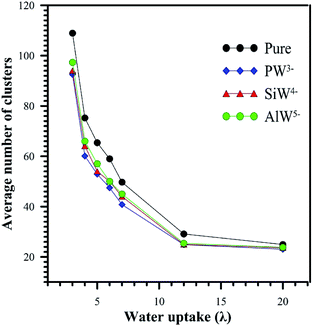
While the S(k) for water molecules yields valuable information about water clusters, analyzing the cluster size offers greater detail about the hydrophilic domains. In order to evaluate the cluster formation more effectively, the considered systems were re-simulated with higher hydration levels (λ = 3, 4, 5, 6, 7, 12, and 20). We considered H2O molecules to be part of the same cluster if the distance between their oxygen atoms was less than 3.5 Å. It should be mentioned that an isolated water molecule would be considered as a cluster when counting clusters.
The average number of clusters is shown in Fig. 8. For all systems, the average number of clusters decreases with increasing hydration. When the system was doped with HPA, an order of magnitude decrease in the number of water clusters was observed. At λ > 12, there is no significant difference in the average number of clusters between undoped and HPA doped Nafion®. As shown in Fig. 8, the average number of clusters for the AlW5−/Nafion system is higher than that for SiW4−/Nafion® for the same hydration level. The lowest average number of clusters was obtained for PW3−/Nafion®. This decrease in the number of clusters when the anionic charge decreases is attributed to better solvation of the least-charged PW3− anion (see Section 3.1). This can be verified from the range of maximum cluster sizes reported in Table 2. It is clearly observed from Table 2 that HPA particles can cause the formation of larger water clusters, particularly at low hydration levels.
![[thin space (1/6-em)]](https://www.rsc.org/images/entities/char_2009.gif) 000 collected configurations. N is the total number of water molecules
000 collected configurations. N is the total number of water molecules
| λ(N) | Pure | PW3− | SiW4− | AlW5− |
|---|---|---|---|---|
| 3 (1200) | 110 to 340 | 329 to 562 | 289 to 491 | 283 to 478 |
| 4 (1600) | 443 to 772 | 591 to 1011 | 549 to 989 | 539 to 891 |
| 5 (2000) | 720 to 1312 | 996 to 1514 | 880 to 1491 | 882 to 1501 |
| 6 (2400) | 2031 to 2309 | 2001 to 2400 | 2011 to 2388 | 1998 to 2369 |
| 7 (2800) | 2478 to 2778 | 2511 to 2800 | 2501 to 2800 | 2489 to 2793 |
| 12 (4800) | 3989 to 4800 | 4012 to 4789 | 3968 to 4798 | 3962 to 4800 |
| 20 (8000) | 7266 to 8000 | 7259 to 8000 | 7243 to 8000 | 7244 to 7996 |
The present simulation shows that there is no significant increase in the range of maximum cluster sizes at high hydration levels (λ > 7). These results confirm our aforementioned hypothesis about merging hydrophilic domains with HPA particles and provide an explanation for the experimentally observed property changes at lower water contents.32
The induced changes in the structure of hydrophilic domains might yield various diffusion rates for protons through conductive domains. Hence, the mobility of water molecules and hydronium ions in hydrophilic domains probably changes according to dopant charge. To further consider this statement, the transport properties of water molecules and hydronium ions are described in the next section.
3.3. Transport properties
 | (3) |
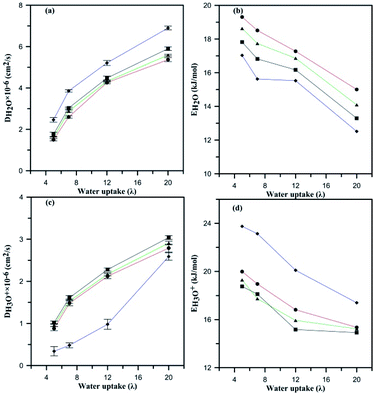
Fig. 9a demonstrates the effects of heteroatom alteration and subsequently the anionic charge of HPA on the diffusion of water. For all the considered composite membranes, the diffusion coefficient of water molecules increases with water uptake. One can see that the fastest molecular diffusion is observed for the AlW5−/Nafion membrane in spite of the lowest being recorded for PW3−/Nafion. Diffusion of water is reduced due to variation in the hydrophilic features of HPA. As discussed earlier, PW3− is the most hydrated particle in comparison with the other anions, which results in less mobility for water molecules. For instance, at λ = 12, the diffusion of water was 4.26 × 10⁻⁶, 4.32 × 10⁻⁶, and 4.48 × 10⁻⁶ cm2 s−1 for membranes containing PW3−, SiW4−, and AlW5−, respectively. Therefore, the anion with the greatest charge achieves the highest water diffusion coefficient. Fig. 9c compares hydronium diffusion in the undoped and doped membranes. Intuitively, one would imagine that the anions might disrupt the hydronium diffusion rate through attractive columbic interaction; however, this point of view is not in accordance with the present results. The hydronium diffusion coefficient increases if HPA particles are incorporated into Nafion® membrane. This observation is consistent with a study by Meng et al.32 for PW3− and SiW4− doped PFSA membranes. The mobility of hydronium ions increases with anionic charge; therefore, the maximum diffusion coefficient was observed for the AlW5−/Nafion composite membrane at all hydration levels. In other words, these negatively charged anions increase the participation of hydronium ions in hydrophilic domains (see Table S4†). Since a more negative anion attracts more hydronium ions, these particles increase the number of hydrogen-bonding networks in the PFSA membrane. These particles, i.e. HPAs, have usually been used in their hydrated form in experimental studies.19,46 It is worth mentioning that such hydrated particles were not added to PFSA membranes as a water reservoir; in fact, they improve the Grotthuss proton transport mechanism by installing a hydrogen bond network in the conductive domains of membranes. According to the experimental measurements performed by Tian and Savadogo19 as well as Meng et al.,32 proton conductivity increases on addition of HPA to the membrane. Since the Grotthuss mechanism is significantly faster than proton transport through diffusion of water molecules (the time associated with proton hopping is ∼1.5 ps (ref. 56 and 57)), it can be concluded that these particles improve proton conductivity through proton hopping or that the hydrophilic particles can cause slower vehicular transport by decreasing the water diffusion coefficient. Liu et al.33 argued that proton transport in HPA doped 3M ionomer membranes is faster than in the undoped one and that adding HPA may improve the proton hopping. When the hydronium diffusion rate was the same as that of water molecules, they observed a higher proton conductivity for doped 3M ionomer membrane with SiW4− in comparison with a PW3−/3M ionomer composite. This means that an anion with more charge may enhance proton transport through Grotthuss hopping by facilitating the formation of hydrogen bonding networks. It is also believed that an anion with a higher charge could provide appropriate conditions for proton transport by binding with a substantial number of protons in the conductive domains to overcome steric hindrance from sulfonic groups. However, classical MD is not able to probe the improvement in Grotthuss hopping due to its inability to investigate hydrogen bond breaking and cleavage. On the other hand, it is assumed that such particles may reduce the activation energy for hydronium and water diffusion as discussed in the next section.
 | (4) |
The slopes of linear fits provide the Ea for hydronium ions and water molecules as represented in Fig. 9b and d. The Ea for hydronium decreases with hydration and anionic charge as seen in Fig. 9d. A significant decrease in Ea for hydronium ions is observed at λ = 20 in comparison with λ = 5 for the PW3−/Nafion composite membrane, which follows a similar trend to the SiW4−/Nafion and AlW5−/Nafion systems. The influence of anionic charge on the Ea of hydronium ions is also significant. As the figure displays, the hydronium activation energy decreases from undoped Nafion to doped for PW3−/Nafion, SiW4−/Nafion, and AlW5−/Nafion. The values of Ea at λ = 5 are 23.75, 20, 19.30, and 18.76 kcal mol−1, respectively, and 20.10, 16.82, 15.93, and 15.17 kcal mol−1, respectively, at λ = 12. This significant decrease in the Ea of hydronium diffusion is due to the water-mediated interaction of hydronium with the HPA anion (as discussed earlier) and an increase in the self-diffusion of hydronium. In fact, the HPA anions overcome steric hindrance from the sulfonic groups and consequently facilitate the diffusion of H3O+.
The Ea of water molecules for undoped Nafion decreases with increasing hydration, as shown in Fig. 9b, in agreement with experimental observation58 and simulation results for PFSA membranes.49 The diffusion barrier for water molecules at λ = 5 for undoped Nafion® 117 is 17.03 kcal mol−1, which is comparable with Kreuer's reported value, which is 19.77 kcal mol−1 (ref. 58) (in addition, an Ea of 18.8 kcal mol−1 at λ = 6 has been reported by Venkatnathan et al.49). The addition of HPA particles to Nafion increases the Ea of water molecules at all hydration levels. This means that the proton transport rate through vehicular mechanisms may decrease when the membrane is doped with HPA particles. The Ea of water molecules for the composite membrane increases by a factor of 0.035 from n = −5 to n = −4 at λ = 5. A decrease in the anionic charge from n = −4 to n = −3 also increases the Ea of water molecules by a factor of 0.043. In general, the Ea of water molecules decreases when the anionic charge increases.
Conclusions
In summary, an attempt has been made in the present work to describe the observation of heteropoly acids (HPA) by MD simulation at different hydration levels in Nafion®. It is believed that any type of HPA may have a specific effect on the performance of fuel cell membranes; therefore, Nafion® was doped with three different Keggin HPAs, which had anions with various charges.The HPA anionic charge influences the morphology of PFSA polymer and hydronium ion mobility, which are further sensitive to hydration. It was found in general that fewer hydronium ions and more water molecules solvate the sulfonic groups for systems with higher anionic charges of HPA. Also, the separation distance between sulfur atoms increases. The presence of HPA particles in the Nafion® membrane compared to the undoped one results in an 18–22% longer rigid side-chain pendant. The phase segregation is partially the result of this inflexibility of the pendant side chain.
The influence of HPA on the structure factor of water molecules is found to be significant. The center distance between water clusters was found to increase upon addition of HPA due to the hydrophilic features of such particles. From radial distribution functions and structure factor analysis, it was concluded that a higher water content resides near an anion with less charge, which enhances the center distance between water clusters by bridging the hydrophilic domains. The HPA particles reduce the average number of water clusters and increase their size. An increase in anionic charge from −3 to −5 results in a decrease in the size of water clusters at all hydration levels.
A HPA/Nafion® membrane showed lower water mobility than undoped Nafion® at all hydration levels. The hydronium self-diffusion coefficient for HPA doped membranes is greater than for undoped Nafion®. The anionic charge has a significant effect on the diffusion coefficients, so that the greatest hydronium diffusion and least water diffusion is achieved for the highest-charged anion. From this unexpected behavior of proton and water diffusion, it was implied that the Grotthuss hopping mechanism was enhanced for the highest-charged anion.
For HPA doped membranes, the activation energy of water diffusion increased, while that of hydronium diffusion decreased. The presence of phosphotungstic acid (anion with 3−) particles in the Nafion® compared to the undoped membrane results in an approximately 12–20% lower activation energy of hydronium diffusion at a specific hydration level. An increase in anionic charge from −3 to −5 results in a decrease in the activation energy of hydronium diffusion at all hydration levels. Finally, this study can conclude that the highest-charged anion showed better proton conductivity for fuel cell membranes, and the least-charged anion can achieve better water uptake in agreement with other experimental studies.
Conflicts of interest
There are no conflicts to declare.Acknowledgements
We would like to thank Dr Venkat Ganesan of the University of Texas at Austin for his helpful advice in improving this article.References
- R. Borup, J. Meyers, B. Pivovar, Y. S. Kim, R. Mukundan, N. Garland, D. Myers, M. Wilson, F. Garzon, D. Wood, P. Zelenay, K. More, K. Stroh, T. Zawodzinski, J. Boncella, J. E. McGrath, M. Inaba, K. Miyatake, M. Hori, K. Ota, Z. Ogumi, S. Miyata, A. Nishikata, Z. Siroma, Y. Uchimoto, K. Yasuda, K.-i. Kimijima and N. Iwashita, Chem. Rev., 2007, 107, 3904–3951 CrossRef CAS PubMed.
- K. B. Prater, J. Power Sources, 1994, 51, 129–144 CrossRef CAS.
- R. K. A. M. Mallant, J. Power Sources, 2003, 118, 424–429 CrossRef CAS.
- K. Kreuer, J. Membr. Sci., 2001, 185, 29–39 CrossRef CAS.
- L. Li, J. Zhang and Y. Wang, J. Membr. Sci., 2003, 226, 159–167 CrossRef CAS.
- B. Yang and A. Manthiram, Electrochem. Solid-State Lett., 2003, 6, A229–A231 CrossRef CAS.
- B. Yang and A. Manthiram, J. Power Sources, 2006, 153, 29–35 CrossRef CAS.
- C. V. Mahajan and V. Ganesan, J. Phys. Chem. B, 2010, 114, 8357–8366 CrossRef CAS PubMed.
- J. C. Tsai, H. P. Cheng, J. F. Kuo, Y. H. Huang and C. Y. Chen, J. Power Sources, 2009, 189, 958–965 CrossRef CAS.
- B. Lafitte, L. E. Karlsson and P. Jannasch, Macromol. Rapid Commun., 2002, 23, 896–900 CrossRef CAS.
- L. E. Karlsson and P. Jannasch, J. Membr. Sci., 2004, 230, 61–70 CrossRef CAS.
- Y. Woo, S. Y. Oh, Y. S. Kang and B. Jung, J. Membr. Sci., 2003, 220, 31–45 CrossRef CAS.
- N. Asano, M. Aoki, S. Suzuki, K. Miyatake, H. Uchida and M. Watanabe, J. Am. Chem. Soc., 2006, 128, 1762–1769 CrossRef CAS PubMed.
- D. R. Vernon, F. Meng, S. F. Dec, D. L. Williamson, J. A. Turner and A. M. Herring, J. Power Sources, 2005, 139, 141–151 CrossRef CAS.
- J. L. Malers, M.-A. Sweikart, J. L. Horan, J. A. Turner and A. M. Herring, J. Power Sources, 2007, 172, 83–88 CrossRef CAS.
- Y. S. Kim, F. Wang, M. Hickner, T. A. Zawodzinski and J. E. McGrath, J. Membr. Sci., 2003, 212, 263–282 CrossRef CAS.
- S. Malhotra and R. Datta, J. Electrochem. Soc., 1997, 144, L23–L26 CrossRef CAS.
- P. Staiti, A. S. Aricò, V. Baglio, F. Lufrano, E. Passalacqua and V. Antonucci, Solid State Ionics, 2001, 145, 101–107 CrossRef CAS.
- H. Tian and O. Savadogo, Fuel Cells, 2005, 5, 375–382 CrossRef CAS.
- H. Tian and O. Savadogo, J. New Mater. Electrochem. Syst., 2006, 9, 61 CAS.
- V. Ramani, H. R. Kunz and J. M. Fenton, J. Membr. Sci., 2004, 232, 31–44 CrossRef CAS.
- B. Tazi and O. Savadogo, J. New Mater. Electrochem. Syst., 2001, 4, 187–196 CAS.
- F. Leroy, P. Miró, J. M. Poblet, C. Bo and J. Bonet Ávalos, J. Phys. Chem. B, 2008, 112, 8591–8599 CrossRef CAS PubMed.
- X. López, C. Nieto-Draghi, C. Bo, J. B. Avalos and J. M. Poblet, J. Phys. Chem. A, 2005, 109, 1216–1222 CrossRef PubMed.
- Y.-K. Choe, E. Tsuchida, T. Ikeshoji, S. Yamakawa and S.-a. Hyodo, Phys. Chem. Chem. Phys., 2009, 11, 3892–3899 RSC.
- R. Devanathan and M. Dupuis, Phys. Chem. Chem. Phys., 2012, 14, 11281–11295 RSC.
- R. Devanathan, A. Venkatnathan and M. Dupuis, J. Phys. Chem. B, 2007, 111, 13006–13013 CrossRef CAS PubMed.
- R. Devanathan, A. Venkatnathan and M. Dupuis, J. Phys. Chem. B, 2007, 111, 8069–8079 CrossRef CAS PubMed.
- T. Mabuchi and T. Tokumasu, J. Chem. Phys., 2014, 141, 104904 CrossRef PubMed.
- S. V. Sambasivarao, Y. Liu, J. L. Horan, S. Seifert, A. M. Herring and C. M. Maupin, J. Phys. Chem. C, 2014, 118, 20193–20202 CAS.
- G. M. Haugen, F. Meng, N. V. Aieta, J. L. Horan, M.-C. Kuo, M. H. Frey, S. J. Hamrock and A. M. Herring, Electrochem. Solid-State Lett., 2007, 10, B51–B55 CrossRef CAS.
- F. Meng, N. V. Aieta, S. F. Dec, J. L. Horan, D. Williamson, M. H. Frey, P. Pham, J. A. Turner, M. A. Yandrasits, S. J. Hamrock and A. M. Herring, Electrochim. Acta, 2007, 53, 1372–1378 CrossRef CAS.
- Y. Liu, S. V. Sambasivarao, J. L. Horan, Y. Yang, C. M. Maupin and A. M. Herring, J. Phys. Chem. C, 2014, 118, 854–863 CAS.
- S. J. Paddison and J. A. Elliott, J. Phys. Chem. A, 2005, 109, 7583–7593 CrossRef CAS PubMed.
- G. W. T. M. J. Frisch, H. B. Schlegel, G. E. Scuseria, M. A. Robb, J. R. Cheeseman, G. Scalmani, V. Barone, B. Mennucci, G. A. Petersson, H. Nakatsuji, M. Caricato, X. Li, H. P. Hratchian, A. F. Izmaylov, J. Bloino, G. Zheng, J. L. Sonnenberg, M. Hada, M. Ehara, K. Toyota, R. Fukuda, J. Hasegawa, M. Ishida, T. Nakajima, Y. Honda, O. Kitao, H. Nakai, T. Vreven, J. A. Montgomery Jr, J. E. Peralta, F. Ogliaro, M. Bearpark, J. J. Heyd, E. Brothers, K. N. Kudin, V. N. Staroverov, R. Kobayashi, J. Normand, K. Raghavachari, A. Rendell, J. C. Burant, S. S. Iyengar, J. Tomasi, M. Cossi, N. Rega, J. M. Millam, M. Klene, J. E. Knox, J. B. Cross, V. Bakken, C. Adamo, J. Jaramillo, R. Gomperts, R. E. Stratmann, O. Yazyev, A. J. Austin, R. Cammi, C. Pomelli, J. W. Ochterski, R. L. Martin, K. Morokuma, V. G. Zakrzewski, G. A. Voth, P. Salvador, J. J. Dannenberg, S. Dapprich, A. D. Daniels, O. Farkas, J. B. Foresman, J. V. Ortiz, J. Cioslowski and D. J. Fox, Gaussian, Inc., Wallingford CT, 2009.
- C. M. Breneman and K. B. Wiberg, J. Comput. Chem., 1990, 11, 361–373 CrossRef CAS.
- S. S. Jang, V. Molinero, T. Çaǧın and W. A. Goddard, J. Phys. Chem. B, 2004, 108, 3149–3157 CrossRef CAS.
- M. Levitt, M. Hirshberg, R. Sharon, K. E. Laidig and V. Daggett, J. Phys. Chem. B, 1997, 101, 5051–5061 CrossRef CAS.
- U. Essmann, L. Perera, M. L. Berkowitz, T. Darden, H. Lee and L. G. Pedersen, J. Chem. Phys., 1995, 103, 8577–8593 CrossRef CAS.
- M. C. Payne, M. P. Teter, D. C. Allan, T. A. Arias and J. D. Joannopoulos, Rev. Mod. Phys., 1992, 64, 1045–1097 CrossRef CAS.
- M. P. Allen, Computational Soft Matter: From Synthetic Polymers to Proteins, 2004, vol. 23, pp. 1–28 Search PubMed.
- I. T. Todorov, W. Smith, K. Trachenko and M. T. Dove, J. Mater. Chem., 2006, 16, 1911–1918 RSC.
- H. J. C. Berendsen, J. P. M. Postma, W. F. van Gunsteren, A. DiNola and J. R. Haak, J. Chem. Phys., 1984, 81, 3684–3690 CrossRef CAS.
- W. G. Hoover, Phys. Rev. A, 1986, 34, 2499–2500 CrossRef.
- D. Wu, S. J. Paddison, J. A. Elliott and S. J. Hamrock, Langmuir, 2010, 26, 14308–14315 CrossRef CAS PubMed.
- V. Ramani, H. R. Kunz and J. M. Fenton, Electrochim. Acta, 2005, 50, 1181–1187 CrossRef CAS.
- A. Venkatnathan, R. Devanathan and M. Dupuis, J. Phys. Chem. B., 2007, 111, 7234–7244 CrossRef CAS PubMed.
- G. A. Tsigdinos, Top. Curr. Chem., 1978, 1–64 CAS.
- A. P. Sunda and A. Venkatnathan, J. Mater. Chem. A, 2013, 3, 557–569 Search PubMed.
- A. P. Sunda and A. Venkatnathan, Soft Matter, 2012, 42, 10827–10836 RSC.
- G. Gebel, Polymer, 2000, 41, 5829–5838 CrossRef CAS.
- J. A. Elliott, S. Hanna, A. M. S. Elliott and G. E. Cooley, Macromolecules, 2000, 33, 4161–4171 CrossRef CAS.
- P. J. James, J. A. Elliott, T. J. McMaster, J. M. Newton, A. M. S. Elliott, S. Hanna and M. J. Miles, J. Mater. Sci., 2000, 35, 5111–5119 CrossRef CAS.
- M. D. Heaney and J. Pellegrino, J. Membr. Sci., 1989, 47, 143–161 CrossRef CAS.
- M. Allen and D. J. Tildesley, in Molecular Simulation of Liquids, Clarendon, Oxford, 1987 Search PubMed.
- U. W. Schmitt and G. A. Voth, J. Chem. Phys., 1999, 111, 9361–9381 CrossRef CAS.
- M. Tuckerman, K. Laasonen, M. Sprik and M. Parrinello, J. Chem. Phys., 1995, 103, 150–161 CrossRef CAS.
- K. Kreuer, Solid State Ionics, 1997, 97, 1–15 CrossRef CAS.
Footnote |
| † Electronic supplementary information (ESI) available: The full set of partial charges are listed in Table S1. Total number of particles in each simulation are provided in Table S2. The final calculated densities are listed in Table S3. Table S4 represents the percent of hydronium ions which located at outside the first solvation shell of side chains. The diffusion coefficients of hydronium ions and water are tabulated in Tables S5 and S6 respectively. See DOI: 10.1039/c7ra05929a |
| This journal is © The Royal Society of Chemistry 2017 |

