 Open Access Article
Creative Commons Attribution 3.0 Unported Licence
Novel graphitic carbon coated IF-WS2 reinforced poly(ether ether ketone) nanocomposites
Nannan
Wang
a,
Zhuxian
Yang
a,
Kunyapat
Thummavichai
a,
Fang
Xu
b,
Chenxi
Hu
b,
Hongmei
Chen
c,
Yongde
Xia
 a and
Yanqiu
Zhu
 *a
*a
aCollege of Engineering, Mathematics and Physical Sciences, University of Exeter, Exeter, EX4 4QF, UK. E-mail: y.zhu@exeter.ac.uk; Tel: +44 (0)1392 723620
bFaculty of Engineering, The University of Nottingham, Nottingham, NG7 2RD, UK
cSchool of Materials Science and Engineering, Jiangsu University of Science and Technology, No. 2 Mengxi Road, Zhenjiang, 212003, China
First published on 13th July 2017
Abstract
Unique high performance thermoplastic PEEK ternary nanocomposites reinforced by nano graphitic carbon coated IF-WS2 (inorganic fullerene-like tungsten disulphide) have been prepared and their structures have been characterised by electron microscopy imaging, electron dispersive spectrum elemental and X-ray diffraction scanning. The IF-WS2@C–PEEK composites exhibit impressive improvements in both their mechanical and thermal properties, with an extraordinary 54% enhancement in the ultimate tensile strength at 2 wt% and a nearly 235% increase in thermal conductivity at 8 wt%. In addition, they also show an increase in decomposition temperature (over 50 °C) with higher IF-WS2@C contents. Further investigation reveals the activation energies estimated by the Kissinger method to be 61 and 97 kJ mol−1 for neat PEEK and IF-WS2@C–PEEK, respectively. This is ascribed to the enhanced dispersion ability and better interface bonding between the PEEK matrix and IF-WS2@C nanoparticles, which for the first time has been investigated by FTIR and XPS analysis. These significantly improved properties will no doubt expand the applications of the PEEK-based nanocomposites.
1. Introduction
Recently, the thermoplastic poly(ether ether ketone) (PEEK) has emerged as an important class of high performance engineering material due to its excellent properties, including outstanding high mechanical strength, extra-low thermal conductivity, incomparable chemical resistance to acid and alkali corrosion, prodigious shock absorbing performance, good thermal stability and worthy biocompatibility.1,2 To further enhance the potential of PEEK, the concept of a composite is a logical and effective strategy, as proved for numerous polymeric matrices. By combining different phases together using various mixing techniques, e.g. sonication dispersion,3 surface modification,4 and the surfactant assisted method,5 a PEEK composite can be the result. In this regard, the challenges are twofold: the selection of the right reinforcement phase which can form a strong interface with PEEK and the uniform dispersion within the PEEK matrix.Amongst the diverse choices for the reinforcement, carbon-based nanomaterials and inorganic fullerene-like tungsten disulphide (IF-WS2) nanoparticles have attracted the most attention. As the most studied materials in past decades, carbon nanotubes (CNTs) and graphene have been explored in various polymer matrices,6,7 including PEEK. Meanwhile, owing to their outstanding properties, such as superb shock resistance, high thermal stability and conductivity, and excellent lubricant performance,8–10 IF-WS2/PEEK composites have also been investigated recently. For example, Hou et al. used an aerosol-assisted deposition method to combine IF-WS2 into PEEK coatings and reported a significant reduction in the coefficient of friction of 60% against plain PEEK films.11 Naffakh et al. investigated IF-WS2/PEEK composites, and achieved an increase in the initial degradation temperature of up to 60 °C and a 31% improvement in the storage modulus.12 Further attempts to combine carbon and IF-WS2 nano-reinforcements have also been documented recently and could lead to more interesting properties, such as the PEEK/SWCNT/IF-WS2 hybrid composites prepared by Gomez-Fatou's group.13 Choi et al. demonstrated that 2H-WS2/C mixed composite powders had superior electrochemical properties.14 It was found that the introduced carbon not only further enhanced the mechanical and thermal properties, but also showed extraordinary semiconducting behaviour. However, their 2H-WS2/C mixture experienced an issue of carbon separation from the WS2 flakes, which complicated the situation and restricted their use as an ideal enhancement phase for ternary PEEK composites. More difficult than the binary system, ternary phased composites will face a more severe challenge to achieve a uniform nanofiller dispersion within the PEEK matrix.15–17 Hence, preparing a WS2/C composite reinforcement phase, rather than using two separate reinforcements, appears to be an effective way to counteract the dispersion issue. Whitby et al. reported a 2H-WS2-coated CNT composite phase with an exposed WS2 layer to delay the oxidation process of CNTs significantly,18 but unfortunately, even though there was a good interface bonding between the WS2 and CNTs, the dispersion ability of the WS2 within the PEEK matrix still restricts their applications.
Given the abundant amount of literature associated with carbon-based CNTs and graphene,19–21 which can be used to assist in tackling the dispersion and interface issues, alternative carbon coated IF-WS2 nanomaterials would therefore be very interesting to explore. Indeed, Xu et al. have documented such IF-WS2@C nanoparticles, and importantly they have realised large-scale production by using a rotary tube furnace,22 which makes investigation of such composites possible. Furthermore, the thermal stability of the IF-WS2@C nanoparticles (NPs) has been significantly improved.23 The introduction of a new nano carbon coating could further help to improve the dispersion of IF-WS2 (NPs) and the interface adhesion with the PEEK matrix, generating composites with improved properties. However, this sort of investigation has yet to be conducted, and the advantages of the IF-WS2@C NPs as a reinforcement in a PEEK matrix have yet to be validated experimentally. In this article, we demonstrate how to fabricate well-dispersed IF-WS2@C NPs in a PEEK matrix to generate a ternary composite, and then explain the mechanism for using the IF-WS2@C NPs as the composite reinforcement phase, and finally discuss the improved mechanical and thermal properties of the resulting ternary IF-WS2@C–PEEK nanocomposites.
2. Experimental
Tungsten trioxide (WO3) nanoparticles of average size ca. 40–50 nm (Nanina Advanced Materials Co. Ltd, China), and zero grade of Ar and H2S gases (BOC Ltd, UK) were used for the IF-WS2 synthesis. Analytical grade (99.99%) styrene, ethanol and acetone (Fisher-Scientific, UK) were used for the creation of the carbon coating. The 450PF PEEK powder was ordered from VICTREX PEEK Polymer Ltd, UK.By fine tuning the RCVD process that we reported earlier,22 we produced the IF-WS2 NPs first during the solid–gas reaction stage, and then achieved uniform carbon coating after the CVD stage.23 Briefly, to achieve a nanoscale highly graphitic and layered carbon coating, the ratio of the acetone and styrene mixed solution, its injection rate and the reaction time and temperature all need to be controlled. After numerous experiments, we adopted an optimal set of parameters of a solution volume ratio of 4![[thin space (1/6-em)]](https://www.rsc.org/images/entities/char_2009.gif) :
:![[thin space (1/6-em)]](https://www.rsc.org/images/entities/char_2009.gif) 1 at a 2 ml h−1 injection rate, at 700–900 °C under Ar atmosphere. 30 and 60 min durations were studied, and the resulting samples were named IF-WS2@C-30 and IF-WS2@C-60, respectively.
1 at a 2 ml h−1 injection rate, at 700–900 °C under Ar atmosphere. 30 and 60 min durations were studied, and the resulting samples were named IF-WS2@C-30 and IF-WS2@C-60, respectively.
The IF-WS2@C–PEEK nanocomposite and the complementary IF-WS2–PEEK composite were all prepared by liquid mixing and re-melting. A volume ratio (1![[thin space (1/6-em)]](https://www.rsc.org/images/entities/char_2009.gif) :
:![[thin space (1/6-em)]](https://www.rsc.org/images/entities/char_2009.gif) 1) of ethanol and distilled water solution was used to disperse the PEEK and IF-WS2@C powders at IF-WS2@C fractions of 2, 4, and 8 wt%, respectively, without involving any surfactants. Firstly, the IF-WS2@C NPs and PEEK powders were separately dispersed in 100 ml of the alcohol–water solution, followed by vigorous magnetic stirring for 1 h. Secondly, the two well-dispersed suspensions were mixed together under a powerful ultrasonic-probe treatment for 15 min, which was then subjected to 1 h of vigorous magnetic stirring to further mix the powders, followed by heating with a hot plate at 120 °C under continuous stirring to remove the solvent. Thirdly, the resulting powders were dried in an oven at 160–180 °C overnight, to completely remove the solvent. Fourthly, the powders were transferred onto a glass slide which was sitting on a hot plate at 370 to 400 °C in the open air, and a thin film was formed after the powders had melted completely in a few minutes. The glass slide with the thin film was removed from the hot plate and cooled down naturally on the surface of a marble block. Finally, the IF-WS2@C–PEEK thin film nanocomposite was easily peeled off, for further investigations.
1) of ethanol and distilled water solution was used to disperse the PEEK and IF-WS2@C powders at IF-WS2@C fractions of 2, 4, and 8 wt%, respectively, without involving any surfactants. Firstly, the IF-WS2@C NPs and PEEK powders were separately dispersed in 100 ml of the alcohol–water solution, followed by vigorous magnetic stirring for 1 h. Secondly, the two well-dispersed suspensions were mixed together under a powerful ultrasonic-probe treatment for 15 min, which was then subjected to 1 h of vigorous magnetic stirring to further mix the powders, followed by heating with a hot plate at 120 °C under continuous stirring to remove the solvent. Thirdly, the resulting powders were dried in an oven at 160–180 °C overnight, to completely remove the solvent. Fourthly, the powders were transferred onto a glass slide which was sitting on a hot plate at 370 to 400 °C in the open air, and a thin film was formed after the powders had melted completely in a few minutes. The glass slide with the thin film was removed from the hot plate and cooled down naturally on the surface of a marble block. Finally, the IF-WS2@C–PEEK thin film nanocomposite was easily peeled off, for further investigations.
To appraise the quality of the IF-WS2@C NPs and their PEEK composites, combined characterisation techniques were used. XRD patterns were acquired using a Bruker D8 Advance diffractometer, with Cu Kα (Ni-filtered 0.02) radiation at λ = 0.15418 nm, scanned from 10 to 50° of 2θ range with a step size of 0.05°. A JEM-2100 TEM working at 200 kV was used to obtain the HRTEM images for IF-WS2@C NPs. In addition, a JEM-1400 TEM operating at 120 kV and a HITACHI S3200N SEM (operating at 20 kV, equipped with EDS) were used to acquire electron images for polymer composite structural analyses. All composite TEM samples were cut using a microtome with a fine diamond blade into thin films of ca. 100 nm thick. The Fourier transform infrared spectra (FTIR) were obtained from a Thermo Fisher Scientific Nicolet IR machine. The sample for the FTIR was prepared with a scalpel as a round thin film with a diameter of 2 mm and a thickness of 50 μm. The X-ray photoelectron spectra (XPS) were recorded by a VG ESCALab Mark II photoelectron spectroscope using Al K-alpha X-rays as an excitation source with a wavelength of 1486.6 eV, working at an emission current of 20 mA with an anode potential of 12 kV. Thermogravimetric analyses (TGA) were carried out on a TA-SDT Q600D machine, from room temperature to 800 °C at a heating rate of 10 °C min−1 under an air flow of 100 cm3 min−1. A NETZSCH LFA 467 HypeFlash facility was used to analyse the thermal conductivities of the IF-WS2@C–PEEK nanocomposites, using a specimen size of 10 × 10 mm and a thickness of ca. 0.5 mm. The influence of the different IF-WS2@C contents on the thermal conductivity of the composites was evaluated at 25 °C.
Finally, we carried out tensile and hardness tests to evaluate the reinforcing effects of the composites, against the plain PEEK samples. The tensile property was measured on a Lloyd Instruments tensile test machine at a pulling rate of 5 mm min−1, using a specimen size of 50 × 5 × 0.5 mm and a gauge length of 30 mm. The Vickers hardness assessments were carried out on a Leco V-100-AZ Hardness Tester at room temperature, using a load of 500 g with a dwell time of 25 s. 5 tests were recorded for each specimen.
3. Results and discussion
The XRD patterns of the IF-WS2@C NPs, as well as the pristine IF-WS2 NPs, synthesised at 775 °C are shown in Fig. 1a, and all peaks labelled with a triangle match the major peaks of IF-WS2.23 The peak with the highest intensity occurred at 2θ = 14.3° corresponding to the (002) plane of WS2, which is also prominent in the IF-WS2@C NPs. In the enlarged pattern of Fig. 1a, a tiny peak is visible at 26.2°, which is attributed to the (002) plane of graphitic carbon. The low (002) intensity ratio between carbon and IF-WS2, i.e. the weak (002) graphitic peak, is owing to the small amount of carbon in the IF-WS2@C NPs. For the same reason, the carbon content difference between the IF-WS2@C-30 and the IF-WS2@C-60 samples, as well as their graphitic level, cannot be clearly recognised under XRD, due to its resolution limit.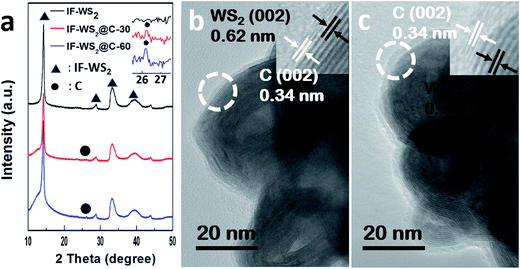 | ||
| Fig. 1 (a) XRD patterns of pristine IF-WS2 and IF-WS2@C NPs, with the inset showing the weak (002) peaks around 26°; (b and c) the HR-TEM images of IF-WS2@C-30 and IF-WS2@C-60 NPs. | ||
The TEM images, however, can reveal the different coating thicknesses between the long and short time coated IF-WS2@C NPs, as shown in Fig. 1b and c. Both Fig. 1b and c exhibit the bright contrast C layer and the dark IF-WS2 core of a polygonal cage structure. The corresponding high resolution TEM images in the insets of Fig. 1b and c further show the lattice distance of 0.62 nm for the dark core part and 0.34 nm for the bright surface layer, which correspond to the (002) plane of WS2 and graphitic carbon, respectively. The high resolution TEM images also show that the continuous C-coating is around 1 nm thick for IF-WS2@C-30 and 2 nm for the IF-WS2@C-60. These results demonstrate that the quality of the IF-WS2@C NPs produced by the current RCVD process is high and uniform and with a controllable C-coating thickness. Thus we have confidence in them being used as reinforcement in a PEEK matrix.
Prior to the melting process, we examined the PEEK and PEEK with differently mixed NP powders using XRD, as shown in Fig. 2a and b, for comparison with their sintered composites. For the IF-WS2@C-30–PEEK powder diffraction patterns, the strong peak at ca. 14° corresponding to the (002) plane of the WS2 (Fig. 1a) was observed in the nanocomposites, and its relative intensity increased with increasing IF-WS2 concentrations. The three peaks appearing at 20.8, 22.8 and 28.9° were the characteristic diffractions of the (110), (113) and (200) planes of PEEK, respectively. These peaks all became sharper and stronger after sintering for both the neat PEEK and their nanocomposites, compared with the powder mixtures, which is believed to be raised through crystal growth and thus has better crystallisation. Almost identical features also occurred for the IF-WS2@C-60–PEEK samples (Fig. 2c and d). By examining the full width at half maximum (FWHM) of the (110) peak in Fig. 2b and d for the sintered samples, it is clear that the peak became broader at higher IF-WS2@C content. A broadened peak indicated a shrinkage of the crystalline sizes. The dispersion of IF-WS2@C NPs in the PEEK matrix would promote nucleus formation and possibly physically hinder the growth of the PEEK spherulitic crystals.24 Therefore, with increasing content of the IF-WS2@C NPs, more IF-WS2@C NPs would be able to act as tiny primary cores and promote the recrystallization of PEEK, leading to the slightly enlarged FWHM values. This result indirectly confirmed the good quality of dispersion of the NPs, because a poor and heavily agglomerated dispersion at a high NP fraction would not be able to generate such a crystalline reduction impact. Direct morphological analyses will follow.
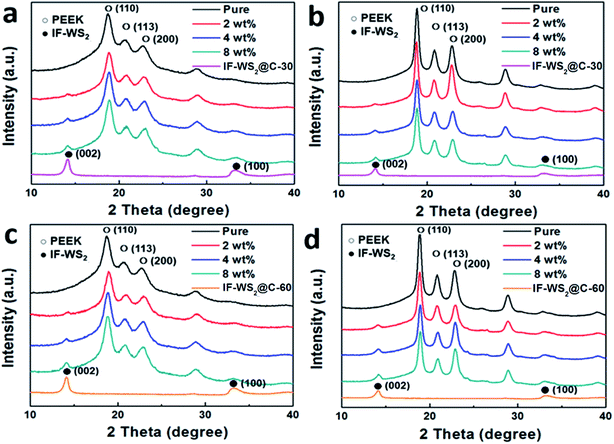 | ||
| Fig. 2 XRD patterns of powdered mixtures of IF-WS2@C–PEEK before (a and c), and after (b and d) sintering crystallisation. | ||
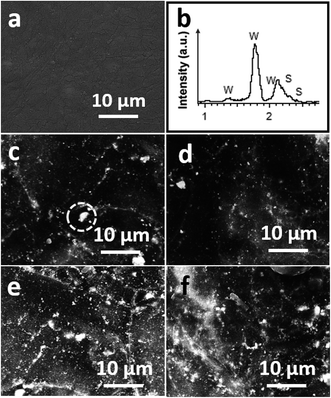
The neat PEEK after melting showed a smooth surface, consisting of large irregular spherulites which were formed of many tiny granular structures, as shown in the SEM images in Fig. 3a. The bright spots with high contrast in the back-scatter SEM images in Fig. 3c and d for the 2 wt% IF-WS2@C-30 and IF-WS2@C-60 PEEK composites, respectively, originated from the IF-WS2@C NPs, as further confirmed by the EDS (Fig. 3b). The IF-WS2@C NPs appeared to be very well distributed within the matrix for both IF-WS2@C-30 and IF-WS2@C-60 NPs. At 8 wt% NPs addition, the distribution of the high contrast spots looked consistently homogenous, without obvious agglomeration. Fig. 3e and f display the 8 wt% IF-WS2@C-30–PEEK and IF-WS2@C-60–PEEK composites. Although we could not clearly establish a statistical link between the IF-WS2@C contents and the spherulite sizes based on the limited number of images, it is evident that the bright IF-WS2@C NPs were well-dispersed and embedded inside the PEEK spherulites. This will be further evaluated by the effect on their mechanical properties.
Our TEM analyses were carried out at 120 kV to avoid structural damage to the polymer by the electron beam. As shown in Fig. 4a, the granular structure of the dark IF-WS2@C was easily visible against the bright PEEK matrix that was exhibited as irregular spherulitic structures. At low concentration (2 wt%), the IF-WS2@C-30–PEEK exhibited a similar distribution characteristic to the IF-WS2@C-60–PEEK sample, appearing as individual NPs (Fig. 4b and d) mixed with clusters of small agglomerations (Fig. 4a and c). Whilst individual NPs were embedded in the centre of the spherulites, the clusters were also seen as a core surrounded by the spherulite, as shown in Fig. 4a. Even at 8 wt%, the distribution of IF-WS2@C NPs was still fairly homogenous at the micrometre scale (Fig. 4e). The similar distribution behaviours between the IF-WS2@C-30–PEEK and IF-WS2@C-60–PEEK NPs have convincingly demonstrated that a carbon coating was indeed formed in the composites, and the carbon–PEEK interaction dominated the interface process, regardless of the inside content of IF-WS2. This result is very useful, as vast opportunities could be opened up for tailoring desired properties of nanocomposites by using this facile carbon coating strategy on different NPs.
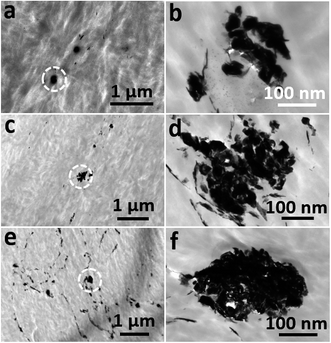 | ||
| Fig. 4 TEM images of (a and b) 2 wt% IF-WS2@C-30–PEEK; (c and d) 2 wt% IF-WS2@C-60–PEEK and (e and f) 8 wt% IF-WS2@C-60–PEEK nanocomposites. | ||
The interface interaction was investigated using FTIR and XPS spectra, on two sets of samples (IF-WS2@C-30–PEEK and IF-WS2@C-60–PEEK) with different NP concentrations. The peaks at 1658 cm−1 and 1240 cm−1 in the FTIR spectra shown in Fig. 5a belonged to the keto group, originating from the vibration of carboxylic acid of C![[double bond, length as m-dash]](https://www.rsc.org/images/entities/char_e001.gif) O stretching. The three peaks around 1591 cm−1, 1493 cm−1 and 1363 cm−1 were ascribed to the C–H band of in-plane bending benzene vibration, and other peaks at 946 cm−1, 840 cm−1 and 764 cm−1 were assigned to the out-of-plane bending vibration of the benzene ring. The band at 1157 cm−1 originated from the ether linkage (C–O).25 All these similar FTIR spectra were based on features of the PEEK, indicating that the original PEEK structure was not damaged by the inclusion of IF-WS2@C NPs. The IF-WS2@C NPs features were not reflected in this technique.
O stretching. The three peaks around 1591 cm−1, 1493 cm−1 and 1363 cm−1 were ascribed to the C–H band of in-plane bending benzene vibration, and other peaks at 946 cm−1, 840 cm−1 and 764 cm−1 were assigned to the out-of-plane bending vibration of the benzene ring. The band at 1157 cm−1 originated from the ether linkage (C–O).25 All these similar FTIR spectra were based on features of the PEEK, indicating that the original PEEK structure was not damaged by the inclusion of IF-WS2@C NPs. The IF-WS2@C NPs features were not reflected in this technique.
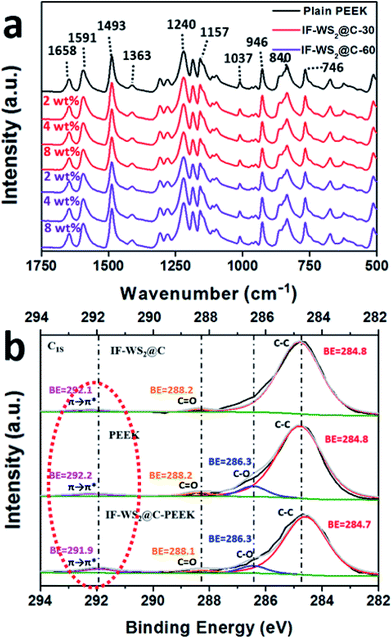 | ||
| Fig. 5 (a) FTIR spectra and (b) XPS results of the C1s of the IF-WS2@C and its derived PEEK nanocomposites. | ||
Further XPS investigations, as shown in Fig. 5b, were focused on the C1s spectra of 3 samples: the IF-WS2@C, plain PEEK and IF-WS2@C–PEEK composites with 8 wt% NPs. The C–C bonding for all materials exhibited clearly around the binding energy BE = 284.8 eV. The ether and ketone bonds from the PEEK displayed at BE = 286.3 eV and BE = 288.2 eV, respectively.26 The tiny C![[double bond, length as m-dash]](https://www.rsc.org/images/entities/char_e001.gif) O peak appearing in the IF-WS2@C spectrum possibly originated from the carbon source (acetone). The most interesting phenomenon was the obvious increase in the intensity of the broad peak around BE = 292 eV. The IF-WS2@C–PEEK composite exhibited a much stronger intensity at BE = 291.9 eV than either the IF-WS2@C or the PEEK alone. The sp2 hybrid orbit of the benzene plane (π–π*) in PEEK was reported to have a BE = 292.2 eV,26,27 whilst graphitic carbon that had a similar hexagonal-ring structure was reported to have a similar sp2 hybrid vibration mode with BE = 292.1 eV in the IF-WS2@C sample.28 It was not easy to distinguish the two peaks due to their overlap; however, the significantly increased intensity for the broad carbon shake-up peak at 291.9 eV in the composite was believed to be a result of interface reaction between carbon and PEEK during sintering. It was likely that when the carbon hexagonal-ring of the IF-WS2@C NPs faced the benzene planes of the PEEK, they formed a chemical bond via π–π stacking; hence the much larger broad peak was observed. This bonding would help to create a stronger and more stable interface between the IF-WS2@C and PEEK, which would be stronger than a physically bonded interface, thus improving the mechanical and physical properties, which will be verified later.
O peak appearing in the IF-WS2@C spectrum possibly originated from the carbon source (acetone). The most interesting phenomenon was the obvious increase in the intensity of the broad peak around BE = 292 eV. The IF-WS2@C–PEEK composite exhibited a much stronger intensity at BE = 291.9 eV than either the IF-WS2@C or the PEEK alone. The sp2 hybrid orbit of the benzene plane (π–π*) in PEEK was reported to have a BE = 292.2 eV,26,27 whilst graphitic carbon that had a similar hexagonal-ring structure was reported to have a similar sp2 hybrid vibration mode with BE = 292.1 eV in the IF-WS2@C sample.28 It was not easy to distinguish the two peaks due to their overlap; however, the significantly increased intensity for the broad carbon shake-up peak at 291.9 eV in the composite was believed to be a result of interface reaction between carbon and PEEK during sintering. It was likely that when the carbon hexagonal-ring of the IF-WS2@C NPs faced the benzene planes of the PEEK, they formed a chemical bond via π–π stacking; hence the much larger broad peak was observed. This bonding would help to create a stronger and more stable interface between the IF-WS2@C and PEEK, which would be stronger than a physically bonded interface, thus improving the mechanical and physical properties, which will be verified later.
The tensile strengths of the neat PEEK, the complementary IF-WS2–PEEK and the IF-WS2@C–PEEK nanocomposites with NP contents ranging from 2 to 8 wt% are shown in Fig. 6a. Compared with the neat PEEK sample, the ultimate tensile strength of the 2 wt% composites increased from 78 MPa to 116 and 121 MPa for IF-WS2@C-30–PEEK and IF-WS2@C-60–PEEK, respectively. Further increasing the IF-WS2@C content to 4 wt% resulted in a significant deterioration in the tensile strength. This is believed to arise from filler agglomerations with increased content, which generated weakening points in the composites. This analysis is confirmed by the TEM imaging investigations. However, the reduced result at 4% filler is still better than that of the plain PEEK sample. At 8 wt% addition, all composites would have suffered from serious agglomeration and, as a result, exhibited the lowest strength values, even lower than the plain PEEK. All samples showed a similar tendency in the tensile strength when the filler content was increased, but the two C-coated IF-WS2 composites exhibited significant improvements against those of neat PEEK and IF-WS2–PEEK composites at a lower content.
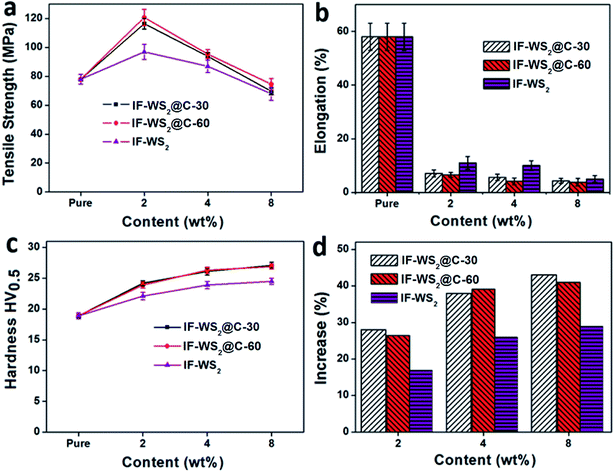 | ||
| Fig. 6 (a and b) Average ultimate tensile strength and its corresponding elongation percentage; (c and d) Vickers hardness values of the specimens with different filler types and contents. | ||
The elongations of all IF-WS2@C–PEEK composite specimens became worse than the neat PEEK, from ca. 60% down to 10% for IF-WS2 and 5% for IF-WS2@C, as shown in Fig. 6b. The hardness values (HV) were all shown to be much higher than that of neat PEEK (Fig. 6c) The highest HV values were obtained from the 8 wt% IF-WS2@C-30–PEEK and IF-WS2@C-60–PEEK samples, being 27.1 and 26.9 HV0.5, respectively which represented an over 40% improvement against the neat PEEK (18.9 HV0.5). Fig. 6d shows the tendency in hardness values that increased with increasing filler amounts. Meanwhile, all composites containing carbon-coated IF-WS2 NPs exhibited a greater improvement effect than that of the pristine IF-WS2 reinforcement.
Many polymer matrix composites become stronger, harder and more brittle with increased filler contents. As shown above, this phenomenon also occurred in this context. These different property improvement features associated with different fillers are attributed to the dispersion and interface status of the filler within the matrix. For the IF-WS2@C filler, they exhibited the best dispersion and possibly formed the strongest bonding with the PEEK to stop deformation and elongation, and thus the highest strength and hardness over the plain IF-WS2 filler at moderate filler contents. At higher filler content, 8%, the dispersion effect became dominant; hence all composites exhibited similar but lower elongation and strength. The joint effects of dispersion and interface resulted in the IF-WS2@C–PEEK showing higher strength than the plain IF-WS2–PEEK composites, but a lower elongation.
The thermal stability of the IF-WS2@C–PEEK samples are shown in Fig. 7a and c, and their corresponding DSC curves on melting point are presented in Fig. 7b and d. The TS represents the onset temperature of the degradation and TM refers to the temperature at maximum degradation. As summarised in Table 1, the higher the IF-WS2@C content, the higher the degradation temperature; and the higher the starting degradation temperature of the composites, the better the thermal stability. The IF-WS2@C-60–PEEK composite showed a slightly higher degradation temperature than IF-WS2@C-30–PEEK, which was due to the difference in their carbon coating. The 8 wt% addition notably postponed the onset degradation temperatures of the two carbon coated composites by 54 and 56 °C, respectively. Moreover, they also exhibited a stable platform stage (Fig. 7a) before the start of the degradation period. These results have demonstrated the role of carbon coating in improving the thermal stability of the composites, suggesting that these composites could widen their application potentials towards very demanding environments.
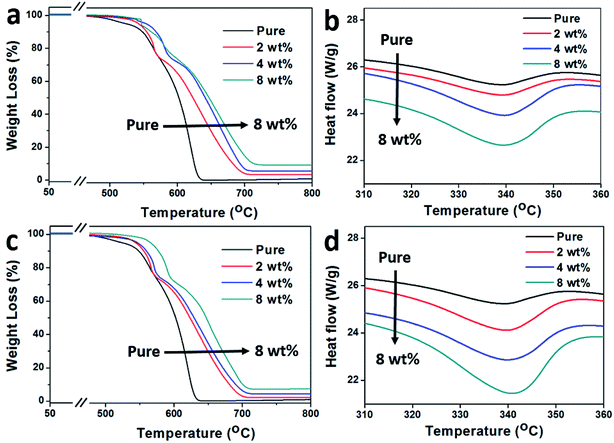 | ||
| Fig. 7 TGA curves (a and c) and the corresponding DSC curves around the melting point (b and d) of the IF-WS2@C-30–PEEK and IF-WS2@C-60–PEEK composites, respectively. | ||
| Content (wt%) | IF-WS2@C-30 | IF-WS2@C-60 | ||
|---|---|---|---|---|
| T S (°C) | T M (°C) | T S (°C) | T M (°C) | |
| 0 | 487 | 641 | 487 | 641 |
| 2 | 516 | 702 | 523 | 706 |
| 4 | 531 | 706 | 538 | 711 |
| 8 | 541 | 714 | 543 | 716 |
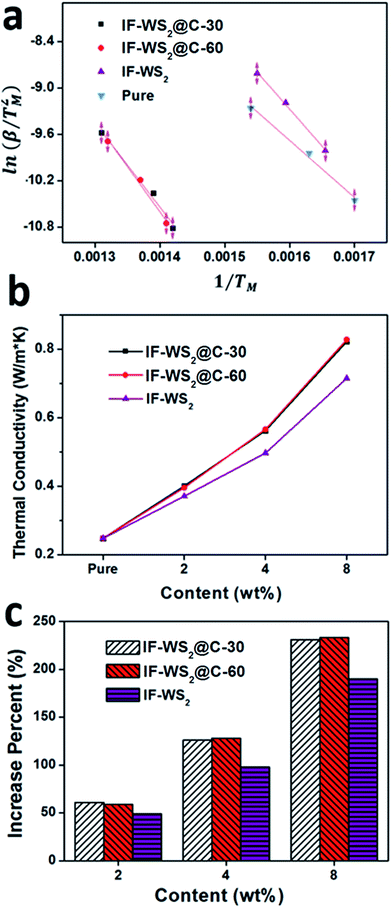
According to the TGA analysis, the IF-WS2@C–PEEK nanocomposites exhibit higher degradation temperatures. By further applying the Kissinger method and using eqn (1),28 the activation energy (Ea) of degradation in air for those samples can be calculated based on the data in Table 1, in order to compare the thermal stability.
 | (1) |
The thermal conductivity of different composites evaluated at 25 °C is presented in Fig. 8b. The neat PEEK gave a value of 0.248 W m−1 K−1, in line with the literature, whilst the composites all showed much higher values, which increased with the NP content level. In particular, the two C-coated WS2 composites (IF-WS2@C-30–PEEK and -60–PEEK) exhibited dramatically higher thermal conductivities than either neat PEEK or the IF-WS2–PEEK composites. For example, the conductivity of the IF-WS2@C-60–PEEK composites was measured with 61, 134 and 235% improvement, against neat PEEK, for the 2, 4 and 8 wt% of NPs additions, respectively. This result has clearly confirmed again the effective role of IF-WS2@C NPs in the fabrication of composites, over pristine IF-WS2.
The thermal conductivity of composites is associated with the crystalline structure of the PEEK matrix, the intrinsic nature of the filler and its distribution, and importantly the quality of the interface structure. Layered carbon in the form of CNTs, graphene and even graphite all have extraordinary thermal conductivities, and the current few-layered very thin graphitic carbon coating on the IF-WS2 exhibits a similar structural feature to carbon nano-onions—an analogue of CNTs—and therefore its presence is expected to benefit the thermal conductivity. It is obvious that the distribution of the filler within the matrix will also affect the crystal structures of the matrix; however, the synergy between the filler and the PEEK interface is likely to have played a dominant role in this context, as proposed for many CNT-reinforced polymeric composites.29 As a discontinuous particulate reinforcement in this case, the interface synergy would be more important. Our TEM observation and XPS analysis above have both suggested the formation of a good interface in the IF-WS2@C–PEEK composites. Therefore, the 235% improvement is very convincing.
4. Conclusion
To conclude, we have demonstrated the use of novel core–shell structured IF-WS2@C NPs to reinforce the high performance thermoplastic PEEK polymer, by taking advantage of the excellent properties of both a few-layered graphitic carbon and IF-WS2, to fabricate advanced ternary nanocomposites. Significantly improved thermal conductivity (235%), thermal stability (with over 50 °C improvement) and mechanical properties (>50% in strength and >40% in hardness) have been achieved for the resulting composites. We have verified that the carbon coating on the IF-WS2 allowed the formation of a very good interface bonding when integrated into the PEEK matrix. In the meantime, the incorporation of the IF-WS2@C NPs has improved the dispersion ability of the IF-WS2, refined the crystallisation of the PEEK matrix, and promoted the formation of smaller spherulite structures, which all contributed to the improvements in the properties. This study has not only established a completely new strategy to create a carbon-inorganic jointly reinforced high performance polymeric matrix composite, but also demonstrated that coatings of other functional NPs could easily be realised for desired properties. We believe that the significantly improved properties of the resulting IF-WS2@C–PEEK ternary nanocomposites will greatly extend the applications of neat PEEK into more critical areas.Acknowledgements
Thanks to the EPSRC (EP/N034627/1) for financial support.References
- W. Zhang, S. Ge, Y. Wang, M. H. Rafailovich, O. Dhez, D. A. Winesett, H. Ade, K. Shafi, A. Ulman, R. Popovitz-Biro, R. Tenne and J. Sokolov, Polymer, 2003, 44, 2109–2115 CrossRef CAS.
- Y. Wang, E. James and O. R. Ghita, Mater. Des., 2015, 83, 545–551 CrossRef CAS.
- M. Naffakh and A. M. Diez-Pascual, J. Mater. Chem. B, 2014, 2, 4509–4520 RSC.
- M. S. P. Shaffer and A. H. Windle, Adv. Mater., 1999, 11, 937–941 CrossRef CAS.
- B. Krause, G. Petzold, S. Pegel and P. Pötschke, Carbon, 2009, 47, 602–612 CrossRef CAS.
- A. M. Díez-Pascual, M. Naffakh, M. A. Gómez, C. Marco, G. Ellis, M. T. Martínez, A. Ansón, J. M. González-Domínguez, Y. Martínez-Rubi and B. Simard, Carbon, 2009, 47, 3079–3090 CrossRef.
- L. Liu, L. Xiao, X. Zhang, M. Li, Y. Chang, L. Shang and Y. Ao, RSC Adv., 2015, 5, 57853–57859 RSC.
- Y. Zhu, T. Sekine, Y. Li, W. X. Wang, M. Fay, H. Edwards, P. Brown, N. Fleischer and R. Tenne, Adv. Mater., 2005, 17, 1500–1503 CrossRef CAS.
- A. M. Diez-Pascual, M. Naffakh and M. A. Gomez-Fatou, Mater. Chem. Phys., 2011, 130, 126–133 CrossRef CAS.
- Y. Q. Zhu, T. Sekine, K. S. Brigatti, S. Firth, R. Tenne, R. Rosentsveig, H. W. Kroto and D. R. M. Walton, J. Am. Chem. Soc., 2003, 125, 1329–1333 CrossRef CAS PubMed.
- X. Hou, C. X. Shan and K. Choy, Surf. Coat. Technol., 2008, 202, 2287–2291 CrossRef CAS.
- M. Naffakh, A. M. Diez-Pascual, C. Marco, M. A. Gomez and I. Jimenez, J. Phys. Chem. B, 2010, 114, 11444–11453 CrossRef CAS PubMed.
- M. Naffakh, A. M. Diez-Pascual and M. A. Gomez-Fatou, J. Mater. Chem., 2011, 21, 7425–7433 RSC.
- S. H. Choi, S. J. Boo, J.-H. Lee and Y. C. Kang, Sci. Rep., 2014, 4, 5755 CrossRef CAS PubMed.
- S. Rhee and J. L. White, J. Polym. Sci., Part B: Polym. Phys., 2002, 40, 1189–1200 CrossRef CAS.
- S. Yang, J. Rafael Castilleja, E. V. Barrera and K. Lozano, Polym. Degrad. Stab., 2004, 83, 383–388 CrossRef CAS.
- Z. Spitalsky, D. Tasis, K. Papagelis and C. Galiotis, Prog. Polym. Sci., 2010, 35, 357–401 CrossRef CAS.
- R. L. D. Whitby, W. K. Hsu, C. B. Boothroyd, P. K. Fearon, H. W. Kroto and D. R. M. Walton, ChemPhysChem, 2001, 2, 620–623 CrossRef CAS PubMed.
- N. Abbas and H. T. Kim, Macromol. Res., 2016, 24, 1084–1090 CrossRef CAS.
- M. Kaseem, K. Hamad and Y. G. Ko, Eur. Polym. J., 2016, 79, 36–62 CrossRef CAS.
- S. Mondal, L. Nayak, M. Rahaman, A. Aldalbahi, T. K. Chaki, D. Khastgir and N. C. Das, Composites, Part B, 2017, 109, 155–169 CrossRef CAS.
- F. Xu, N. Wang, H. Chang, Y. Xia and Y. Zhu, Inorganics, 2014, 2, 313 CrossRef CAS.
- F. Xu, T. P. Almeida, H. Chang, Y. Xia, M. L. Wears and Y. Zhu, Nanoscale, 2013, 5, 10504–10510 RSC.
- Y. Wang, J. D. Beard, K. E. Evans and O. Ghita, RSC Adv., 2016, 6, 3198–3209 RSC.
- T. Wu, P. Liu, M. Shi, J. Lu, G. Ye and J. Xu, Polym. Int., 2011, 60, 1318–1323 CAS.
- P. Louette, F. Bodino and J.-J. Pireaux, Surf. Sci. Spectra, 2005, 12, 149–153 CrossRef CAS.
- Y. Hong, J. W. Lam and B. Z. Tang, Chem. Soc. Rev., 2011, 40, 5361–5388 RSC.
- H. E. Kissinger, Anal. Chem., 1957, 29, 1702–1706 CrossRef CAS.
- J. Jin, R. Rafiq, Y. Q. Gill and M. Song, Eur. Polym. J., 2013, 49, 2617–2626 CrossRef CAS.
| This journal is © The Royal Society of Chemistry 2017 |

