 Open Access Article
Preparation of an ultrathin 2D/2D rGO/g-C3N4 nanocomposite with enhanced visible-light-driven photocatalytic performance†
Kun Yuab,
Xiaofeng Huab,
Kaiyuan Yaoab,
Ping Luoab,
Xiuyuan Wangc and
Huihu Wang *ab
*ab
aHubei Provincial Key Laboratory of Green Materials for Light Industry, Hubei University of Technology, Wuhan, P. R. China. E-mail: wanghuihu@hbut.edu.cn
bSchool of Materials and Chemical Engineering, Hubei University of Technology, Wuhan, P. R. China
cCollege of Plant Science and Technology, Huazhong Agricultural University, Wuhan, P. R. China
First published on 25th July 2017
Abstract
A simple solvent method was developed to construct an ultrathin 2D/2D rGO/g-C3N4 nanocomposite using a suspension of thermally exfoliated g-C3N4 nanosheets and graphene oxide (GO) followed by a NaHSO3 reducing process. Different from the g-C3N4 bulk, the results revealed that the g-C3N4 nanosheets and rGO components in the as-prepared ultrathin nanocomposite have a strong interfacial interaction and abundant coupling interfaces. Moreover, improved visible light absorption properties and fast charge carrier separation efficiency were observed in the ultrathin 2D/2D rGO/g-C3N4 nanocomposite, as compared to the pure g-C3N4 nanosheets, which ensures its enhanced photocatalytic activity for methyl orange (MO) degradation and CO2 photoreduction. It was confirmed that the thermally exfoliated g-C3N4 nanosheet is a good 2D material for the construction of 2D/2D heterostructures.
1. Introduction
Nowadays, energy and environmental issues have become a realistic and urgent problem all over the world.1–3 Photocatalysis is regarded as one of the most promising technologies to settle both environmental and energy problems simultaneously through photochemical reactions.4–6 However, low light utilization efficiency, fast recombination of charge carriers and the instability of numerous photocatalysts still limit the practical application of photocatalysis.As a visible-light-driven photocatalyst, g-C3N4 has attracted immense research interest in the past decade due to its tunable electron configuration and good stability,7–9 which makes it an excellent candidate for solar energy conversion and pollution abatement. However, pure g-C3N4 suffers from shortcomings such as too small surface area, inefficient use of visible light and fast recombination of charge carriers.10,11 To overcome these problems, many methods have been developed to improve the photocatalytic performance of pure g-C3N4 including metal doping,12–15 non-metal doping,16–18 morphology tailoring19,20 and semiconductors coupling21–23 and so on. Notably, as g-C3N4 is a lamellar material, it provides a good 2D surface platform to obtain the highly efficient composite through constructing the unique 2D/2D heterostructures between g-C3N4 and the other 2D species. Compared with 0D/2D and 1D/2D heterostructures, the 2D/2D heterostructures have a rather larger surface area and more abundant coupling heterointerfaces, which consequently enhances its photocatalytic performance.23–25 So far, several 2D/2D heterostructures based on g-C3N4 bulks have been developed, such as SnNb2O6/g-C3N4,26 BiOBr/g-C3N4 (ref. 27) and g-C3N4/Ca2Nb2TaO10.28 All 2D/2D heterostructures demonstrated the high photocatalytic activity for pollutants elimination and hydrogen production.26–28 More recently, a hybrid catalyst of 2D/2D rGO/g-C3N4 was prepared by directly heating a mixture of melamine and graphene oxide (GO) in air. It was observed that the photocatalytic activity of this 2D/2D composite for rhodamine B degradation was 2.6 times higher than that of pure g-C3N4.29 Afterwards, the 2D/2D rGO/g-C3N4 composite was also fabricated by incorporating rGO and protonated g-C3N4 bulks through ultrasonic dispersion and electrostatic self-assembly strategy.30,31 Since graphene and g-C3N4 possess the similar carbon network and sp2 conjugated π structure, they have the excellent compatibility to form composite, which may possess an outstanding photocatalytic performance due to its superior interfacial interaction, fast electrons transfer and high charges separation efficiency.32 However, in most of cases, g-C3N4 bulks were used as the matrix. The distribution and the effective coupling interfaces of as-prepared 2D/2D composites may be subject to the large size and tiny surface area of g-C3N4 bulks. Neither heating melamine nor ultrasonic exfoliation of g-C3N4 bulks could easily obtain the ultrathin 2D g-C3N4 nanosheets with small size and large surface area. As a result, it is highly required to design and construct the ultrathin 2D/2D rGO/g-C3N4 heterostructures based on 2D g-C3N4 nanosheets, which may also provide a new insight on the synthesis of the other composite materials for various practical applications.
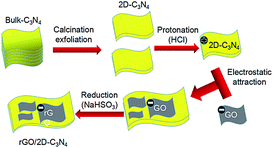
Herein, a thermal-exfoliation method was used to fabricate ultrathin 2D g-C3N4 nanosheets at first.33,34 Then, the acid pre-treatment with HCl can easily alter the g-C3N4 surface to possess positive polarity.30 Upon reduction of GO using NaHSO3 as a reducing agent, the resulting rGO/g-C3N4 heterostructures could be successfully obtained by the electrostatic attraction of oppositely charged materials. Finally, the as-obtained rGO/g-C3N4 was treated by vacuum cooling drying method to keep the stability of ultrathin 2D g-C3N4 structure. Compared with g-C3N4 bulks and the ultrathin g-C3N4 nanosheets, the photocatalytic activity of as-obtained 2D/2D rGO/g-C3N4 heterostructures for CO2 photoreduction and methyl orange (MO) degradation has been significantly improved. The photocatalytic mechanism of this kind of 2D/2D heterostructures was also discussed.
2. Experimental
2.1 Synthesis of g-C3N4 bulks and g-C3N4 nanosheets
The thermal polymerization method was used for the preparation of g-C3N4 bulks. Typically, the precursor was composed by 3.5 g of urea and 1.5 g of dicyanodiamine which was put in a ceramic crucible covered with its lid. Then the precursor was sintered at 550 °C for 4 h in the furnace with the heating ramp of 2 °C min−1. Until the furnace was cooled to room temperature, the yellow g-C3N4 bulks were collected. Next, the as-prepared g-C3N4 bulks were further sintered at 520 °C for 2 h with the heating ramp of 5 °C min−1 in order to prepare ultrathin g-C3N4 nanosheets. Different from the preparation process of g-C3N4 bulks, the crucible in the thermal-exfoliation process was not covered with its lid. The white g-C3N4 nanosheets were collected when the furnace was cooled to room temperature.2.2 Synthesis of 2D/2D rGO/g-C3N4 nanocomposite
Firstly, 1 g of as-prepared g-C3N4 nanosheets was added to 200 ml of HCl solution with concentration 0.5 mol l−1 and was sonicated for 0.5 h to obtain slurry, which was continuously stirred for another 3.5 h to achieve completely proton-functionalized surface. Then the slurry was filtered and washed with deionized water and alcohol for several times.Secondly, the GO dispersion (purchased from XFNANO, China) was diluted with water to obtain 100 ml of solution and sonicated for 0.5 h. Then 200 mg of as-obtained proton-functionalized g-C3N4 nanosheets was added to the solution and sonicated for another 0.5 h. After that, the solution was vigorously stirred for 1 h to achieve homogeneous suspension. The weight fractions of rGO in the 2D/2D rGO/g-C3N4 nanocomposite were set as 1, 3, 5, and 7 wt% respectively.
Thirdly, a certain amount of NaHSO3 as reduce agent was added to the suspension, which was then transferred to an oil bath, heated to 95 °C and kept the temperature for 1.5 h to reduce GO. Finally, the suspension was filtered and vacuum dried at −60 °C for 6 h to obtain the 2D/2D rGO/g-C3N4 nanocomposite. According to the weight fractions of rGO in the nanocomposite, the as-prepared samples were denoted as 1rGO/g-C3N4, 3rGO/g-C3N4, 5rGO/g-C3N4 and 7rGO/g-C3N4 respectively. The diagram of detailed preparation process was shown in Fig. 1.
2.3 Characterization
X-Ray diffraction (XRD) patterns of the as-prepared nanocomposites were performed on an X-ray diffractometer (Bruker Advanced D8) using Ni-filtered CuKα radiation over the diffraction angle (2θ) ranging from 5° to 45°. The scan rate was set as 10° min−1. The morphology and particle size of nanocomposites were characterized via scanning electron microscopy (SEM, Quanta 450) and transmission electron microscopy (TEM, FEI Tecnai G20). A Fourier transform infrared spectroscopy (FTIR) was acquired from Thermo-Nicolet iS10 with a standard KBr pellet method. The optical absorbance spectra of the nanocomposites were obtained using an ultraviolet-visible (UV-Vis) spectro-photometer (PerkinElmer, Lambda 750S). The photoluminescence (PL) spectra were carried out on an F-7000 spectrophotometer using a Xe lamp as excitation source. The excitation wavelength was 370 nm. The surface areas of the samples were measured using nitrogen adsorption–desorption by an automatic analyzer (ASAP 2020).2.4 Evaluation of photocatalytic activity
The photocatalytic activity of as-prepared nanocomposites was evaluated by CO2 photoreduction and MO photodegradation.The photoreduction of CO2 was conducted in a cylindrical steel reactor, which was vertically irradiated by a 300 W xenon lamp with a 400 nm cutoff filter. The schematic diagram of the photoreactor was demonstrated in Fig. S1.† The light spectrum of 400 nm UV light cutoff filter was provided in Fig. S2.† The distance from sample to 300 W Xenon lamp was 18 cm. In each experiment, 50 mg of nanocomposite powder was placed in the bottom of the cylindrical steel reactor with 120 ml of volume and 9 cm2 of floor space. Besides, a minimal unsealed glass bottle with 1 ml deionized water was also put in the bottom of the cylindrical steel reactor simultaneously. Then, CO2 gas with high purity (99.999%) was pushed into the reactor until the pressure of reactor reached 0.5 Mpa. In order to eliminate the air component, the reactor was washed 3 times by high purity CO2 gas purging. Afterward, the light was turned on to initiate the reaction. About 0.5 ml of gas was taken out from the reactor for the analysis of CH4 concentration using a gas chromatograph (GC-7920 with FID detector) after 3 h. Photodegradation of MO solution was also conducted with the same light source as CO2 photoreduction. For each experiment, 50 ml of MO aqueous solution with a concentration of 20 ppm was mixed with 50 mg of nanocomposite. Before irradiation, the solution was put in a sealed glass beaker and ultrasonicated for 15 min, and then stirred for another 30 min in the dark to ensure adsorption–desorption equilibrium. 5 ml of the reaction suspension was taken out at 10 min intervals, centrifuged and examined at 464 nm using a UV-vis spectrophotometer (UV-2102PC).
3. Results and discussion
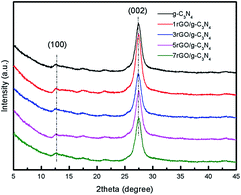
Fig. 2 shows the XRD patterns of as-prepared ultrathin g-C3N4 nanosheets and the series of 2D/2D rGO/g-C3N4 nanocomposites. Two apparent diffraction peaks are observed in all nanocomposites. As shown, the weak diffraction peak at 2θ = 13.11° with d value of 0.671 nm is related to the in-plane ordering of tri-s-triazine units, while the strong diffraction peak at 2θ = 27.31° is ascribed to the interlayer stacking of aromatic segments with d value of 0.324 nm.8 The two diffraction peaks can be indexed to (100) and (002) diffraction planes of g-C3N4 phase. From the results of XRD patterns, it can be found that the lattice structures of g-C3N4 are well-maintained after thermal exfoliation, acid pre-treatment and conjugation with GO process. In addition, no characteristic diffraction peak of GO at 2θ = 9.51° is observed in the series of rGO/g-C3N4 nanocomposites which may be attributed to the reduction of GO to rGO.35 However, the diffraction of rGO at 2θ = 24.51° is also not found, which may be due to the low content and fairly low diffraction intensity of rGO.36SEM and TEM measurements were conducted to characterize the surface morphologies and structures of g-C3N4 nanosheets and 3rGO/g-C3N4 nanocomposite in Fig. 3. Upon thermal exfoliation of g-C3N4 bulks, the thermal exfoliated g-C3N4 nanosheets present a thin layered structure without obvious domains of g-C3N4 bulks as shown in Fig. 3a and b. Meanwhile, the thermal exfoliated ultrathin g-C3N4 nanosheets comprised of rare layers are observed in the TEM images shown in Fig. 3c and d. The ultrathin g-C3N4 nanosheets display a porous structure (indicated by the white dotted circles) in Fig. 3c, which may be originated from the thermal polymerization of urea and dicyanodiamine. By employing these thermal-exfoliated ultrathin g-C3N4 nanosheets, we would get an ultrathin 2D/2D structure of g-C3N4 with rGO. Fig. 3e and f show the morphology of 3rGO/g-C3N4 nanocomposite. It can be observed that a 2D/2D structure has been successfully constructed. The porous material indicated by the white dotted circles in Fig. 3e may be g-C3N4, which is totally wrapped by rGO nanosheets with smooth surface. It indicates that there is an abundant interfacial contact area between g-C3N4 and rGO, which will in turn enhance the interfacial interaction and improve the charge carriers' separation efficiency, thus increasing the photocatalytic reaction active sites for enhanced catalytic performance.
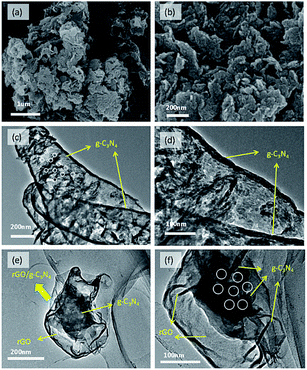 | ||
| Fig. 3 SEM images of ultrathin g-C3N4 nanosheets (a and b). TEM images of ultrathin g-C3N4 nanosheets (c and d) and 3rGO/g-C3N4 nanocomposite (e and f). | ||
The N2 adsorption–desorption isotherms of different samples were demonstrated in Fig. S3.† The surface areas of ultrathin g-C3N4 nanosheets, 3rGO/g-C3N4 and g-C3N4 bulks were calculated and determined as 158.56, 92.12 and 51.34 m2 g−1, respectively. It can be observed that the surface areas of ultrathin g-C3N4 and 3rGO/g-C3N4 are much higher than that of g-C3N4 bulks. Owing to the large surface area, it has been investigated that the photocatalytic activity of ultrathin g-C3N4 nanosheets was much higher than g-C3N4 bulks.33 Therefore, the photocatalytic activity of rGO/g-C3N4 nanocomposites based on g-C3N4 nanosheets may be further enhanced for this reason.
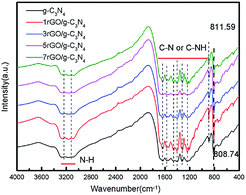
Fig. 4 shows the FTIR spectra of as-prepared ultrathin g-C3N4 nanosheets and the series of rGO/g-C3N4 nanocomposites. The broad absorption band around 3200 cm−1 is originated from the N–H stretching vibration of uncondensed aminogroups and O–H stretches of adsorbed hydroxyl species.37 A series of peaks in the range from 1050 to 1800 cm−1 are attributed to the typical stretching modes of C–N and C–NH heterocycles which comprise both trigonal (N–(C)3) (full condensation) and bridging C–NH–C units.38,39 The peak centered at 808 cm−1 is ascribed to the characteristic breathing mode of triazine units in g-C3N4.31 Notably, the position of this peak in pure g-C3N4 nanosheets exhibits a slight shift from 808.74 cm−1 to 811.59 cm−1 relative to 7rGO/g-C3N4, indicating that a strong interaction is formed after the g-C3N4 nanosheets are assembled with rGO by the electrostatic adsorption.40
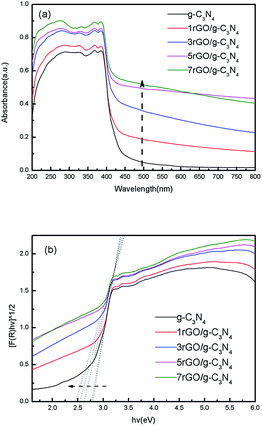
UV-Vis diffuse reflectance spectra of ultrathin g-C3N4 nanosheets and the series of rGO/g-C3N4 nanocomposites are demonstrated in Fig. 5. As shown in Fig. 5a, all rGO/g-C3N4 nanocomposites exhibit the stronger visible light absorption compared with the ultrathin g-C3N4 nanosheets, verifying that the introduction of rGO evidently improves the optical property of g-C3N4 nanosheets. Noticeably, with the increase of rGO weight fraction in rGO/g-C3N4 nanocomposites, a red shift to a longer wavelength is observed in the absorption edge of nanocomposites, which may result from the band gap narrowing of the rGO/g-C3N4 nanocomposites. The plots of the transformed Kubelka–Munk value as a function of light energy are shown in Fig. 5b. It is clearly that the band gap of nanocomposite is narrowed in contrast to the ultrathin g-C3N4 nanosheets. As the stronger visible light absorption of rGO/g-C3N4 nanocomposites may improve the photo excitation efficiency of g-C3N4, it is anticipated that the overall photocatalytic activity of nanocomposites will be enhanced. However, the high rGO weight fraction in nanocomposites may bring the negative effects because most of the incident light may be absorbed by rGO, while the available light for g-C3N4 component obviously decreases. Therefore, for improving the light utilization, the appropriate rGO weight fraction in nanocomposites should be critically controlled.
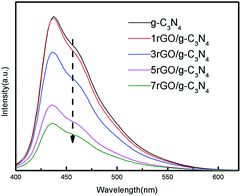
PL was performed in order to investigate the transferring, trapping and separation efficiency of photo-generated charge carriers in ultrathin g-C3N4 nanosheets and the series of rGO/g-C3N4 nanocomposites in the photocatalytic reaction.30 As can be seen from Fig. 6, the PL intensity is found to following the sequence: ultrathin g-C3N4 nanosheets > 1rGO/g-C3N4 > 3rGO/g-C3N4 > 5rGO/g-C3N4 > 7rGO/g-C3N4. Compared with the ultrathin g-C3N4 nanosheets, the intensity of emission peak in the PL spectra of rGO/g-C3N4 nanocomposites are obviously weakened, implying that the separation efficiency of photo-generated electron–hole pairs is much higher than that of pure g-C3N4 nanosheets. Because rGO can act as an effective electron collector, the recombination of photo-generated electrons and holes in nanocomposites is evidently decreased with the increase of rGO weight fraction. As a result, the extent of the fluorescence quenching is noticeably increased with the increase of weight rGO fraction. Generally, an appropriate rGO weight fraction would enhance the photo-generated charge carriers' separation efficiency of nanocomposites and improve its light utilization. However, an excessive rGO may weaken the visible light utilization of g-C3N4 component owing to its light screening effect. Furthermore, the surface active sites on g-C3N4 may be occupied by rGO nanosheets, which in turn results in a reduced photocatalytic performance of nanocomposite.41
To evaluate the photocatalytic properties of ultrathin g-C3N4 nanosheets and the series of rGO/g-C3N4 nanocomposites under visible light illumination, MO removal in aqueous system with concentration of 20 ppm is firstly evaluated and depicted in Fig. 7a. The absorbance spectra of MO solution over ultrathin g-C3N4 nanosheets and 3rGO/g-C3N4 nanocomposite have been given in Fig. S4.† MO degradation efficiency over 1rGO/g-C3N4, 3rGO/g-C3N4, 5rGO/g-C3N4, 7rGO/g-C3N4, and ultrathin g-C3N4 is 86.32%, 97.5%, 87.93%, 80.42% and 77.45% respectively after 60 min of visible light irradiation. All rGO/g-C3N4 nanocomposites present the enhanced photocatalytic activity for MO degradation compared with ultrathin g-C3N4. In particular, the degradation efficiency of MO initially increases, then decreases with the increase of rGO weight fraction in rGO/g-C3N4 nanocomposites. The highest photocatalytic activity is achieved when 3rGO/g-C3N4 nanocomposite is used as photocatalyst. The corresponding kinetic constants (k) were calculated and shown in Fig. 7b. Thereinto, the MO degradation kinetic curves accords with pseudo first order by linear transforms ln (C0/Ct) = kt, where C0 is the initial concentration of MO, Ct is the concentration of MO at time t, and k is the kinetic constant.42 The reaction rate constant (k) of 3rGO/g-C3N4 is 0.05191 min−1, which is about 2.19 times higher than that of ultrathin g-C3N4 nanosheets.
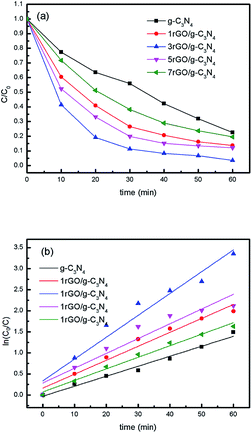 | ||
| Fig. 7 Photocatalytic degradation curves of MO under visible-light irradiation (a) and the corresponding kinetic curves (b). | ||
Photocatalytic performance of ultrathin g-C3N4 nanosheets and the series of rGO/g-C3N4 nanocomposites in gaseous system under visible light illumination are secondly evaluated and shown in Fig. 8. As it can be found in Fig. 8a, the rGO hybridization has a substantial effect on the photocatalytic activity of rGO/g-C3N4 for the photoreduction of CO2. The ultrathin g-C3N4 nanosheets exhibit a minimal total CH4 evolution of 7.49 μmol/10 g catalyst over 3 h. Meanwhile, 3rGO/g-C3N4 demonstrates a total CH4 evolution of 17.36 μmol/10 g catalysts over 3 h, which is about 2.32 times higher than that of ultrathin g-C3N4 nanosheets. To investigate the stability of nanocomposite, cyclic performance toward the photoreduction of CO2 to CH4 through consecutive five test cycles was carried out over the 3rGO/g-C3N4 nanocomposite. As shown in Fig. 8b, the 3rGO/g-C3N4 nanocomposite maintains its high photocatalytic activity for the CO2 photoreduction after five cycles under the same conditions, demonstrating that the developed photocatalyst is stable with the prolonged reaction duration.
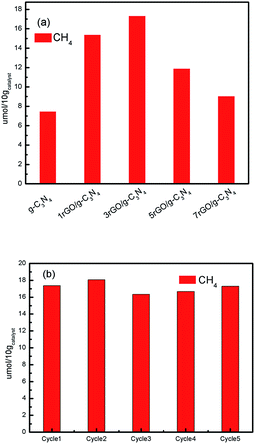 | ||
| Fig. 8 Photocatalytic reduction of CO2 performance over as-prepared catalysts (a) and the cyclic performance toward the photoreduction of CO2 to CH4 over 3rGO/g-C3N4 photocatalyst (b). | ||
Many 2D/2D heterostructures based on g-C3N4 have been developed and demonstrated the enhanced photocatalytic activity for photocatalytic applications compared with pure g-C3N4, such as SnNb2O6/g-C3N4,26 BiOBr/g-C3N4,27 g-C3N4/Ca2Nb2TaO10 (ref. 28) and rGO/g-C3N4.32 However, all these works are based on g-C3N4 bulks. In this work, the g-C3N4 bulks were thermal exfoliated to ultrathin g-C3N4 nanosheets. As the g-C3N4 nanosheets present the larger surface area than that of g-C3N4 bulks, it has been verified that the photocatalytic activity of g-C3N4 nanosheets was much higher than that of g-C3N4 bulks.33 Furthermore, we demonstrated the enhanced photocatalytic activity for MO degradation and CO2 photoreduction for ultrathin 2D/2D rGO/g-C3N4 nanocomposites as compared to the g-C3N4 nanosheets with the same photocatalytic reaction parameters and the model pollutant molecules in this experiment. Therefore, the photocatalytic activity of 2D/2D heterostructures based on g-C3N4 nanosheets may present the further enhanced photocatalytic performance in contrast to g-C3N4 bulks.
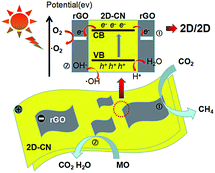
Based on the above discussion, the proposed mechanism for MO degradation and CO2 reduction under visible light irrigation over the rGO/g-C3N4 nanocomposite is shown in Fig. 9. When the rGO/g-C3N4 nanocomposite is irradiated with the visible light source, the g-C3N4 component is excited and the photo-generated electrons would transfer from its valence band (VB) to the conduction band (CB). Because of the good conductivity and remarkable electron storage capacity of rGO, the photo-generated electrons then migrate from g-C3N4 to rGO nanosheet in nanocomposite. The probability of electron–hole recombination is greatly reduced due to this transferring process, thus leading to the enhancement of photoinduced charges separation efficiency. On the other hand, the photogenerated holes remained in the VB of g-C3N4 may react with the adsorbed H2O molecules or OH− ions to generate ˙OH reactive radicals. Subsequently, the holes and the generated ˙OH reactive radicals will directly degrade the MO molecules.43,44
As for photoreduction of CO2, it is widely known that two processes usually undergo in this process. Firstly, the photogenerated holes oxidize water to obtain hydrogen ions (H+) via the half-reaction process (2H2O + 4h+ → O2 + 4H+). Secondly, the photogenerated electrons reduce CO2 to CH4 via acquiring 8-electrons process (CO2 + 8H+ + 8e− → CH4 + 2H2O).45,46 As the edges of VB and CB of g-C3N4 are determined to be +1.4 eV and −1.3 eV respectively, the above two processes can be completed in the rGO/g-C3N4 nanocomposites.31 It is worth mentioning that the photoreduction of CO2 to CH4 would be promoted by the enriched electron density on the rGO nanosheets.
In summary, the as-prepared ultrathin 2D/2D rGO/g-C3N4 nanocomposites have a large surface area and the abundant contact interfaces, which in turn promote the light absorption and increase the photogenerated charges separation efficiency. As a result, the high photocatalytic performance for MO degradation and CO2 reduction over rGO/g-C3N4 nanocomposite is achieved by modifying ultrathin g-C3N4 with rGO nanosheets to form a unique ultrathin 2D/2D heterostructures. However, an optimum rGO weight fraction in rGO/g-C3N4 nanocomposites is should be critically controlled as the low rGO content in the rGO/g-C3N4 nanocomposite could not provide adequate electron storage sites to accelerate the separation of charges, while an excess of rGO may significantly weaken the visible light utilization of g-C3N4 component and occupy the surface active sites on g-C3N4, leading to a reduced photocatalytic performance.
4. Conclusions
In conclusion, we have successfully prepared an ultrathin 2D/2D rGO/g-C3N4 nanocomposite with thermal exfoliated g-C3N4 nanosheets and graphene oxide (GO) solution followed by a NaHSO3 reducing process. To keep the structure stability of the ultrathin 2D/2D rGO/g-C3N4 nanocomposite, vacuum cooling drying method was used in this work. The ultrathin 2D/2D nanocomposite exhibited the enhanced visible light absorption, the strong interfacial interaction and the abundant coupling interfaces as supported by SEM, TEM, DRS and FTIR studies. Compared with the pure ultrathin g-C3N4 nanosheets, the as-prepared 2D/2D nanocomposite shows the significantly enhanced photocatalytic activity for MO degradation and CO2 photoreduction. The ultrathin 2D/2D rGO/g-C3N4 nanocomposite with 3 wt% of rGO demonstrated the highest photocatalytic activity, which was 2.19 times and 2.32 times higher than that of pure ultrathin g-C3N4 nanosheets respectively. This enhanced visible light photocatalytic activity may be ascribed to the strong visible light absorption and interfacial interaction between g-C3N4 nanosheets and rGO component, which in turn facilitates the separation efficiency of charge carriers.Acknowledgements
The authors gratefully acknowledge the financial support of Natural Science Foundation of Hubei Province of China (2013CFA085), the International Science & Technology Cooperation Program of China (Grant No. 2016YFE0124300), Research Foundation for Talented Scholars of Hubei University of Technology (BSQD12119), Open Foundation of Hubei Provincial Key Laboratory of Green Materials for Light Industry ([2013]2-22) and National Undergraduate Training Programs for Innovation and Entrepreneurship (201510500006).Notes and references
- M. E. Boot-Handford, J. C. Abanades, E. J. Anthony, M. J. Blunt, S. Brandani, N. Mac Dowell, J. R. Fernández, M. C. Ferrari, R. Gross, J. P. Hallett, R. S. Haszeldine, P. Heptonstall, A. Lyngfelt, Z. Makuch, E. Mangano, R. T. J. Porter, M. Pourkashanian, G. T. Rochelle, N. Shah, J. G. Yaoa and P. S. Fennell, Energy Environ. Sci., 2014, 7, 130–189 CAS.
- N. M. P. Bocken, S. W. Short, P. Rana and S. Evans, J. Cleaner Prod., 2014, 65, 42–56 CrossRef.
- Z. Liu, D. Guan, W. Wei, S. Davis, P. Ciais, J. Bai, S. Peng, Q. Zhang, K. Hubacek, G. Marland, R. J. Andres, D. Crawford-Brown, J. Lin, H. Zhao, C. Hong, T. A. Boden, K. Feng, G. P. Peters, F. Xi, J. Liu, Y. Li, Y. Zhao, N. Zeng and K. He, Nature, 2015, 524, 335–338 CrossRef CAS PubMed.
- C. Yu, W. Zhou, L. Hong, L. Yuan and D. D. Dionysiou, Chem. Eng. J., 2016, 287, 117–129 CrossRef CAS.
- C. Acar, I. Dincer and C. Zamfirescu, Int. J. Energy Res., 2014, 38, 1903–1920 CrossRef CAS.
- D. Sudha and P. Sivakumar, Chem. Eng. Process., 2015, 97, 112–133 CrossRef CAS.
- S. Ye, R. Wang, M. Z. Wu and Y. P. Yuan, Appl. Surf. Sci., 2015, 358, 15–27 CrossRef CAS.
- J. Zhu, P. Xiao, H. Li and S. A. Carabineiro, ACS Appl. Mater. Interfaces, 2014, 6, 16449–16465 CAS.
- S. Cao, J. Low, J. Yu and M. Jaroniec, Adv. Mater., 2015, 27, 2150–2176 CrossRef CAS PubMed.
- J. Liu, H. Wang and M. Antonietti, Chem. Soc. Rev., 2016, 45, 2308 RSC.
- G. Mamba and A. K. Mishra, Appl. Catal., B, 2016, 198, 347–377 CrossRef CAS.
- W. J. Ong, L. L. Tan, S. P. Chai and S. T. Yong, Dalton Trans., 2014, 44, 1249–1257 RSC.
- S. Hu, R. Jin, G. Lu, D. Liu and J. Gui, RSC Adv., 2014, 4, 24863–24869 RSC.
- G. Jiang, X. Li, M. Lan, T. Shen, X. Lv, F. Dong and S. Zhang, Appl. Catal., B, 2017, 205, 532–540 CrossRef CAS.
- T. Xiong, W. Cen, Y. Zhang and F. Dong, ACS Catal., 2016, 6, 2462–2472 CrossRef CAS.
- Z. F. Huang, J. Song, L. Pan, Z. Wang, X. Zhang, J. J. Zou, W. Mi, X. G. Zhang and L. Wang, Nano Energy, 2015, 12, 646–656 CrossRef CAS.
- K. Wang, Q. Li, B. Liu, B. Cheng, W. Ho and J. Yu, Appl. Catal., B, 2015, 176–177, 44–52 CrossRef CAS.
- Y. P. Zhu, T. Z. Ren and Z. Y. Yuan, ACS Appl. Mater. Interfaces, 2015, 7, 16850–16856 CAS.
- W. Zhang, Z. Zhao, F. Dong and Y. Zhang, Chin. J. Catal., 2017, 38, 372–378 CrossRef CAS.
- Z. Huang, F. Li, B. Chen and G. Yuan, RSC Adv., 2015, 5, 14027–14033 RSC.
- L. Y. Chen and W. D. Zhang, Appl. Surf. Sci., 2014, 301, 428–435 CrossRef CAS.
- H. Shi, G. Chen, C. Zhang and Z. Zou, ACS Catal., 2016, 4, 3637–3643 CrossRef.
- W. Jiang, W. Luo, J. Wang, M. Zhang and Y. Zhu, J. Photochem. Photobiol., C, 2016, 28, 87–115 CrossRef CAS.
- H. Huang, K. Xiao, N. Tian, X. Du and Y. Zhang, Colloids Surf., A, 2016, 511, 64–72 CrossRef CAS.
- F. Dong, T. Xiong, Y. Sun, Y. Zhang and Y. Zhou, Chem. Commun., 2015, 51, 8249–8252 RSC.
- Z. Zhang, D. Jiang, D. Li, M. He and M. Chen, Appl. Catal., B, 2016, 183, 113–123 CrossRef CAS.
- Y. Sun, W. Zhang, T. Xiong, Z. Zhao, F. Dong, R. Wang and W. K. Ho, J. Colloid Interface Sci., 2014, 418, 317–323 CrossRef CAS PubMed.
- S. Thaweesak, M. Lyu, P. Peerakiatkhajohn, T. Butburee, B. Luo, H. Chen and L. Wang, Appl. Catal., B, 2017, 202, 184–190 CrossRef CAS.
- B. Yuan, J. Wei, T. Hu, H. Yao, Z. Jiang, Z. Fang and Z. Chu, Chin. J. Catal., 2015, 36, 1009–1016 CrossRef CAS.
- W. J. Ong, L. L. Tan, S. P. Chai, S. T. Yong and A. R. Mohamed, Nano Energy, 2015, 13, 757–770 CrossRef CAS.
- S. Hu, W. Zhang, J. Bai, G. Lu, L. Zhang and G. Wu, RSC Adv., 2016, 6, 25695–25702 RSC.
- C. Jian, X. Xu, L. Tao, K. Pandiselvi and J. Wang, Sci. Rep., 2016, 6, 37318 CrossRef PubMed.
- Y. Li, M. Wang, S. J. Bao, S. Lu, M. Xu, D. Long and S. Pu, Ceram. Int., 2016, 42, 18521–18528 CrossRef CAS.
- Y. Li, R. Jin, F. Xu, Y. Yang, Y. Man, X. Liu, Y. Xing and S. Song, J. Hazard. Mater., 2016, 313, 219–228 CrossRef CAS PubMed.
- M. Fu, Q. Jiao and Y. Zhao, Mater. Charact., 2013, 86, 303–315 CrossRef CAS.
- K. Zhang, L. L. Zhang, X. S. Zhao and J. Wu, Chem. Mater., 2010, 22, 1392–1401 CrossRef CAS.
- Q. Cai, J. Shen, Y. Feng, Q. Shen and H. Yang, J. Alloys Compd., 2015, 628, 372–378 CrossRef CAS.
- R. C. Pawar, V. Khare and C. S. Lee, Dalton Trans., 2014, 43, 12514–12527 RSC.
- M. Xu, L. Han and S. Dong, ACS Appl. Mater. Interfaces, 2013, 5, 12533–12540 CAS.
- H. Gu, T. Zhou and G. Shi, Talanta, 2015, 132, 871–876 CrossRef CAS PubMed.
- S. Hu, W. Zhang, J. Bai, G. Lu, L. Zhang and G. Wu, RSC Adv., 2016, 6, 25695–25702 RSC.
- A. Siahvashi, D. Chesterfield and A. A. Adesina, Chem. Eng. Sci., 2013, 93, 313–325 CrossRef CAS.
- S. C. Yan, Z. S. Li and Z. G. Zou, Langmuir, 2010, 26, 3894–3901 CrossRef CAS PubMed.
- C. Han, G. Lei, C. Chen, Y. Li, X. Xiao, Y. Zhang and L. Guo, Appl. Catal., B, 2014, 147, 546–553 CrossRef CAS.
- E. Karamian and S. Sharifnia, J. CO2 Util., 2016, 16, 194–203 CrossRef CAS.
- Y. Bai, T. Chen, P. Wang, L. Wang, L. Ye, X. Shi and W. Bai, Sol. Energy Mater. Sol. Cells, 2016, 157, 406–414 CrossRef CAS.
Footnote |
| † Electronic supplementary information (ESI) available. See DOI: 10.1039/c7ra06210a |
| This journal is © The Royal Society of Chemistry 2017 |

