 Open Access Article
The exceptional adsorption ability and gas-detection sensitivity of Cu2O with tunable morphologies†
Xing Wang,
Xuejian Huo,
Elisée Muhire and
Meizhen Gao *
*
Key Laboratory for Magnetism and Magnetic Materials of MOE, School of Physical Science and Technology, Lanzhou University, 730000 Lanzhou, China. E-mail: gaomz@lzu.edu.cn; Tel: +86 931 8914160
First published on 14th July 2017
Abstract
The systematic and delicate geometry control of Cu2O nanostructures with different size can be achieved by simply tuning the dropping speed of NH2OH HCl, the volume of solvent and the concentration of NaOH. All the Cu2O nanocrystals exhibit better adsorption ability than granular active carbon on MO (methyl orange), and the hollow sphere Cu2O shows the best adsorption performance, MO with a concentration of 15 mg L−1 is completely absorbed by the hollow sphere Cu2O in 5 min. The gas detection sensitivity is also investigated and the hollow sphere structures exhibit the best gas-sensing response, and more importantly, at low temperature and even ppb level it also exhibits a remarkably high response, fast response, recovery time and good stability.
Introduction
It is well known that the electronic structure, bonding, surface energy and chemical reactivity of nanomaterials are closely associated with their shape.1–4 These nanomaterials with well-defined shapes and different crystallographic characters have enormous potential applications such as gas sensor, catalysis, magnetic photodecomposition and molecular adsorption.5–8 Therefore, it is important to delicately control the synthesized morphologies with different surfaces structures and study their corresponding chemical and physical properties.As an excellent p-type semiconductor material with a direct band gap of 2.17 eV, the inexpensive, non-toxic and abundantly available Cu2O has excellent optical and magnetic properties, which can be applied in lithium-ion batteries,9,10 gas sensors,11–15 organic dye adsorption,16,17 catalysis,1,18–20 glucose sensing,21 and solar-energy conversion.22,23 Considering their wide applications, great efforts have been devoted to investigate the controlled synthesis of various shapes of Cu2O. By adjusting the added PVP, Zhang et al. reported a variety of Cu2O nanocrystals from cubes to octahedrons, and the as-prepared products demonstrate crystallography-dependent adsorption ability with MO.17 Lee et al. reported one-pot synthesis phase-pure Cu2O nanocubes with a hierarchical structure by employing PEG and glucose as structure-directing agent and reductant, respectively, and the hierarchical nanocubes offer improved accessible surface active sites and optical/electronic properties.24 Huang et al. synthesized sub-100 nm Cu2O nanocrystals with shape evolution from cubic to octahedral by adjusting the hydrazine volume, and all the samples display high product yields as catalysts in the direct synthesis of 1,2,3-triazoles.25 However, few reports about systematic study of the effect of reductant NH2OH HCl and precursors on geometry and size of Cu2O have been found. Therefore a simple and mild way to synthesize Cu2O nanostructures without any surfactant additives is put forward in this work, and the effect of reducing agent NH2OH HCl and precursors on Cu2O morphology and size is discussed in detail. This work provides a straightforward green synthesis method to synthesize the Cu2O crystals with shape evolution from cube to octahedron and hollow sphere structure, and the size evolution from 800 nm to 100 nm. The as-prepared Cu2O exhibits excellent adsorption ability to MO and noticeable response to ethanol even at low temperature of 140 °C and 1 ppm.
Experimental
Materials synthesis
All the chemicals, CuCl2·2H2O (99%, Reagent), NaOH (96%, Reagent), NH2OH HCl (98.5%, Kemiou), MO (Ind), powdered active carbon (Kemiou) and granular active carbon (ZK 4.0, Guangzhou Hong Carbon) are analytical grade and used without further purification. For the synthesis of Cu2O nanocrystals, 0.34 g (2 mmol) CuCl2 was dissolved into 60 mL distilled water, after stirring for 10 min, a amount of NaOH added into the solution followed by stirring for another 10 min. After that, 10 mL of 2 M NH2OH HCl solution was slowly added into the blue aqueous as reductant and stirred for 30 min. All the synthesized precipitates were collected and washed with ethanol and water thoroughly, and dried at 50 °C for 12 hours.Characterization
The structures of Cu2O are characterized by X-ray diffraction (XRD, X'Pert Philips diffractometer, Cu Kα). The morphologies are investigated by field emission scanning electron microscopy (SEM, Hitachi S-4800). Transmission electron microscopic (TEM) images and high-resolution transmission electron microscopic (HRTEM) images are performed on a FEI, Tecnai G2 F30. UV-Vis spectra are recorded on Shimadzu UV 3600.Adsorption properties research
The adsorption activities of the different shaped Cu2O are explored using MO as pollutant. 0.05 g Cu2O was dispersed into 80 mL MO solution, and stirred in the dark, 5 mL of the mixture solution was taken out at different intervals. The concentration of MO is recorded by the UV-Vis spectrum.Gas sensor application for ethanol detection
Cu2O sensors are fabricated by depositing slurry of the samples onto the alumina tube with two platinum wires attaching to each gold electrode, and a Ni–Cr alloy filament is put through the alumina tube and used as a heater by tuning the voltage (V). The sensors are aged for 5 days on the measurement system before gas sensing test. Then the gas sensing tests are performed on a WS-30A gas sensing measurement system (Weisheng Instrument Co., Zhengzhou, China). A voltage (5 V) is applied to the heating resistor. The gas response is defined as Rg/Ra, where Rg and Ra are the resistances of the sensor in target gas and air atmosphere, respectively. The response time and recovery time are defined as the time taken by the sensor to achieve 90% of total resistance change in the case of adsorption and desorption, respectively. A working temperature of 240 °C is selected.Results and discussion
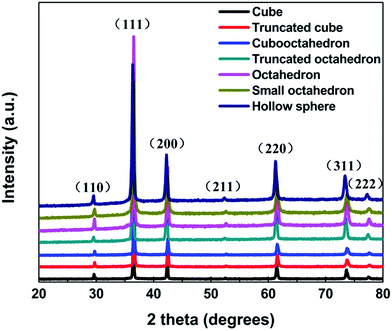
Fig. 1 shows the X-ray diffraction patterns of different samples. All the diffraction peaks can be perfectly indexed to the (110), (111), (200), (211), (220), (311) and (222) planes of cubic phase of Cu2O (JCPDS NO. 77-0199), and no peaks from other phase have been detected revealing the high purity of the synthesized samples. The average crystal size of cubic, truncated cubic, cubooctahedral, truncated octahedral, octahedral, small octahedron and hollow sphere are calculated to be about 5.4, 5.1, 4.3, 4.0, 4.6, 2.5 and 2.9 nm, respectively. Which according to the Debye-Scherer formula (D = 0.89λ/β![[thin space (1/6-em)]](https://www.rsc.org/images/entities/char_2009.gif) cos
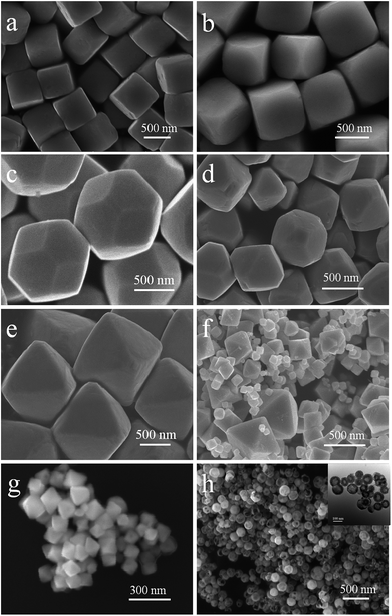
cos![[thin space (1/6-em)]](https://www.rsc.org/images/entities/char_2009.gif) θ, where λ is the X-ray wavelength (1.5418 Å), θ is the Bragg diffraction angle of the peak, and β is the peak width at half maximum).26 Fig. 2a–h shows the different morphologies of Cu2O synthesized at different conditions. When the solvent volume is 150 mL, cubic Cu2O particles with diameters of about 700 nm with six exposed {100} facets17,27–29 can be formed (Fig. 2a). As the solvent volume decreased to 120 mL, the truncated cubic Cu2O particles with diameter of about 700 nm can be formed. The Cu2O crystals have 8 triangle {111} with edge length of about 200 nm and 6 square {100} facets with length of about 400 nm (Fig. 2b), and the edge length ratio of {111} facets and {100} facets is 1
θ, where λ is the X-ray wavelength (1.5418 Å), θ is the Bragg diffraction angle of the peak, and β is the peak width at half maximum).26 Fig. 2a–h shows the different morphologies of Cu2O synthesized at different conditions. When the solvent volume is 150 mL, cubic Cu2O particles with diameters of about 700 nm with six exposed {100} facets17,27–29 can be formed (Fig. 2a). As the solvent volume decreased to 120 mL, the truncated cubic Cu2O particles with diameter of about 700 nm can be formed. The Cu2O crystals have 8 triangle {111} with edge length of about 200 nm and 6 square {100} facets with length of about 400 nm (Fig. 2b), and the edge length ratio of {111} facets and {100} facets is 1![[thin space (1/6-em)]](https://www.rsc.org/images/entities/char_2009.gif) :
:![[thin space (1/6-em)]](https://www.rsc.org/images/entities/char_2009.gif) 2. The cubooctahedral Cu2O with diameter of about 700 nm as shown in Fig. 2c can be formed by decreasing the solvent volume to 60 mL. As same as the truncated cubic Cu2O, the cubooctahedral Cu2O crystals also have 8 {111} and 6 {100} facets, but the edge length of hexagonal {111} facets and square {100} facets is about 300 nm and the edge length ration of {111} facets and {100} facets is about 1
2. The cubooctahedral Cu2O with diameter of about 700 nm as shown in Fig. 2c can be formed by decreasing the solvent volume to 60 mL. As same as the truncated cubic Cu2O, the cubooctahedral Cu2O crystals also have 8 {111} and 6 {100} facets, but the edge length of hexagonal {111} facets and square {100} facets is about 300 nm and the edge length ration of {111} facets and {100} facets is about 1![[thin space (1/6-em)]](https://www.rsc.org/images/entities/char_2009.gif) :
:![[thin space (1/6-em)]](https://www.rsc.org/images/entities/char_2009.gif) 1. As the dropping speed of NH2OH HCl solution increasing to 1 drop/1 s, truncated octahedral Cu2O particles can be formed (Fig. 2d). The truncated octahedral Cu2O crystals also have 8 {111} and 6 {100} facets, and the long edge length of {111} facet is about 500 nm, the length of square {100} facets is about 250 nm, the length ratio is about 2
1. As the dropping speed of NH2OH HCl solution increasing to 1 drop/1 s, truncated octahedral Cu2O particles can be formed (Fig. 2d). The truncated octahedral Cu2O crystals also have 8 {111} and 6 {100} facets, and the long edge length of {111} facet is about 500 nm, the length of square {100} facets is about 250 nm, the length ratio is about 2![[thin space (1/6-em)]](https://www.rsc.org/images/entities/char_2009.gif) :
:![[thin space (1/6-em)]](https://www.rsc.org/images/entities/char_2009.gif) 1. Rapidly pouring the NH2OH HCl into the mixed solution, the high symmetry octahedral Cu2O exposed only {111} facets can be formed and the edge length of octahedron is about 800 nm (Fig. 2e). With the increase of edge length ration of {111} and {100} facets, the surface area of exposed {111} facets is also increasing. When the concentration of NaOH is 0.8 M, the final product contains different sizes of Cu2O ranging from 500 nm to 100 nm (Fig. 2f). As the concentration of NaOH decreases to 0.6 M, the average size of the synthesized Cu2O crystals is about 100 nm (Fig. 2g). When the concentration of NaOH is 0.5 M, the hollow sphere Cu2O can be synthesized with the average diameters of 100 nm (Fig. 2h). With the concentration of NaOH decreasing, the size of Cu2O particles tends to decrease from about 800 nm to 100 nm. The quantified crystallographic features regarding the exposed surfaces of the architectures are proved by TEM and the corresponding selected area electron diffraction (SAED), which is depicted in the ESI (Fig. S2–S4†). The Cu2O particles can be formed through the following reaction [eqn (1)–(5)]:
1. Rapidly pouring the NH2OH HCl into the mixed solution, the high symmetry octahedral Cu2O exposed only {111} facets can be formed and the edge length of octahedron is about 800 nm (Fig. 2e). With the increase of edge length ration of {111} and {100} facets, the surface area of exposed {111} facets is also increasing. When the concentration of NaOH is 0.8 M, the final product contains different sizes of Cu2O ranging from 500 nm to 100 nm (Fig. 2f). As the concentration of NaOH decreases to 0.6 M, the average size of the synthesized Cu2O crystals is about 100 nm (Fig. 2g). When the concentration of NaOH is 0.5 M, the hollow sphere Cu2O can be synthesized with the average diameters of 100 nm (Fig. 2h). With the concentration of NaOH decreasing, the size of Cu2O particles tends to decrease from about 800 nm to 100 nm. The quantified crystallographic features regarding the exposed surfaces of the architectures are proved by TEM and the corresponding selected area electron diffraction (SAED), which is depicted in the ESI (Fig. S2–S4†). The Cu2O particles can be formed through the following reaction [eqn (1)–(5)]:| Cu2+ + 2OH− → Cu(OH)2↓ | (1) |
| Cu(OH)2 + 2OH− ↔ [Cu(OH)4]2− | (2) |
| NH2OH HCl ↔ NH2OH + HCl | (3) |
| 2[Cu(OH)4]2− + 2NH2OH → Cu2O + N2↑ + 5H2O + 4OH− | (4) |
| 2Cu(OH)2 + 2NH2OH → Cu2O + N2↑ + 5H2O | (5) |
As shown in eqn (3), NH2OH HCl can decompose into NH2OH and HCl, which is a reversible reaction, and NH2OH can deoxidize Cu2+ to Cu+ [eqn (4) and (5)]. The redox reaction occurs as soon as adding the NH2OH HCl into the mixed solution under the vigorous stirring conditions, thus slowly dropping NH2OH HCl can make the concentration of NH2OH HCl in the mixed solution lower than rapidly injecting the NH2OH HCl into the mixed solution. Increasing the volume of solvent and slowly dropping NH2OH HCl into the solution can achieve low concentration of NH2OH HCl in the mixed solution. As illustrated in Fig. 3, increasing the dropping speed of NH2OH HCl, the products experienced a shape evolution from cubooctahedrons to truncated octahedron and finally to octahedron at the volume of 60 mL of solvent. And increasing the volume of solvent, the shape of Cu2O evolved from cubooctahedrons to truncated cube and finally to cube while the dropping speed of NH2OH HCl solution keeps 1 drop/2 s. This may due to the concentration of NH2OH HCl will influence the relative growth rate along the [100] direction to that of [111] direction.30 With decreasing concentration of NH2OH HCl, Cu2O tend to grow along [100] direction to form cubooctahedral, truncated cubic or cubic structure and vice versa, it is easier for Cu2O to grow along the [111] direction to form truncated octahedral or octahedral structure with increasing the concentration of NH2OH HCl.
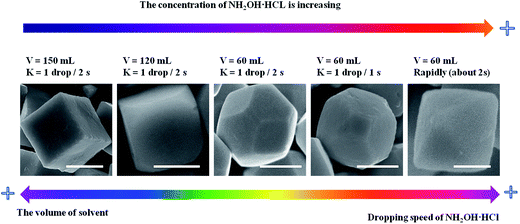 | ||
| Fig. 3 The evolution of Cu2O morphology with the change of the concentration of NH2OH HCl. Scale bar is equal to 500 nm. | ||
As shown in Fig. 2e–g and 4a, the size of octahedral Cu2O gradually decreases as the concentration of NaOH decreasing. When the concentration of NaOH is 2 M, almost all the precursor existing in the solution is [Cu(OH)4]2−, then the octahedrons with uniform size about 800 nm are achieved (Fig. 2e). Visible Cu(OH)2 suspended particles appear in the solution when the concentration of NaOH is 0.8 M, the final product contains varying size of Cu2O particles (Fig. 2f). When the concentration of NaOH is 0.6 M, a large amount of Cu(OH)2 precipitation appear, then small octahedral Cu2O particles with a size of 100 nm can be formed (Fig. 2g). According to the above analysis, the size of Cu2O particles may be determined by the different precursors Cu(OH)2 or [Cu(OH)4]2−. Regarding the crystallographic surface of Cu2O, every two ‘Cu’ atoms has a dangling bond perpendicular to the (111) plane, but (100) plane is saturated.17 As illustrated in Fig. 4b the octahedral Cu2O possess positive charge surface {111}, [Cu(OH)4]2− is negative, but Cu(OH)2 is neutral. Thus it is easier for [Cu(OH)4]2− to gather around the newborn octahedral Cu2O crystals and form large size of Cu2O crystals. While Cu(OH)2 disperses throughout the solution instead of gathering around the nuclei as it has no charge, then small size of Cu2O can be formed. The formation of hollow sphere structure is due to the etching effect of HCl. When the amount of NaOH is 0.5 M, Cu2O will be inevitably etched by acid, thus the hollow sphere Cu2O can be formed.
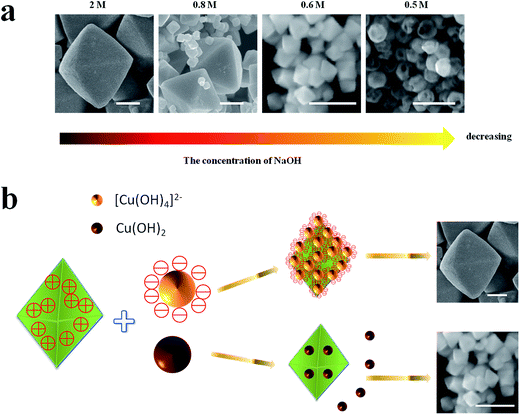 | ||
| Fig. 4 (a) The size evolution of Cu2O crystals with the decreasing of the concentration of NaOH, (b) the mechanism of Cu2O size evolution. Scale bar is equal to 300 nm. | ||
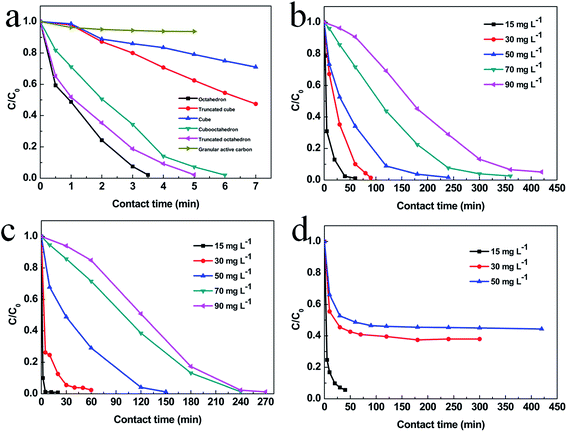
To explore the adsorption ability of the as-prepared Cu2O nanocrystals, different concentration of MO is used as the pollutant. Dependence of MO adsorption amount on time is shown in Fig. 5. The MO with a concentration of 15 mg L−1 is completely adsorbed after 3.5 h, 5 h, 6 h for octahedral, truncated octahedral and cubooctahedral Cu2O, respectively. For Cu2O truncated cube and cube, the rest of MO is 41% and 72% respectively after 7 h. But after 7 h, the concentration of MO only reduced to 93% for granular active carbon. The absorbance versus time for small octahedral Cu2O, hollow sphere Cu2O and powdered active carbon are shown in Fig. 5b–d. It is found that MO with a concentration of 15 mg L−1 is completely adsorbed in 5 min for hollow sphere Cu2O, and about 40 min are needed for small octahedron Cu2O and powdered active carbon. Increasing the concentration of MO to 30 mg L−1, 50 mg L−1 and 90 mg L−1, the small octahedral and hollow sphere Cu2O still show better adsorption than powdered active carbon. The corresponding adsorption kinetics of methyl orange on Cu2O with various geometries is shown in Fig. S7–S9 and Tables S1–S3.† And the kinetic parameters of various Cu2O geometries has calculated according to the W – M intraparticle diffusion model and which is shown in Fig. S11 and S10† shows the typical plot of Weber and Moris's intraparticle diffusion model. The better adsorption performance can be attributed to their small grain size and large BET specific surface area, which are 1.7, 1.8, 2.7, 3.7, 2.2, 12.5 and 12.4 m2 g−1 for cube, truncated cube, cubooctahedron, truncated octahedron, octahedron, small octahedron and hollow sphere Cu2O respectively. Besides, the hollow sphere Cu2O shows less package density than other geometries which enhance the adsorption performance further.31
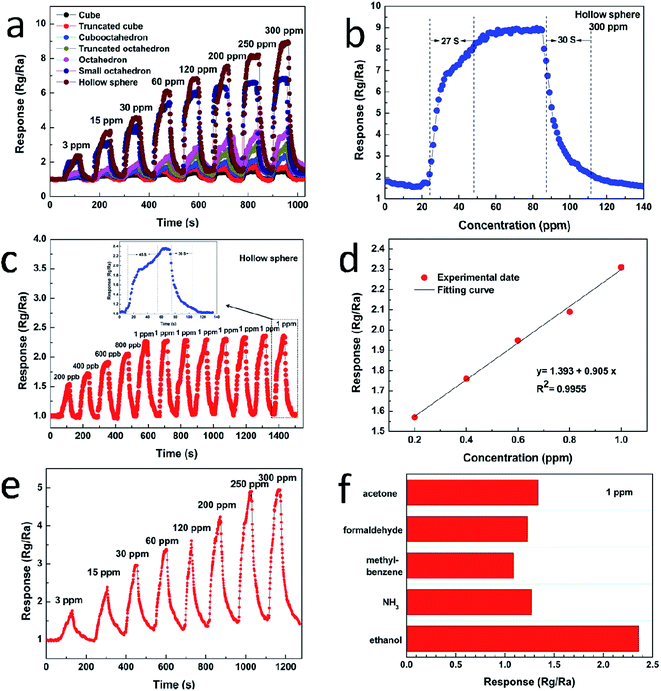
Fig. 6a displays the dynamic response–recovery curves of the sensors toward ethanol with the concentration range from 3 to 300 ppm at 240 °C. It can be seen that the resistance of the sensor increases upon injection of ethanol and it is consistent with the sensing behavior of p-type semiconductor sensor. The response amplitude is highly dependent on gas concentration, and increases stepwise with increasing gas concentration. Once again, the hollow sphere Cu2O exhibits the highest response amplitude to ethanol. Taking 300 ppm of ethanol as example, the response of the hollow sphere is 5.74, 4.96, 3.61, 2.90, 2.21, 1.30 times higher than that of cube, truncated cube, cubooctahedron, truncated octahedron, octahedron and the small octahedron, respectively. Fig. 6b shows the transient response of the sensor based on hollow sphere Cu2O to 300 ppm ethanol at 240 °C. The response of hollow sphere Cu2O is about 9.07–300 ppm ethanol. The response time and recovery time are about 27 s and 30 s, respectively. Fig. 6c shows the actual response of the hollow sphere Cu2O sensor exposed to low-ppb-level ethanol, ranging from 200–1000 ppb. It is found that even a very low concentration of ethanol, i.e. 200 ppb, can be effectively detected. The corresponding responses are 1.57, 1.76, 1.95, 2.09 and 2.36 for 200, 400, 600, 800 and 1000 ppb ethanol, respectively. In addition, the reproducibility of hollow sphere Cu2O sensor is studied with 1 ppm ethanol, the result demonstrates that the sensor nearly maintains its initial value of response during eight tests. The inset (Fig. 6c) is the enlarged response–recovery curve of the sensors to 1 ppm ethanol and the response and recovery times is about 45 s and 36 s, respectively. Fig. 6d shows the dependence of the sensor response on the ethanol gas concentration in the range of 200 ppb to 1 ppm, which is approximately linear, the linearity is y = 1.393 + 0.905x with a relative correlative coefficient R2 = 0.9955 by fitting of the experimental date. Fig. 6e shows the dynamic response of hollow sphere exposed to various concentration of ethanol form 3 to 300 ppm at a lower working temperature of 140 °C. It is exciting to find that the hollow sphere exhibits high sensitivity to ethanol even at lower temperature, the sensitivity increases from 1.62 to 4.91 with the concentration of ethanol increasing from 3 to 300 ppm. Fig. 6f shows the sensitivities of the hollow sphere sensors to 1 ppm of ethanol, NH3, methylbenzene, formaldehyde and acetone. Obviously, the hollow sphere Cu2O shows high sensitivity and good selectivity to ethanol.
Cu2O is a typical p-type semiconductor and its conductivity is highly influenced by the surface depletion layer, which is characteristic of the surface-controlled type of sensing materials, especially for nanostructures.26 According to this characteristic, the adsorbed oxygen molecules on the material surface are partially ionized into ionized oxygen species (O2−, O− and O2−) in air, and the sensor resistance stands at a relative lower resistance level. When the gas sensor is exposed to reducing gas e.g. ethanol, the electrons species would react with the gas molecules and release electrons back to the valence band, which reduces the electric charge of the depletion layer and increases the layer resistance.
Conclusions
In summary, a simple, surfactant-free synthetic approach has been put forward to synthesize a series of Cu2O nanocrystals with the morphology from cube to hollow sphere and the size from 800 nm to 100 nm. The concentration of NH2OH HCl in the mixed solution can affect the growth rate along the [100] direction. The small octahedral and hollow sphere Cu2O nanostructures can be formed by different precursors. All the Cu2O show better adsorption performance than granular active carbon on MO. Furthermore the hollow sphere Cu2O nanocrystals show the best adsorption performance. In addition, gas sensing investigation shows that the hollow sphere Cu2O have excellent gas sensitivity which can be applied to ethanol sensor.Acknowledgements
This work was financially supported by the NSFC (No. 11674143) and the MOE (No. IRT1251 & 20130211130003) of China.References
- L. Wang, J. Ge, A. Wang, M. Deng, X. Wang, S. Bai, R. Li, J. Jiang, Q. Zhang, Y. Luo and Y. Xiong, Angew. Chem., Int. Ed., 2014, 53, 5107–5111 CAS.
- A. Tao, S. Habas and P. D. Yang, Small, 2008, 4, 310–325 CrossRef CAS.
- Z. G. Liu, Y. F. Sun, W. K. Chen, Y. Kong, Z. Jin, X. Chen, X. Zheng, J. H. Liu, X. J. Huang and S. H. Yu, Small, 2015, 11, 2493–2498 CrossRef CAS PubMed.
- X. B. Liu, H. J. Du, P. H. Wang, T. T. Lim and X. W. Sun, J. Mater. Chem. C, 2014, 2, 9536–9542 RSC.
- S. Rej, H. J. Wang, M. X. Huang, S. C. Hsu, C. S. Tan, F. C. Lin, J. S. Huang and M. H. Huang, Nanoscale, 2015, 7, 11135–11141 RSC.
- M. H. Huang, S. Rej and S. C. Hsu, Chem. Commun., 2014, 50, 1634–1644 RSC.
- Y. Shang and L. Guo, Adv. Sci., 2015, 2, 1500140 CrossRef PubMed.
- K. Mudiyanselage, S. D. Senanayake, L. Feria, S. Kundu, A. E. Baber, J. Graciani, A. B. Vidal, S. Agnoli, J. Evans, R. Chang, S. Axnanda, Z. Liu, J. F. Sanz, P. Liu, J. A. Rodriguez and D. J. Stacchiola, Angew. Chem., Int. Ed., 2013, 52, 5101–5105 CrossRef CAS PubMed.
- L. Hu, Y. M. Huang, F. P. Zhang and Q. W. Chen, Nanoscale, 2013, 5, 4186–4190 RSC.
- J. C. Park, J. Kim, H. Kwon and H. Song, Adv. Mater., 2009, 21, 803–807 CrossRef CAS.
- H. Meng, W. Yang, K. Ding, L. Feng and Y. F. Guan, J. Mater. Chem. A, 2015, 3, 1174–1181 CAS.
- P. Rai, R. Khan, S. Raj, S. M. Majhi, K. K. Park, Y. T. Yu, I. H. Lee and P. K. Sekhar, Nanoscale, 2014, 6, 581–588 RSC.
- L. Guan, H. Pang, J. Wang, Q. Lu, J. Yin and F. Gao, Chem. Commun., 2010, 46, 7022–7024 RSC.
- X. J. Wan, J. L. Wang, L. F. Zhu and J. N. Tang, J. Mater. Chem. A, 2014, 2, 13641 CAS.
- Y. M. Sui, Y. Zeng, W. T. Zheng, B. B. Liu, B. Zou and H. B. Yang, Sens. Actuators, B, 2012, 171–172, 135–140 CrossRef CAS.
- X. Q. Ge, H. M. Hu, C. H. Deng, Q. Zheng, M. Wang and G. Y. Chen, Mater. Lett., 2015, 141, 214–216 CrossRef CAS.
- D. F. Zhang, H. Zhang, L. Guo, K. Zheng, X. D. Han and Z. Zhang, J. Mater. Chem., 2009, 19, 5220–5225 RSC.
- B. Lu, A. Liu, H. Wu, Q. Shen, T. Zhao and J. Wang, Langmuir, 2016, 32, 3085–3094 CrossRef CAS PubMed.
- Y. Zhang, B. Deng, T. R. Zhang, D. M. Gao and A. W. Xu, J. Phys. Chem. C, 2010, 114, 5073–5079 CAS.
- E. M. Zahran, N. M. Bedford, M. A. Nguyen, Y. J. Chang, B. S. Guiton, R. R. Naik, L. G. Bachas and M. R. Knecht, J. Am. Chem. Soc., 2014, 136, 32–35 CrossRef CAS PubMed.
- D. L. Zhou, J. J. Feng, L. Y. Cai, Q. X. Fang, J. R. Chen and A. J. Wang, Electrochim. Acta, 2014, 115, 103–108 CrossRef CAS.
- L. I. Hung, C. K. Tsung, W. Y. Huang and P. D. Yang, Adv. Mater., 2010, 22, 1910–1914 CrossRef CAS PubMed.
- C. M. McShane and K. S. Choi, J. Am. Chem. Soc., 2009, 131, 2561–2569 CrossRef CAS PubMed.
- S. Kumar, C. M. A. Parlett, M. A. Isaacs, D. V. Jowett, R. E. Douthwaite, M. C. R. Cockett and A. F. Lee, Appl. Catal., B, 2016, 189, 226–232 CrossRef CAS.
- Y. H. Tsai, K. Chanda, Y. T. Chu, C. Y. Chiu and M. H. Huang, Nanoscale, 2014, 6, 8704–8709 RSC.
- X. Zhou, J. Y. Liu, C. Wang, P. Sun, X. L. Hu, X. W. Li, K. Shimanoe, N. Yamazoe and G. Lu, Sens. Actuators, B, 2015, 206, 577–583 CrossRef CAS.
- Q. Hua, T. Cao, X. K. Gu, J. Lu, Z. Jiang, X. Pan, L. Luo, W. X. Li and W. Huang, Angew. Chem., Int. Ed., 2014, 53, 4856–4861 CrossRef CAS PubMed.
- K. Chanda, S. Rej and M. H. Huang, Chemistry, 2013, 19, 16036–16043 CrossRef CAS PubMed.
- Q. Hua, D. L. Shang, W. H. Zhang, K. Chen, S. J. Chang, Y. S. Ma, Z. Q. Jiang, J. L. Yang and W. X. Huang, Langmuir, 2011, 27, 665–671 CrossRef CAS PubMed.
- C. H. Kuo and M. H Huang, J. Phys. Chem. C, 2008, 112, 18355–18360 CAS.
- C. H. Kuo and M. H. Huang, J. Am. Chem. Soc., 2008, 130, 12815–12820 CrossRef CAS PubMed.
Footnote |
| † Electronic supplementary information (ESI) available. See DOI: 10.1039/c7ra06453e |
| This journal is © The Royal Society of Chemistry 2017 |

