 Open Access Article
Pressure-induced changes in the electronic structure and enhancement of the thermoelectric performance of SnS2: a first principles study†
Y. Javeda,
M. A. Rafiq *a and
Nisar Ahmedb
aMicro and Nano Devices Group, Department of Metallurgy and Materials Engineering, Pakistan Institute of Engineering and Applied Sciences, PO Nilore, Islamabad, 45650, Pakistan. E-mail: aftab@cantab.net
bDepartment of Physics and Applied Mathematics, Pakistan Institute of Engineering and Applied Sciences, PO Nilore, Islamabad, 45650, Pakistan
First published on 8th August 2017
Abstract
The thermoelectric properties of SnS2 have been studied using ab initio calculations with a full potential linearized augmented plane-wave technique and semi classical Boltzmann theory. We studied the thermoelectric properties of SnS2 at 300 K, 500 K and 800 K and hydrostatic pressures of 0 GPa, 10 GPa and 20 GPa. The transport properties were found to be anisotropic owing to the layered structure of SnS2. The electrical conductivity particularly shows strong anisotropy at 0 GPa pressure, presenting a larger value in the a direction than the c direction. Hydrostatic pressure causes the lattice constants to be decreased and induces changes in the electronic structure. There is reduction in the band gap and, as a result, the thermoelectric coefficients are affected. The thermopower becomes nearly isotropic at higher pressures. At 20 GPa we found that electrical conductivity as well as the power factor show a change in anisotropy by presenting a higher value in the c direction than in the a direction, which is obvious at all temperatures. The power factor exhibits an increase at higher pressures and higher temperatures. At 0 GPa and 800 K the power factor is calculated to be 11.89 × 10⁻⁴ W K−2 m−1 and 3.15 × 10⁻⁴ W K−2 m−1 in the a and c directions, respectively. At 20 GPa and 800 K the maximum value of the power factor is observed in the c direction, which is computed to be 12.10 × 10⁻⁴ W K−2 m−1 at a carrier concentration of 4 × 1020 cm−3. By comparing power factor in the c direction at 800 K calculated at 0 GPa and 20 GPa, we observed an enhancement by ∼3.8 times. It is due to this large enhancement that by increasing the pressure to 20 GPa at 800 K the average power factor was also found to increase by 33%. At 20 GPa and 800 K the value of the figure of merit (ZT) was found to be greater than 1 in the c direction. We hope that this study will provide useful information in further enhancing the thermoelectric properties of SnS2.
Introduction
Thermoelectricity has been an important research area for a long time. Renewed interest has recently been generated due to the implications in the development of renewable energy sources.1 Thermoelectric (TE) generators have many advantages, like being noiseless and having no moving parts or working fluids. These factors are expanding their fields of application. They are now used in the aerospace and military industries as well. Several materials have been explored for thermoelectric generation, e.g. lead, antimony, tellurium, and selenium. These materials have proved to be more efficient thermoelectric materials but as they are toxic in nature they are not safe to handle. Apart from this, these materials are expensive and less abundant. Therefore, it is a challenge to search for non-toxic, low cost and environment friendly materials for thermoelectric applications. Metal chalcogenides like SnS2 are earth-abundant, non-toxic and environmental friendly, hence their use in various applications is of due importance.2The efficiency of a TE material is measured by the figure of merit, ZT = S2σT/κ, which depends on the Seebeck coefficient (S), electrical conductivity (σ), and thermal conductivity (κ).1 The thermal conductivity consists of electronic (κe) and lattice (κl) contributions. The quantity S2σ is termed as the power factor. In general, the figure of merit can be enhanced either by increasing the power factor (S2σ) or by decreasing the thermal conductivity. Therefore, thermoelectricity research focuses on minimizing the thermal conductivity or maximizing the power factor.3
Previous TE studies suggest that SnS2 possesses a high power factor at room temperature and even higher values at higher temperatures. The best ZT values for SnS2 are comparable to that of Bi2Te3 (0.8), a typical thermoelectric material.4 SnS2 possesses a layered structure and therefore exhibits anisotropic character. Owing to their anisotropic behavior, layered compounds appear to be attractive materials for TE applications.3,5–8 The outstanding high ZT value of ∼2.6 for SnSe at 923 K is especially due to this property.9 This is also well evidenced in the layered Bi2Te3-based materials, which are the best TE materials around room temperature.10 In layered structures, an interesting feature is that we can often modify the spacing of the layers and interlayers independently, hence leading to the possibility of tuning the electronic and thermal transport properties, which is a beneficial condition for thermoelectrics.4
Various methods have been suggested for the improvement of ZT for energy storage and conversion applications, e.g. synthesizing new materials and utilizing quantum effects by using materials with complex superlattices, by decreasing the thermal conductivity with induced disorder and nanostructured systems.11,12
Pressure has many potential applications in electronics. For example, pressure can induce semiconductor-to-metal transitions,13 superconductivity in topological insulators,14 conventional insulator-to-topological insulator transitions15 and s-band ferromagnetism in alkali metals.16 Li et al.17 studied the effects of pressure on the dynamical, electronic and transport properties of AuX2 (X = Al, Ga, and In), and found that pressure influenced the band structure close to the Fermi surface and caused changes in the transport properties. The changes in resistivity and phase transformation of HgTe under the influence of pressure have been studied by Blair et al.18
High pressure as well as temperature has a strong influence on a material's density of states (DOS), especially in the vicinity of the electronic gap. Since most TE materials are narrow band gap semiconductors, this pressure dependence of the energy gap allows the optimization of TE properties. Zhurav et al.19 found the energy band gap of PbSe and CdSe to decrease with pressure. Ovsyannikov et al.20 in his studies on Bi2Te3 and PbTe suggested high pressure as a powerful tool for improvement of the performance of thermoelectrics that can open new outlooks in this field. Ovsyannikov et al.21 further found that the application of pressure led to a large improvement of the TE performance of PbTe-based crystals. Shchennikov et al.22 investigated the electrical and thermoelectric properties of Sn2P2S6 under strong compression up to 20 GPa and observed an insulator-to-metal type transition by a lowering of electrical resistivity.
Many studies have been conducted on TE materials for investigation of transport properties under pressure, such as AgSbTe2,23 Sb2Te3,24 Bi2Sr2Co2O9,25 Fe2VAl,26 CoSb3,27 and SnSe,28 and it has been observed that under applied pressure they exhibit a remarkable enhancement of thermoelectric properties. Guo et al.29 carried out a comprehensive investigation on the effect of high pressure on the crystal structure, electronic structure, and transport properties of MoS2 (a similar layered material) and found pressure-enhanced electrical conductivities and significant values of the thermoelectric figure of merit over a wide range of temperatures.
Xu et al.30 observed that SnTe under intermediate pressure and PbTe under high pressure show enhanced thermoelectric performance. In one study it was found that pressure can induce a significantly enhanced power factor in BiTeI, turning an ordinary insulator into a topological insulator.31 Calculated results on MgSn2 show that pressure can lead to a significantly enhanced power factor in n-type doping at the critical pressure, which can be understood by the fact that pressure can induce accidental degeneracies of the conduction band minimum (CBM) at the critical pressure.32 Zou et al.33 studied the effect of hydrostatic pressure on the TE properties of BiCuSeO by first principles and discovered that band structure is modified near the Fermi level by the application of pressure, due to which the electrical conductivity is enhanced. It was concluded that pressure induced changes in the electronic structure as a result of which the TE efficiency of BiCuSeO can be enhanced by suitable doping under external pressure. In a study of SnSe-Pnma by Zhang et al.34 it was observed that pressure boosts the TE properties of SnSe-Pnma. Pressure significantly enhances the TE transport properties along all three directions (a, b and c) of the crystal and makes this material efficient in a moderate temperature range.
Therefore, it is essential to build an understanding of how pressure influences the electronic structure and hence enhances the transport properties. It is also of interest to find out the origins of TE coefficients under pressure. In this study we investigate the change in electronic structure of SnS2 under hydrostatic pressure from first principles. The transport properties are calculated using the semi-classical Boltzmann transport theory and the influence of hydrostatic pressure on the transport properties at various temperatures is studied. The anisotropy of the electric conductivity, thermopower and power factor has been investigated at different pressures and temperatures. The effect of pressure on the transport properties is understood by the change of the electronic structure near the Fermi level. It is hence predicted that hydrostatic pressure can be a useful tool for the enhancement of the thermoelectric properties of SnS2.
Computational details
Structural and electronic calculations were performed within the density functional theory (DFT)35,36 frame work using the all electron, full potential code WIEN2k.37 This package is based on the linearized augmented plane-waves plus local orbitals (LAPW + lo) method.38 Different correlation functionals39–42 are used to calculate the structural and electronic properties. The muffin tin radii (RMT) used (in a.u.) are 2.50 for Sn and 2.06 for S atoms.In the LAPW method, the plane wave cut-off within the interstitial region is controlled by RMTmin × Kmax (RMTmin is the smallest muffin-tin sphere radius and Kmax is the largest plane wave momentum vector). RMTmin × Kmax = 7.0 is chosen for calculations to be converged for the magnitudes presented. To separate the core and valence states, the energy cut-off is set as −7.5 Ry. The reciprocal space integration is performed with a mesh of 12 × 12 × 6 using the modified tetrahedron method,43 which represents 100 k-points in the irreducible Brillouin zone (IBZ). For the computation of band gaps and density of states (DOS), a denser grid is selected.
The unit cell volume is optimized using the LDA functional39 (which gives the most suitable lattice constants), after which the atomic positions are relaxed using a highly efficient algorithm based on simultaneous fixed-point optimization of density and atomic positions.44 The equilibrium cell shape and volume are determined by optimization of all internal degrees of freedom. Self-consistency criteria are set as 10−4 Ry for energy convergence, 10−3 e for charge convergence and 1 mRy a.u.−1 for force convergence. The force criterion for structure relaxation is set at less than 1 mRy per atom.
For electronic calculations, DOS and band structures are calculated using all the exchange correlations incorporated in the code. The band gap is underestimated due to presence of artificial self-interaction and absence of derivative discontinuity in the exchange–correlation potential.45,46 Accurate band gaps are obtained by employing the Tran–Blaha modified functional of Becke–Johnson (TB-mBJ).47,48
The thermoelectric coefficients are calculated using the semi-classical Boltzmann theory49,50 as incorporated in BOLTZTRAP code.51 This scheme employs Fourier expansion of the band energies, provided by first principles electronic structure calculations. It is a rigid band and constant relaxation time approximation. In rigid band approximation (RBA), it is assumed that with doping concentration only the chemical potential changes but the band structure remains unchanged whereas in the constant relaxation time approximation, the relaxation time (τ) is assumed to be energy independent. The advantage is that the Seebeck coefficient can be calculated without adjustable parameters by using this approximation. τ is actually influenced by temperature depending on different scattering mechanisms. For the sake of convenience τ is usually treated as a constant as the calculation of τ is a difficult task.52,53 Choosing τ as a constant is an approximation for the real scattering mechanisms and the main advantage is that it is not necessary to know the detailed scattering processes. This approach is used successfully in predicting the optimal doping level of many materials and has been used to select potential thermoelectric materials.
To calculate the transport properties a denser k-mesh of 40 × 40 × 21 representing 3024 k-points in IBZ is required for the Fermi surface integrals to reach convergence. For the structures under hydrostatic pressures an even denser k-mesh is used.
Results and discussion
Structure
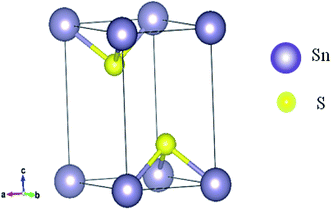
The physical appearance of SnS2 is found to be composed of yellow transparent flakes and crystals having the standard hexagonal crystal structure. SnS2 crystallizes in CdI2-type structure. Within one plane Sn is sandwiched in between two planes of S in such a way that each Sn is octahedrally surrounded by six S atoms. There are three atoms per unit cell.54 S–Sn–S atoms form a trilayer, which is internally covalently bonded in the ab plane and held together by van der Waals forces along the c axis. Fig. 1 shows the SnS2 structure. A comparison of the calculated lattice constants using different correlation functional and experimental values is given in Table 1.| Lattice constant (Å) | Experimental55 | Present study | |||
|---|---|---|---|---|---|
| LDA | PBE-GGA | PBEsol | WC-GGA | ||
| a | 3.65 | 3.636 | 3.709 | 3.657 | 3.661 |
| c | 5.88 | 5.859 | 5.985 | 5.923 | 5.925 |
Fig. 2 shows the effect of hydrostatic pressure on the normalized volume and lattice constants of SnS2. It shows the volume reduction under pressure. Moreover, the contraction of the unit cell is highly anisotropic, as can be seen from the variation of lattice constants with applied pressure. The unit cell axis parallel to the atomic layers is chosen as ‘a’ and the axis oriented perpendicular to the layers as ‘c’. For SnS2 contraction along the c axis is higher as compared to that along the a axis. It suggests that compression along the c axis is more because of interlayer van der Waals forces, while compression of the covalently bonded S–Sn–S within the layer is minimal, as can be seen from Table 2. Similar anisotropic contraction has been observed in MoS2,56 boron nitride and graphite.57 The contraction with hydrostatic pressure agrees with the previously reported results.58 On comparison with experimental values, a lesser anisotropy is observed which may be due to the non-hydrostatic effects in the experiment.59
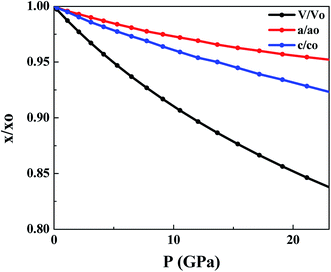 | ||
| Fig. 2 Change in unit cell parameters with pressure. ‘x’ represents a parameter at different pressures and ‘xo’ represents a parameter at 0 GPa. | ||
| P (GPa) | Energy gap (eV) | S–S (Å) | Sn–S (Å) |
|---|---|---|---|
| 0 | 2.15 | 3.5903 | 2.5646 |
| 10 | 1.94 | 3.3169 | 2.5319 |
| 20 | 1.61 | 3.1472 | 2.5100 |
Electronic structure
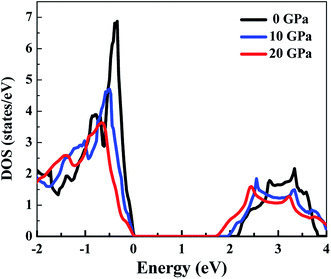
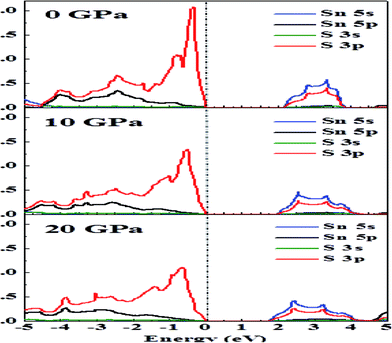
Fig. 3 presents the total DOS for SnS2 at different hydrostatic pressures. The valence band maximum (VBM) is set as zero for the sake of comparison. From the total DOS plot we can see that the valence states are separated from the conduction states by a small energy gap. The value of the energy gap matches with the experimental value of 2.17 eV at 0 GPa.60 At higher pressures there is a reduction in band gap (Table 2), indicating a higher electrical conductivity at higher pressures. From Fig. 3 it can be seen that the conduction band (CB) is more delocalized as compared to the valence band (VB) near the Fermi level, which is an indication that n-type doping will show higher electrical conductivity.4 This is also supported by the experimental studies61,62 according to which SnS2 usually exhibits n-type conduction. Therefore, we have considered only n-type doping in our studies.In Fig. 4, we can see that near the Fermi level the conduction bands are mainly contributed from Sn-5s and S-3p states while the valence bands are primarily composed of Sn-5p and S-3p states. The Fermi level will shift with pressure, and therefore transport properties will be closely related to the electronic states near the VBM or conduction band minimum (CBM). As the pressure is increased, the slope in DOS reduces and a spread is observed. Flatness of the DOS near band edges is an indication of an increase in electrical conductivity.33
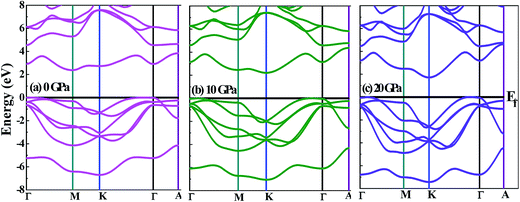
In Fig. 5(b) and (c), as the hydrostatic pressure is increased it is seen that the pockets in the conduction band near the Fermi level become deeper, which is an indication that the effective electron mass becomes smaller, and this will cause the electrical conductivity to increase. It means that by increasing pressure there is a decrease of the effective mass in the conduction band, as a result of which a decrease of thermopower and an increase of the electrical conductivity in n-type materials can be observed.63 We can see more obvious multivalleys at higher hydrostatic pressures, which have been found to be favorable for TE applications.64
Thermoelectric coefficients
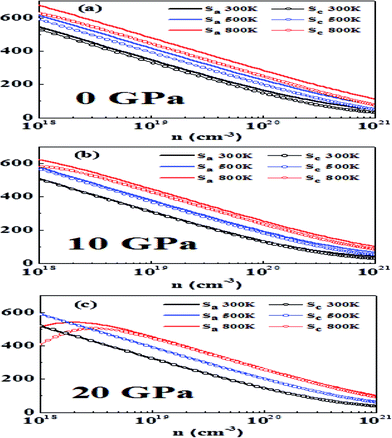 | ||
| Fig. 6 The variation of thermopower (S) in the a and c directions with carrier concentration, temperature and hydrostatic pressure: (a) 0 GPa, (b) 10 GPa and (c) 20 GPa. | ||
It is a general rule in doped semiconductors and metals that thermopower has an inverse relationship with logarithmic carrier concentration as suggested in a previous study on bulk thermoelectric materials.65 At 0 GPa we notice that at 300 K and 500 K Pisarenko-type relationship at low doping is obeyed, which is an indication of single band (non-degenerate) transport. However, at higher doping, a slight deviation from this behavior is observed, which may be attributed to two-band transport and approaching of the degenerate limit.23 At 800 K bipolar conduction is observed. In this case thermopower initially increases with an increase in carrier concentration, reaches a maximum value and then decreases with an increase in concentration.66 As the band gap is decreasing by increasing the pressure a more pronounced bipolar conduction is observed, which acts to reduce the thermopower.67
Another point observed is that the anisotropy in thermopower vanishes with an increase in pressure. This may be attributed to the fact that at higher pressures the conduction bands are lowered and the band that is close to CBM also becomes operative and yields isotropic behavior. A similar behavior was reported earlier in p-type materials where at heavier doping the band whose maximum is just below VBM becomes operative and more isotropic behavior is observed.23
In general, high-performance thermoelectric materials have absolute values of thermopower between 200 and 300 μV K−1 at the relevant temperature.68 At 0 GPa and 300 K the optimum doping levels in the a direction are 1.78 × 10¹⁹ to 6.27 × 10¹⁹ per cm3 and in the c direction 1.48 × 10¹⁹ to 5.05 × 10¹⁹ per cm3.
At 500 K the optimum doping levels in the a direction and the c direction are 4.06 × 10¹⁹ to 1.42 × 10²⁰ per cm3 and 2.98 × 10¹⁹ to 1.00 × 10²⁰ per cm3, respectively. At 800 K, bipolar conduction begins to appear, and the optimum doping levels at this temperature are 8.41 × 10¹⁹ to 2.93 × 10²⁰ per cm3 in the a direction and 5.51 × 10¹⁹ to 1.84 × 10²⁰ per cm3 in the c direction.
Now we study the effect of hydrostatic pressure of 10 GPa on thermopower. At 300 K the optimum doping levels are 1.12 × 10¹⁹ to 3.97 × 10¹⁹ per cm3 in the a direction and 1.09 × 10¹⁹ to 3.81 × 10¹⁹ per cm3 in the c direction. At 500 K the optimum doping levels are 2.61 × 10¹⁹ to 9.21 × 10¹⁹ in the a direction and 2.62 × 10¹⁹ to 7.86 × 10¹⁹ in the c direction. At 800 K the optimum doping levels are 5.80 × 10¹⁹ to 2.07 × 10²⁰ per cm3 and 4.63 × 10¹⁹ to 1.57 × 10²⁰ per cm3 in the a direction and the c direction, respectively.
At 20 GPa and 300 K the optimum doping levels are 1.33 × 10¹⁹ to 4.75 × 10¹⁹ per cm3 in the a direction and 1.33 × 10¹⁹ to 4.72 × 10¹⁹ per cm3 in the c direction. The optimum levels at 500 K in the a direction are 3.04 × 10¹⁹ to 1.07 × 10²⁰ per cm3 and in the c direction 2.94 × 10¹⁹ to 1.02 × 10²⁰ per cm3. At 800 K in the a direction 6.44 × 10¹⁹ to 2.26 × 10²⁰ per cm3 and in the c direction 5.93 × 10¹⁹ to 2.04 × 10²⁰ per cm3 are the optimum doping levels.
We find that more metallicity is induced with pressure and the value of thermopower decreases with pressure. A similar trend has been previously observed for other metal chalcogenides.24 Our results here show that bipolar conduction can be avoided by a higher amount of doping while maintaining high thermopower, which is in accordance with previous work.23
Fig. 7(a), (b) and (c) show that electrical conductivity increases as the carrier concentration increases at 0 GPa, 10 GPa, and 20 GPa, respectively. From Fig. 7(a), we can see that σ in the a direction (σa) is higher than σ in the c direction (σc) for all temperatures at the specified carrier concentrations. The anisotropy of σ has also been observed in experimental studies.61 Further, σa does not show any large variation with temperature, whereas σc shows a more obvious variation at different temperatures. At 0 GPa, σc possesses a higher value at lower temperatures for the same carrier concentration. From Fig. 7(b), we can see that the anisotropy in σ at 10 GPa is almost vanished. Both σa and σc have very close values in the entire carrier concentration range and at a particular temperature. The anisotropy ratio σa/σc is close to 1 for all temperatures and carrier concentrations at this pressure. From Fig. 7(c), we see that at 20 GPa reversal of anisotropy in σ is observed. At all temperatures σc has a larger value than that of σa. At 300 K and 500 K the values of σa and σc are nearly temperature-independent over the carrier concentration range studied. At lower carrier concentration, noticeably larger values of σ can be seen in both directions at 800 K as compared to at lower temperatures. The anisotropy in electrical conductivity is observed at all temperatures and over the entire carrier concentration range. The larger electrical conductivity at higher pressures in the c direction is due to the band dispersion in the Γ-A direction (Fig. 5).
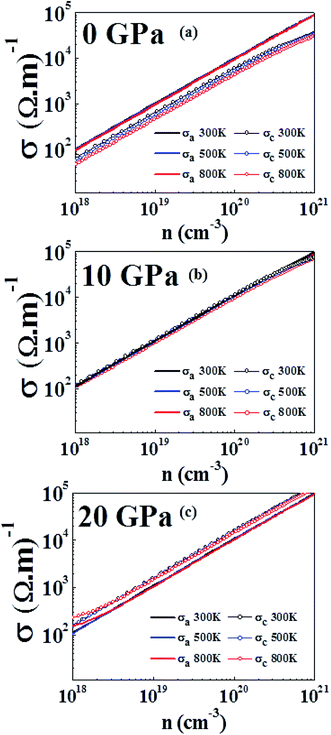 | ||
| Fig. 7 Electrical conductivity computed at 300 K, 500 K and 800 K at (a) 0 GPa, (b) 10 GPa and (c) 20 GPa. | ||
It has also been found experimentally that under pressure the conductivity has different anisotropic behavior in layered materials.71 An identical reversal in electrical conductivity has also been observed in WS2 (a similar layered compound) where the electrical conductivity exhibited a change in anisotropy by doping.72 In first principles study, under the effect of hydrostatic pressure a similar behavior has been reported for SnSe, where pressure significantly enhanced the electrical conductivity along the b direction compared to in the c direction, which has similar values in both directions at 0 GPa.34
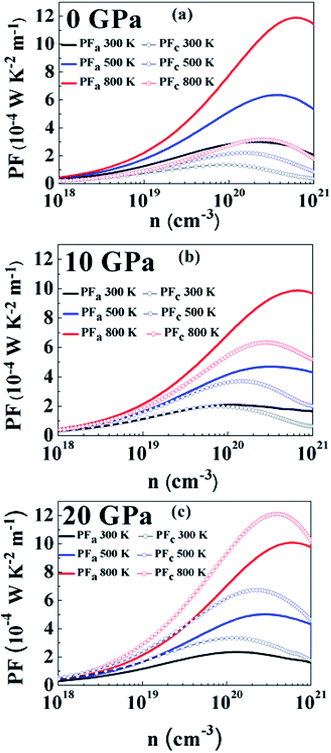
At a pressure of 10 GPa (Fig. 8(b)) we can see that PF follows a similar carrier concentration and temperature dependency with the largest value at 800 K. The maximum value of PFa has been observed to be 9.86 × 10⁻⁴ W K−2 m−1 at a carrier concentration of 6.69 × 1020 cm−3 and for PFc the maximum value is 6.33 × 10⁻⁴ W K−2 m−1 at a carrier concentration of 2.79 × 1020 cm−3. By comparing with 0 GPa, we can see that PFa is reducing but PFc is increasing for all temperatures. It is because of this reason that PF is more isotropic at this pressure. The anisotropy ratio, PFa/PFc is closer to 1 in this regime, especially at lower carrier concentrations and lower temperatures.
At 20 GPa (Fig. 8(c)) anisotropy in PF reverses as compared to anisotropy at lower pressures. Here PFc is greater than PFa at all temperatures. However, in this case anisotropy is almost temperature-independent over the entire carrier concentration range. At 800 K, PFa shows a maximum value of 10.07 × 10⁻⁴ W K−2 m−1 at a carrier concentration of 6.12 × 1020 cm−3 and the maximum value of PFc is calculated to be 12.10 × 10⁻⁴ W K−2 m−1 at a carrier concentration of 4 × 1020 cm−3. Even though the thermopower is nearly isotropic, the distinct anisotropy of electrical conductivity leads to anisotropy of the power factor.
Fig. 9(a) and (b) show the variation of PF with temperature and pressure in the a and c directions. We can see that PF exhibits a different variation in both directions. In Fig. 9(a) it can be seen that temperature causes PFa to increase but pressure steadily decreases the PF value in this direction. At 800 K, PFa exhibits a decrease of 15% at a pressure of 20 GPa as compared to 0 GPa. On looking at the variation of PF in the c direction (Fig. 9(b)) we can immediately observe the enhancement at higher temperatures and pressures. By comparing PFc at 800 K calculated at 0 GPa and 20 GPa we observe an enhancement by ∼3.8 times. Therefore, keeping the temperature constant and increasing the pressure causes PFc to be enhanced. Furthermore, the enhancement in PFc is more pronounced as compared to the reduction in PFa at higher pressures; therefore, the average PF is assumed to be increased.
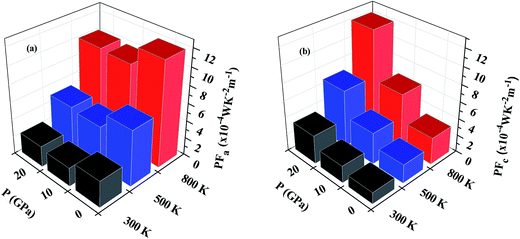 | ||
| Fig. 9 Variation of power factor with temperature and pressure in (a) the a direction and (b) the c direction. | ||
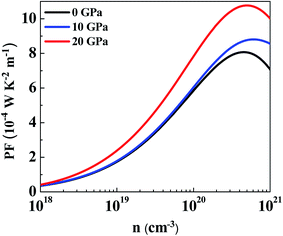
The average power factor is studied and a strong pressure dependency is observed at a given temperature. SnS2 has been seen to exhibit enhanced TE performance at high temperatures. Therefore, we analyzed PF change with carrier concentration at 800 K for different pressures, as shown in Fig. 10. The largest value of PF at all pressures was found at 20 GPa which is computed to be 10.77 × 10⁻⁴ W K−2 m−1 at a carrier concentration of 5 × 1020 cm−3. The maximum value at 0 GPa is 8.07 × 10⁻⁴ W K−2 m−1 at a carrier concentration of 4.46 × 1020 cm−3. Therefore, at 800 K, by increasing the pressure to 20 GPa the average power factor increases by 33%. It is observed that although the thermopower decreases with pressure, PF still increases because the electrical conductivity of the system is increasing.73 Even if anisotropy changes with pressure, an overall effect is an increase in the power factor of SnS2. Therefore, it could be utilized for more efficient TE applications.
In order to calculate the figure of merit (ZT), the relation  is used, where S, κl, σ, T and Lo are the thermopower, lattice thermal conductivity, electrical conductivity, temperature and Lorenz number
  , respectively. To proceed further, we require the lattice thermal conductivity (κl). In the present study it is assumed that κl does not vary with structure and doping level.67,69
The value of κl has been previously computed for SnS2.4,74 The value of κmin (minimum lattice thermal conductivity) calculated by Sun et al.4 in the a direction is 0.67 W m−1 K−1 at 300 K and it varies very modestly with temperature. In the c direction the value of κmin = 0.47 W m−1 K−1 has been calculated and it has been observed to exhibit temperature independence.
At 800 K we observe that ZT in the a direction (ZTa) has a maximum value of 0.76 at 0 GPa. Although this value is underestimated as compared to previous study,4 it is comparable to Bi2Te3 (∼0.8), which is a commercial TE material. By the application of hydrostatic pressure we see that ZTa value is decreased and at 20 GPa it gives a value of 0.66, which shows a reduction in ZTa by 13%. On the other hand, under hydrostatic pressure we can immediately observe an increase in ZT in the c direction (ZTc). At 0 GPa the maximum value of ZTc is 0.40, which is overestimated,4 but the same behaviour is followed, i.e. ZTc having a lesser value than ZTa. At 20 GPa the value of ZTc approaches 1. Thus, by increasing the hydrostatic pressure from 0 GPa to 20 GPa at 800 K, ZTc increases by ∼2.5 times. A comparison of the variation in ZTa and ZTc at 800 K and pressures of 0 GPa and 20 GPa is revealed in Fig. 11(a).
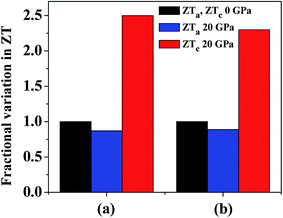 | ||
| Fig. 11 Variation of ZT at 20 GPa and 800 K in the a and c directions compared with normalized ZT values in both directions at 0 GPa. κl values are taken from (a) ref. 4 and (b) ref. 74. | ||
In a recent detailed study of the lattice thermal conductivity of SnS2 by Wang et al.74 the values of κl are quite different from those cited earlier. The κl value in the a direction (12.10 W m−1 K−1 at 300 K with strong temperature dependency) is much larger than c direction (0.78 W m−1 K−1 at 300 K with weaker temperature dependency). The value of κl in the a direction is also much greater than the values presented in previous work whereas the values in the c direction are in better agreement. By using the κl values at 800 K we get maximum ZTa equal to 0.18 and 0.16 at 0 GPa and 20 GPa, respectively. This is obvious due to the large difference in the κl values calculated in these studies. The reduction in ZTa at 800 K at 20 GPa pressure is equal to 11%. The maximum ZTc calculated by κl values in this study are 0.57 and 1.32 at 0 GPa and 20 GPa, respectively, which is an enhancement by ∼2.3 times. Fig. 11(b) presents a comparison of this variation in ZTa and ZTc at 800 K and pressures of 0 GPa and 20 GPa. The variation of ZT at 800 K with carrier concentration at all studied pressures is given in Fig. S1† by using the different values of κl. By looking at the results from the two studies, we can find a good agreement in the amount of variation in ZT in both directions. Hence, by investigating both the cases we can observe that by increasing pressure there is an overall enhancement in ZT as the rise in the c direction is much more prominent than the decline in the a direction.
Conclusions
In this study we investigated the effect of hydrostatic pressure on the thermoelectric properties of SnS2 at various temperatures. There are changes caused in the electronic structure, which are evident from band gap and band dispersion under pressure. It is because of the layered structure that SnS2 has anisotropy in transport properties, which appears to change under the application of pressure. The anisotropy in thermopower is reduced at higher pressures and an almost isotropic behaviour is observed at 20 GPa for all temperatures and carrier concentration. Electrical conductivity behaves in a different way; at 0 GPa it has a higher value in the a direction than the c direction. For all temperatures and carrier concentrations, the anisotropy is decreased with pressure and an almost isotropic trend is seen at 10 GPa. At 20 GPa it is observed that the electrical conductivity in the c direction is greater than that in the a direction, hence, an inversion in anisotropy is exhibited at 20 GPa and all studied temperatures. The power factor also follows the same sort of behaviour as electrical conductivity and exhibits inverse anisotropy at 20 GPa. The maximum value of power factor in the c direction at 800 K and 20 GPa increases by ∼3.8 times, which is calculated to be 12.10 × 10⁻⁴ W K−2 m−1. The figure of merit (ZT) was shown to be affected by hydrostatic pressure. In the a direction at 800 K, ZT shows a maximum value of 0.76 at 0 GPa and an 11–13% reduction at 20 GPa. In the c direction ZT calculated at 800 K shows large improvements at higher pressures. According to our calculations, at 20 GPa a value of ZT > 1 is obtained, which shows an enhancement by 2.3–2.5 times as compared to 0 GPa. Hence, hydrostatic pressure can be a useful tool to tune the TE properties of SnS2 for better performance.References
- G. S. Nolas, J. Sharp and J. Goldsmid, Thermoelectrics: basic principles and new materials developments, Springer Science & Business Media, 2013 Search PubMed.
- D. Yu, Y. Liu, L. Sun, P. Wu and W. Zhou, Phys. Chem. Chem. Phys., 2016, 18, 318–324 RSC.
- T. M. Tritt and M. Subramanian, MRS Bull., 2006, 31, 188–198 CrossRef.
- B.-Z. Sun, Z. Ma, C. He and K. Wu, Phys. Chem. Chem. Phys., 2015, 17, 29844–29853 RSC.
- X. Yan, B. Poudel, Y. Ma, W. Liu, G. Joshi, H. Wang, Y. Lan, D. Wang, G. Chen and Z. Ren, Nano Lett., 2010, 10, 3373–3378 CrossRef CAS PubMed.
- G. J. Snyder and E. S. Toberer, Nat. Mater., 2008, 7, 105–114 CrossRef CAS PubMed.
- M. Lee, L. Viciu, L. Li, Y. Wang, M. Foo, S. Watauchi, R. Pascal Jr, R. Cava and N. Ong, Nat. Mater., 2006, 5, 537–540 CrossRef CAS PubMed.
- L. Hicks and M. Dresselhaus, Phys. Rev. B: Condens. Matter Mater. Phys., 1993, 47, 12727 CrossRef CAS.
- L.-D. Zhao, S.-H. Lo, Y. Zhang, H. Sun, G. Tan, C. Uher, C. Wolverton, V. P. Dravid and M. G. Kanatzidis, Nature, 2014, 508, 373–377 CrossRef CAS PubMed.
- W. Xie, J. He, H. J. Kang, X. Tang, S. Zhu, M. Laver, S. Wang, J. R. Copley, C. M. Brown and Q. Zhang, Nano Lett., 2010, 10, 3283–3289 CrossRef CAS PubMed.
- J.-C. Zheng, Front. Phys. China, 2008, 3, 269–279 CrossRef.
- L. E. Bell, Science, 2008, 321, 1457–1461 CrossRef CAS PubMed.
- A. P. Nayak, S. Bhattacharyya, J. Zhu, J. Liu, X. Wu, T. Pandey, C. Jin, A. K. Singh, D. Akinwande and J.-F. Lin, Nat. Commun., 2014, 5, 3731 CAS.
- J. Zhang, S. Zhang, H. Weng, W. Zhang, L. Yang, Q. Liu, S. Feng, X. Wang, R. Yu and L. Cao, Proc. Natl. Acad. Sci. U. S. A., 2011, 108, 24–28 CrossRef CAS PubMed.
- W. Li, X.-Y. Wei, J.-X. Zhu, C. Ting and Y. Chen, Phys. Rev. B: Condens. Matter Mater. Phys., 2014, 89, 035101 CrossRef.
- C. J. Pickard and R. Needs, Phys. Rev. Lett., 2011, 107, 087201 CrossRef PubMed.
- Q. Li, Y. Li, T. Cui, Y. Wang, L. Zhang, Y. Xie, Y. Niu, Y. Ma and G. Zou, J. Phys.: Condens. Matter, 2007, 19, 425224 CrossRef.
- J. Blair and A. Smith, Phys. Rev. Lett., 1961, 7, 124 CrossRef.
- K. Zhuravlev, Phys. B, 2007, 394, 1–7 CrossRef CAS.
- S. V. Ovsyannikov and V. V. Shchennikov, Chem. Mater., 2009, 22, 635–647 CrossRef.
- S. V. Ovsyannikov and V. V. Shchennikov, Appl. Phys. Lett., 2007, 90, 122103 CrossRef.
- V. V. Shchennikov, N. V. Morozova, I. Tyagur, Y. Tyagur and S. V. Ovsyannikov, Appl. Phys. Lett., 2011, 99, 212104 CrossRef.
- D. Parker and D. J. Singh, Phys. Rev. B: Condens. Matter Mater. Phys., 2012, 85, 125209 CrossRef.
- T. Thonhauser, T. Scheidemantel, J. Sofo, J. Badding and G. Mahan, Phys. Rev. B: Condens. Matter Mater. Phys., 2003, 68, 085201 CrossRef.
- F. Chen, K. L. Stokes and R. Funahashi, Appl. Phys. Lett., 2002, 81, 2379–2381 CrossRef CAS.
- B. Xu, X. Li, G. Yu, J. Zhang, S. Ma, Y. Wang and L. Yi, J. Alloys Compd., 2013, 565, 22–28 CrossRef CAS.
- S. Li, X. Jia and H. Ma, Chem. Phys. Lett., 2012, 549, 22–26 CrossRef CAS.
- A. Agarwal, P. Trivedi and D. Lakshminarayana, Cryst. Res. Technol., 2005, 40, 789–790 CrossRef CAS.
- H. Guo, T. Yang, P. Tao, Y. Wang and Z. Zhang, J. Appl. Phys., 2013, 113, 013709 CrossRef.
- L. Xu, H.-Q. Wang and J.-C. Zheng, J. Electron. Mater., 2011, 40, 641–647 CrossRef CAS.
- S.-D. Guo and J.-L. Wang, J. Phys. D: Appl. Phys., 2016, 49, 215107 CrossRef.
- S.-D. Guo and J.-L. Wang, RSC Adv., 2016, 6, 31272–31276 RSC.
- D. Zou, Y. Liu, S. Xie, J. Lin, H. Zheng and J. Li, RSC Adv., 2014, 4, 54819–54825 RSC.
- Y. Zhang, S. Hao, L.-D. Zhao, C. Wolverton and Z. Zeng, J. Mater. Chem. A, 2016, 4, 12073–12079 CAS.
- P. Hohenberg and W. Kohn, Phys. Rev., 1964, 136, B864 CrossRef.
- W. Kohn and L. J. Sham, Phys. Rev., 1965, 140, A1133 CrossRef.
- K. Schwarz and P. Blaha, Comput. Mater. Sci., 2003, 28, 259–273 CrossRef CAS.
- E. Sjöstedt, L. Nordström and D. Singh, Solid State Commun., 2000, 114, 15–20 CrossRef.
- J. P. Perdew and Y. Wang, Phys. Rev. B: Condens. Matter Mater. Phys., 1992, 45, 13244 CrossRef.
- J. P. Perdew, K. Burke and M. Ernzerhof, Phys. Rev. Lett., 1996, 77, 3865 CrossRef CAS PubMed.
- Z. Wu and R. E. Cohen, Phys. Rev. B: Condens. Matter Mater. Phys., 2006, 73, 235116 CrossRef.
- J. P. Perdew, A. Ruzsinszky, G. I. Csonka, O. A. Vydrov, G. E. Scuseria, L. A. Constantin, X. Zhou and K. Burke, Phys. Rev. Lett., 2008, 100, 136406 CrossRef PubMed.
- P. E. Blöchl, O. Jepsen and O. K. Andersen, Phys. Rev. B: Condens. Matter Mater. Phys., 1994, 49, 16223 CrossRef.
- L. Marks, J. Chem. Theory Comput., 2013, 9, 2786–2800 CrossRef CAS PubMed.
- J. P. Perdew and A. Zunger, Phys. Rev. B: Condens. Matter Mater. Phys., 1981, 23, 5048 CrossRef CAS.
- L. Sham and M. Schlüter, Phys. Rev. Lett., 1983, 51, 1888 CrossRef.
- A. D. Becke and E. R. Johnson, J. Chem. Phys., 2006, 124, 221101 CrossRef PubMed.
- F. Tran and P. Blaha, Phys. Rev. Lett., 2009, 102, 226401 CrossRef PubMed.
- J. M. Ziman, Principles of the Theory of Solids, Cambridge University Press, 1972 Search PubMed.
- A. F. Ioffe, Semiconductor Thermoelements and Thermoelectric Cooling, London, 1957 Search PubMed.
- G. K. Madsen and D. J. Singh, Comput. Phys. Commun., 2006, 175, 67–71 CrossRef CAS.
- F. Zhang, Q. Lu, X. Zhang and J. Zhang, J. Phys. Chem. Solids, 2013, 74, 1859–1864 CrossRef CAS.
- A. Popescu, L. Woods, J. Martin and G. Nolas, Phys. Rev. B: Condens. Matter Mater. Phys., 2009, 79, 205302 CrossRef.
- C. Julien, M. Eddrief, I. Samaras and M. Balkanski, Mater. Sci. Eng., B, 1992, 15, 70–72 CrossRef.
- L. S. Price, I. P. Parkin, A. M. Hardy, R. J. Clark, T. G. Hibbert and K. C. Molloy, Chem. Mater., 1999, 11, 1792–1799 CrossRef CAS.
- L. Hromadová, R. Martoňák and E. Tosatti, Phys. Rev. B: Condens. Matter Mater. Phys., 2013, 87, 144105 CrossRef.
- R. Lynch and H. Drickamer, J. Chem. Phys., 1966, 44, 181–184 CrossRef CAS.
- M. Filsø, E. Eikeland, J. Zhang, S. Madsen and B. Iversen, Dalton Trans., 2016, 45, 3798–3805 RSC.
- K. Knorr, L. Ehm, M. Hytha, B. Winkler and W. Depmeier, Phys. Status Solidi B, 2001, 223, 435 CrossRef CAS.
- T. Shibata, N. Kambe, Y. Muranushi, T. Miura and T. Kishi, J. Phys. D: Appl. Phys., 1990, 23, 719 CrossRef CAS.
- S. Patil and R. Tredgold, J. Phys. D: Appl. Phys., 1971, 4, 718 CAS.
- C. Xia, Y. Peng, H. Zhang, T. Wang, S. Wei and Y. Jia, Phys. Chem. Chem. Phys., 2014, 16, 19674–19680 RSC.
- D. J. Singh and I. Mazin, Phys. Rev. B: Condens. Matter Mater. Phys., 1997, 56, R1650 CrossRef CAS.
- M. Oh, D. Wee, S. Park, B. Kim and H. Lee, Phys. Rev. B: Condens. Matter Mater. Phys., 2008, 77, 165119 CrossRef.
- J. P. Heremans, B. Wiendlocha and A. M. Chamoire, Energy Environ. Sci., 2012, 5, 5510–5530 CAS.
- D. Parker and D. J. Singh, Sci. Technol. Adv. Mater., 2013, 14, 055003 CrossRef PubMed.
- D. Parker and D. J. Singh, Phys. Rev. B: Condens. Matter Mater. Phys., 2010, 82, 035204 CrossRef.
- D. Parker, D. J. Singh, Q. Zhang and Z. Ren, J. Appl. Phys., 2012, 111, 123701 CrossRef.
- L. Xu, Y. Zheng and J.-C. Zheng, Phys. Rev. B: Condens. Matter Mater. Phys., 2010, 82, 195102 CrossRef.
- Y. Wang, X. Chen, T. Cui, Y. Niu, Y. Wang, M. Wang, Y. Ma and G. Zou, Phys. Rev. B: Condens. Matter Mater. Phys., 2007, 76, 155127 CrossRef.
- V. Sánchez, E. Benavente, V. Lavayen, C. O'Dwyer, C. S. Torres, G. González and M. A. Santa Ana, Appl. Surf. Sci., 2006, 252, 7941–7947 CrossRef.
- Z. Huang, T. Wu, S. Kong, Q.-L. Meng, W. Zhuang, P. Jiang and X. Bao, J. Mater. Chem. A, 2016, 4, 10159–10165 CAS.
- W. Ibarra-Hernández, M. J. Verstraete and J.-Y. Raty, Phys. Rev. B: Condens. Matter Mater. Phys., 2014, 90, 245204 CrossRef.
- H. Wang, Y. Gao and G. Liu, RSC Adv., 2017, 7, 8098–8105 RSC.
Footnote |
| † Electronic supplementary information (ESI) available. See DOI: 10.1039/c7ra06455a |
| This journal is © The Royal Society of Chemistry 2017 |

![[3 with combining macron]](https://www.rsc.org/images/entities/char_0033_0304.gif)
