 Open Access Article
Creative Commons Attribution 3.0 Unported Licence
Comparison between single loading–unloading indentation and continuous stiffness indentation
Yun-Fei Jiaa,
Yuan-Yuan Cuia,
Fu-Zhen Xuan*a and
Fuqian Yang *b
*b
aKey Laboratory of Pressure System and Safety, MOE, School of Mechanical and Power Engineering, East China University of Science and Technology, Shanghai 200237, People's Republic of China. E-mail: fzxuan@ecust.edu.cn
bMaterials Program, Department of Chemical and Materials Engineering, University of Kentucky, Lexington, KY 40506, USA. E-mail: fyang2@uky.edu
First published on 17th July 2017
Abstract
Experiments are performed on fused silica, Si, and duplex stainless steel to examine whether the CSM (continuous stiffness indentation) method will provide approximately the “same” results of contact modulus and indentation hardness as those measured from the quasi-static single loading–unloading indentation. The experimental results show that the elastic modulus measured by the CSM method is compatible with that by the quasi-static loading–unloading method for hard materials, while there exists a percentage difference of ∼21.3% between the smallest value and the largest vale of the measured indentation hardnesses from the CSM method for fused silica and a percentage difference of ∼15.3% between the hardnesses measured by the CSM method and the single indentation for duplex stainless steel. The large percentage difference suggests that the indentation hardness measured by the CSM method may not be compatible with that measured by the quasi-static loading–unloading method for hard materials. The finite element results reveal the percentage difference between the indentation hardness at the wave peak and that at the wave valley for the CSM method increases with the increase of the ratio of elastic modulus to yield stress.
1. Introduction
The indentation technique provides a method to probe localized mechanical behavior of materials. At the heart of the indentation technique is the relationship between indentation load and indentation size/depth, which is used to calculate the contact modulus of materials from the theory of contact mechanics, such as the Hertzian contact model.1 In general, there are two types of indentation processes, from which the contact modulus and indentation hardness of materials are calculated. The first one is based on single loading–unloading indentation,2 and the other is based on the superposition of small cyclic loading–unloading on the primary loading,3,4 which has been referred to as continuous stiffness measurement (CSM) method5–7 or dynamic stiffness measurement (DSM) method. In needs to emphasize that the CSM method measures the dynamic contact stiffness as a function of the indentation depth8 in contrast to the quasi-static contact stiffness measured by single loading–unloading indentation method. It needs to point out that Komvopoulos and his co-workers9–11 had used finite element method to analyze the indentation of elastoplastic materials by a rigid, spherical indenter. They revealed the increase of the indentation hardness with the indentation depth to the indentation depth corresponding to so-called fully plastic state, which is associated with the variation of the deformation zone underneath the indentation from elastic to fully plastic state. Such behavior has been observed for the nanoindentation of metallic materials with shallow indentation depth. It is interesting to note that their results show the decrease of the contact stress with further indentation after the deformation state reaches the fully plastic state.The most important feature of the CSM method is the continuous evaluation of the contact modulus and indentation hardness during loading.3 Using the result of Durst et al.12 from the CSM method, Pharr et al.3 revealed the significant difference of the indentation hardnesses between those measured from the CSM method and those from the single loading–unloading indentation method for small indentation loads, and similar indentation hardnesses for the indentation depth larger than or equal to 600 nm. Pharr et al.3 examined the effect of small displacement oscillation used in the CSM method on the indentation hardness and contact modulus of a (100) copper single crystal, and observed that the larger the displacement oscillation, the smaller is the indentation load needed for the same average indentation depth. They suggested that there are potential sources of error in the use of the CSM method; (1) the measured indentation load and displacement due to the small displacement oscillation may not be the peak indentation load and depth, (2) the calculated stiffness is underestimated, and (3) the load increment during dynamic unloading may be larger than the resultant applied load. Recently, Guillonneau et al.4 extended the CSM method and the second harmonic method to the measurement of the mechanical properties of thin poly(methylmethacrylate) (PMMA) layers on silicon wafers, and observed the substrate effect on the measurement. All of these have raised a question whether the contact modulus and indentation hardness measured from the CSM method are compatible with those from the single loading–unloading indentation method. It is worth mentioning that Yang et al.13 performed cyclic indentation of Al, using flat-ended indenter, and observed that the penetration rate increases with the increase of the amplitude of the cyclic load for the same mean indentation load. They also observed the energy dissipation for the each cyclic loading–unloading cycle, which increases with the increase of the amplitude of the cyclic load. They did not analyze the variations of contact modulus and indentation hardness.
Considering the use of nanoindentation techniques in characterizing the mechanical behavior of materials on various scales, we investigate the indentation behavior of three different materials of fused silica, single crystal silicon and duplex stainless steel by the single loading–unloading indentation method and the CSM method. The study is focused on whether both techniques will provide approximately “same” results of contact modulus and indentation hardness.
2. Experimental details
Three different materials of fused silica, single crystal (111) silicon and duplex stainless steel were used. Fused silica is a “standard” material for nanoindentation test, which is usually used for the calibration of the area function of an indenter. Single crystal (111) silicon is selected in this study due to the characteristic of brittleness. Stainless steel is used on account of the elasto-plastic behavior during nanoindentation. The fused silica of ∼10 × 10 × 10 mm3 was from the Agilent Technologies Inc. (Santa Clara, USA). The thickness of silicon is ∼500 μm. Wire-electrode cutting was used to obtain the duplex stainless steel plate of ∼10 mm in thickness. The duplex stainless steel plate was ground first by abrasive papers with the grit from 400 to 1200, and then polished by a diamond paste of 1.0 μm in size to obtain mirror-like surface. The polished duplex stainless steel plate was cleaned ultrasonically for 10 min in a water bath to remove surface residuals.Nanoindentation tests were performed on a nanoindenter (Agilent Nano Indenter G200, Agilent Technologies Inc., Santa Clara), using a Berkovich indenter with the tip radius less than 40 nm.14 Two indentation methods were used; one is the quasi-static single loading–unloading indentation, and the other is the CSM method. The depth-control indentation was used in the CSM method with the maximum indentation depth being 800 nm. The cyclic displacement superposed on the primary loading was 2 nm. The study was focused on the effects of the strain rate (![[small epsi, Greek, dot above]](https://www.rsc.org/images/entities/i_char_e0a1.gif) ) of the primary loading and the frequency (f) of the cyclic displacement on the contact modulus and the indentation hardness. The strain rate of the primary loading was in the range of from 0.005 to 0.2 s−1, and the frequency of the cyclic displacement was in the range of 10 to 75 Hz.
) of the primary loading and the frequency (f) of the cyclic displacement on the contact modulus and the indentation hardness. The strain rate of the primary loading was in the range of from 0.005 to 0.2 s−1, and the frequency of the cyclic displacement was in the range of 10 to 75 Hz.
The load-control indentation was used for the quasi-static single loading–unloading indentation. The maximum indentation loads for each individual material were determined for the results of the CSM indentation at the indentation depth of 800 nm. The strain rates for the quasi-static single loading–unloading indentation were the same as those used in the CSM indentation for the same materials in order to compare the measured contact modulus and indentation hardness. The corresponding loading times were 200, 100, 20, 10 and 5 s, corresponding to the strain rates of 0.005, 0.01, 0.05, 0.1 and 0.2 s−1 for the primary loading in the CSM indentation, respectively. For all the indentations, the holding time at the peak load was 15 s. From the unloading curves, the contact modulus of the indented material was calculated. The results reported in the work are the average values of more than ten indentations.
3. Results and discussion
3.1 Quasi-static single loading–unloading indentation
Fig. 1 shows the indentation loading–unloading curves for the indentations of fused silica, Si, and duplex stainless steel with three different strain rates. The maximum indentation depths for all the indentations are around 800 nm, corresponding to different maximum indentation loads for different materials, as expected. For approximately the same indentation depth of 800 nm, the indentation load for the indentation of Si is the largest, and the indentation load for the indentation of duplex stainless steel is the least. This trend suggests that the three materials possess different mechanical properties. For each individual material, there is no significant difference between the loading–unloading curves for the strain rate in the range of 0.005–0.2 s−1, suggesting that the strain rate has no significant effect on the loading–unloading behavior of the materials for the quasi-static indentations. For the indentations of Si, there exists the pop-in behavior during the unloading phase. Such behavior is associated with the indentation-induced phase transition of Si, as reported in the literatures;15–17 the indentation leads to the phase transition of Si from crystalline state to amorphous state. Ge et al.15 reported that dislocation-induced lattice rotation leads to a phase transition and distortion-induced amorphization of Si in nanoindentation.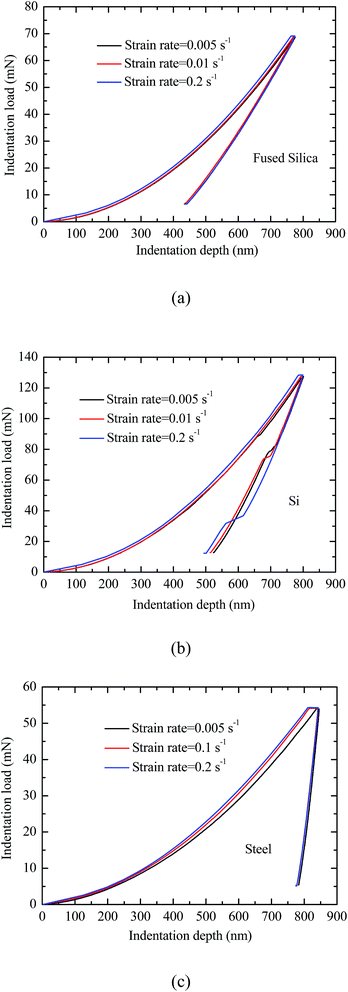 | ||
| Fig. 1 Loading–unloading curves of the single quasi-static loading–unloading indentation for different strain rates; (a) fused silica, (b) Si, and (c) duplex stainless steel. | ||
From Fig. 1 and Poisson's ratios of 0.18, 0.18 and 0.25 for fused silica, Si, and duplex stainless steel, respectively, both the elastic modulus and the indentation hardness were calculated. Fig. 2 shows the variations of the elastic modulus and the indentation hardness with the strain rate for all the three materials. There are no significant variations of the elastic modulus and the indentation hardness with the indentation strain rate for all the three materials, suggesting that both the contact modulus and the indentation hardness are relatively independent of strain rate for the strain rate in the range of 0.005 to 0.2 s−1. Note that both the elastic modulus and the indentation hardness have the smallest values for the indentation with the strain rate 0.2 s−1 except the indentation hardness of Si. Using the data in Fig. 2, one obtains the elastic modulus and the indentation hardness of (73.09 ± 0.24, 9.23 ± 0.11), (185.24 ± 2.95, 12.10 ± 0.19), and (232.16 ± 5.87, 3.33 ± 0.04) in the unit of GPa for the materials of fused silica, Si and duplex stainless steel, respectively.
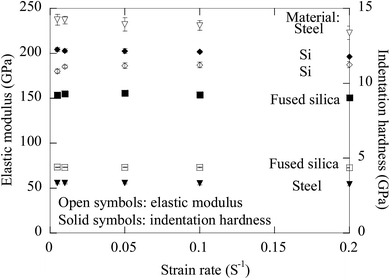 | ||
| Fig. 2 Variations of elastic modulus and indentation hardness with indentation strain rate for three different materials. | ||
3.2 CSM indentation
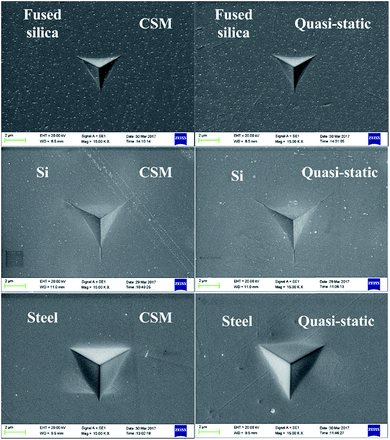
SEM (scanning electron miscopy) imagining was used to observe the surface indents in order to determine if there exists any observable difference of the surface indents produced by the CSM method and the single quasi-static loading–unloading indentation. Fig. 3 shows typical SEM images of the indents at the same indentation depth of ∼800 nm on the three materials, which were produced by the two methods. According to Fig. 3a and b, there is no obaservable surface crack or pile-up for the indentation of fused silica. For Si (see Fig. 3c and d), cracks formed at three corners for both methods, which is due to the stress concentration. For duplex stainless steel (see Fig. 3e and f), there is small pile-up around the indents for both methods. In general, there is no significant difference between the corresponding SEM images for all three materials.In the study, the rigid Berkovich indenter with a tip radius of about 40 nm was used. The material of steel was used for the comparison with the analytical models proposed by Etsion and co-workers.19–21 Using the material parameters of yield strength, Y = 1.1 GPa, Young's modulus, E = 231 GPa, and Poisson's ratio, ν = 0.25, the critical interference of ωc and critical load Pc of the sphere are found to be 31 nm and 22 mN, respectively. Using the surface roughness of the steel, the roughness parameters are found to be ρ = 10 μm and σ = 61 nm. The dimensionless critical interference is  , and the dimensionless transition load is
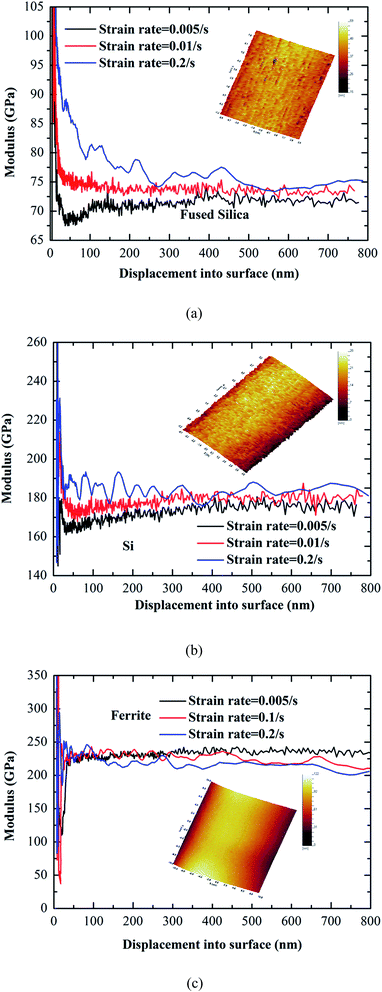
  . Thus, the transition load is Pt = 65 mN, which is larger than the indentation load of 10 mN for the nanoindentation with a spherical tip. Thus, the asperities play an important role in determining the total displacement for shallow indentation according to Etison's model, i.e. the surface roughness has a significant effect on the indentation deformation for shallow indentation. Thus, the analysis is only focused on the elastic modulus and indentation hardness for deep indentation. With the indentation depth of the primary loading larger than 150 nm, the elastic moduli for all the three materials reach individual constants, which can be referred to as the elastic moduli of the corresponding materials. Note that there are still small oscillations for the elastic moduli even with large indentation depth.
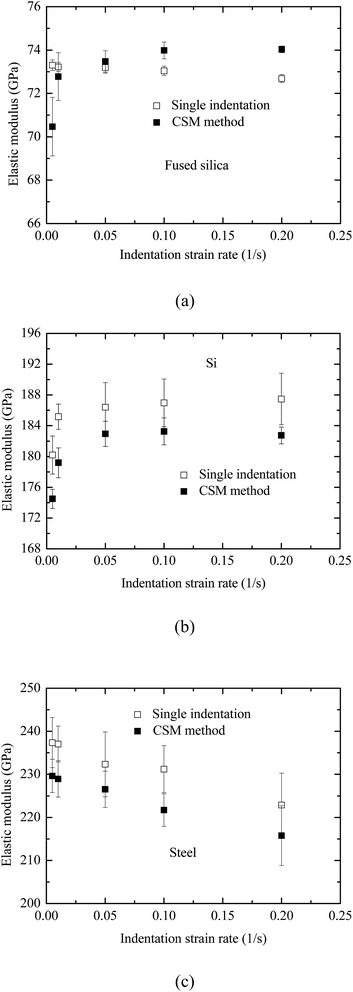
Using the “constant” value of the elastic modulus shown in Fig. 4, one can determine the effect of the indentation strain rate on the measurement of elastic modulus. Fig. 5 shows the variation of the elastic modulus with the indentation strain rate for the three materials. For comparison, the elastic moduli measured by the quasi-static single loading–unloading indentation are also included in Fig. 5. For fused silica, the elastic modulus measured by the CSM method first increases slightly with increasing the indentation strain rate and approximately approaches constant for the indentation strain rate larger than or equal to 0.05 s−1. The percentage difference between the smallest value and the largest value of the measured elastic moduli is ∼5%. For the indentation strain rate less than or equal to 0.01 s−1, the elastic modulus measured by the CSM method is smaller than that measured by the quasi-static loading–unloading indentation. On the other side, the elastic modulus measured by the CSM method is larger than that measured by the quasi-static loading–unloading indentation for the indentation strain rate larger than or equal to 0.05 s−1. For Si and duplex stainless steel, the elastic modulus measured by the quasi-static loading–unloading indentation is always larger than that measured by the CSM method for the same indentation strain rate. The maximum percentage difference between the elastic modulus measured by the quasi-static loading–unloading indentation and that measured by the CSM method is less than 3%. This trend suggests that the elastic modulus measured by the CSM method is compatible with that by the quasi-static loading–unloading method for hard materials.
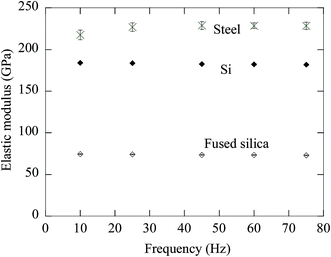
Fig. 6 shows the variation of the elastic modulus measured by the CSM method with frequency for the three different materials with the indentation depth and the indentation strain rate of the primary loading being 800 nm and 0.05 s−1, respectively. In general, the frequency of the small oscillation in the frequency range of 10 to 70 Hz has relatively little effect on the measurement of the elastic modulus by the CSM method for all the three materials. This result suggests that there is little frequency dependence of the elastic modulus measured by the CSM method.
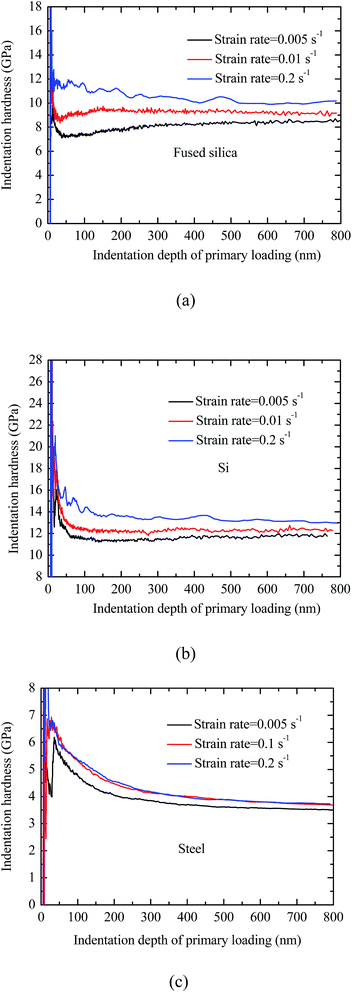
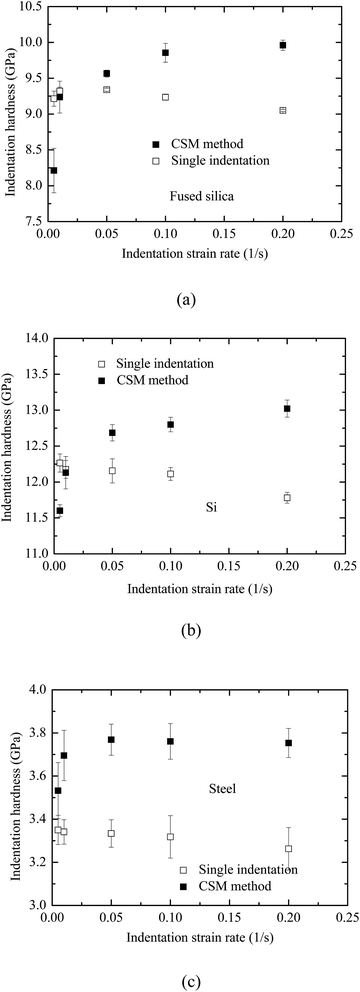
To obtain the “material” hardness, which is depth-independent, the plateau value of the indentation hardness shown in Fig. 7 is used in the analysis. Fig. 8 shows the effect of the indentation strain rate of the primary loading on the indentation hardness. For comparison, the indentation hardnesses measured by the quasi-static single loading–unloading indentation are also included in Fig. 8. It is evident that there exists the dependence of the indentation hardness on the strain rate. Note that all the indentation hardnesses reported in Fig. 8 are the corresponding plateau values of individual indentations, which are independent of the indentation depth. For all the three materials, the indentation hardness measured by the CSM method increases with increasing the indentation strain rate, while the indentation hardness measured by the single loading–unloading indentation decreases with increasing the indentation strain rate. For the single loading–unloading indentation, the constant strain rate, ḣ/h, is used. For the same strain rate, the indentation speed of ḣ increases with increasing the indentation depth, leading to the increase of the acceleration of the indenter. According to Newton's second law, the “true” indentation load applied to the indenter increases with increasing the strain rate, which results in the decrease of the “nominal” indentation hardness. For the CSM method, the mechanism is unclear. The increase trend of the indentation hardness with the strain rate might be due to the dynamic effect associated with local hardening and elastic recovery, which increases the resistance to the penetration of the indenter at deep indentation.
For fused silica, the percentage difference between the smallest value and the largest value of the measured indentation hardnesses from the CSM method is ∼21.3%, showing strong strain-rate effect; the largest percentage difference between the hardness measured by the CSM method and the single indentation is ∼12.2%. It has been reported that there is indentation-induced densification in fused silica.22,23 For the indentation with the CSM method, the densification during the primary loading increases the elastic modulus and the resistance to the penetration of the indenter, which oscillates at a small amplitude. Deschamps et al.24 revealed more than 50% increase in elastic modulus of densified fused silica for a compressive stress of 26.2 GPa. Such a large increase in the elastic modulus can lead to a significant decrease in the contact area and an increase in the indentation hardness. Also, the higher the strain rate, the larger is the elastic deformation due to the dynamic effect. This trend along with indentation-induced densification from primary indentation reduces the contact area and results in the increase in the indentation hardness. The indentation hardness as measured from the CSM thus increases with the increase of the strain rate. It needs to point out that there may exist other mechanisms associated with the change of the indentation hardness of fused silica, such as phase transformation, which requires more detailed study. For Si, the percentage difference between the smallest value and the largest value of the measured indentation hardnesses from the CSM method is ∼12.2%, and the largest percentage difference between the hardness measured by the CSM method and the single indentation is ∼10.5%. For duplex stainless steel, the percentage difference between the smallest value and the largest value of the measured indentation hardnesses from the CSM method is ∼6.5%, and the largest percentage difference between the hardness measured by the CSM method and the single indentation is ∼15.3%. Such large percentage differences suggest that the indentation hardness measured by the CSM method may not be compatible with that by the quasi-static loading–unloading indentation for hard materials. One needs to be cautious when using the CSM to measure the indentation hardness of materials.
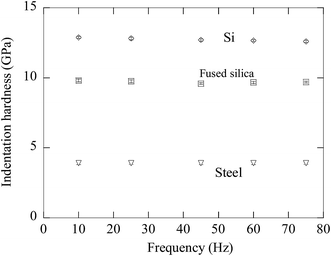
Fig. 9 depicts the variation of the indentation hardness measured by the CSM method with frequency for the three different materials with the indentation depth and the indentation strain rate of the primary loading being 800 nm and 0.05 s−1, respectively. In general, the frequency of the small oscillation in the frequency range of 10 to 70 Hz has relatively little effect on the measurement of the indentation hardness by the CSM method for all the three materials. This result suggests that there is little frequency dependence of the indentation hardness measured by the CSM method.
4. Finite element analysis
As discussed above, there are large percentage differences between the indentation hardnesses measured by the CSM method and those measured by single quasi-static loading–unloading indentation. It looks like that the difference likely is dependent on the use of the contact area in the calculation of the indentation hardness determined from the CSM during the small oscillation. In general, it is impossible to obtain an analytical relation between the indentation depth and the contact area for an elastoplastic indentation with the superposition of a small oscillation. Here, finite element method (FEM) was used to examine the effect of the small oscillation on the contact area used in the CSM method.The commercial FEA ABAQUS package was used in the FEM analysis.25 An axisymmetric model was used in the analysis. The material is elastic-perfectly plastic, and Poisson's ratio is 0.25.
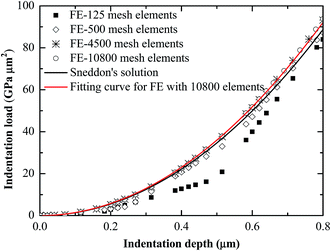
Finite element analyses with 125, 500, 4500, 10![[thin space (1/6-em)]](https://www.rsc.org/images/entities/char_2009.gif) 800 elements were performed for the convergence analysis. The numerical results show that the FE results with 4500 elements are basically the same as those with 10
800 elements were performed for the convergence analysis. The numerical results show that the FE results with 4500 elements are basically the same as those with 10![[thin space (1/6-em)]](https://www.rsc.org/images/entities/char_2009.gif) 800 elements. Thus, a FEA model, as shown in Fig. 10, consisting of 10
800 elements. Thus, a FEA model, as shown in Fig. 10, consisting of 10![[thin space (1/6-em)]](https://www.rsc.org/images/entities/char_2009.gif) 800 elements of 4-node bilinear-axisymmetric-quadrilateral element was used. The refinement of meshes was performed near the contact area. The contact condition between the indenter and the substrate is frictionless. The nodes at the axisymmetric axis are constrained in the radial direction, and the nodes on the bottom surface are constrained in all directions.26–28
800 elements of 4-node bilinear-axisymmetric-quadrilateral element was used. The refinement of meshes was performed near the contact area. The contact condition between the indenter and the substrate is frictionless. The nodes at the axisymmetric axis are constrained in the radial direction, and the nodes on the bottom surface are constrained in all directions.26–28
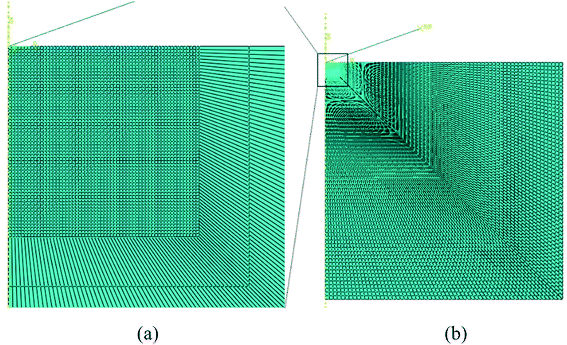 | ||
| Fig. 10 Finite element model used for the indentation simulation; (a) fine mesh around the indentation, and (b) overview of the FEM model. | ||
For an elastic indentation by a rigid, conical indenter, Sneddon29 gave the relationship between indentation load, F, and indentation depth, δ, as
 | (1) |
For the Berkovich indenter, the value of θ is 19.68°. The elastic constants of E = 73 GPa and ν = 0.25 were used in the simulation. Fig. 4 shows the comparison between the FEM results and the analytical results. The FEM results show that the indentation load is a power function of the indentation displacement with a power of 2, in accord with eqn (1). For the given elastic constants, the ratio of F/δ2 is 138.6 GPa. Using the best curve-fitting to fit the FE results, one finds the ratio of 143.98 GPa. There is only 3.88% (Fig. 11), which suggests the finite element mesh is good enough for the analysis in the work.
During the indentation simulation, a rigid, conical indenter with a half angle of 70.32°, equivalent to the Berkovich indenter, was pushed onto the center of the axisymmetric model with the displacement control. To simulate the small oscillation superposed on the primary loading used in the CSM method, local, quasi-static fluctuations in triangular shape with 10 nm in the amplitude at the indentation depth of 400, 500, 600, and 700 nm were introduced during the simulation. The contact radii and indentation loads at the peak and valley, as shown in Fig. 12, were recorded and used to calculate the corresponding indentation hardness.
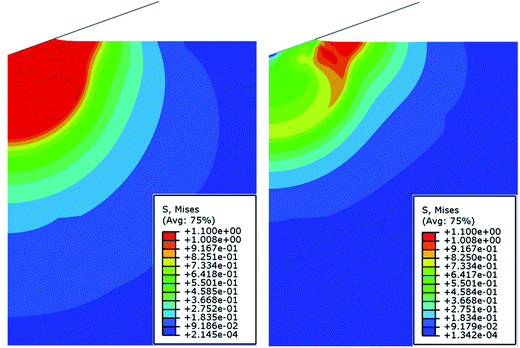
Fig. 13 shows the contours of von-Mises stress at the wave peak and wave valley for the local fluctuation at the indentation depth of 400 nm of the primary loading for the indentation on an elastic-perfectly plastic material of E = 232 GPa and σy = 1.1 GPa. It is evident that there exists significant difference of the deformation states between these two indentations even though the amplitude of the fluctuation is much smaller than the indentation depth of the primary indentation. For the indentation at the wave peak, large plastic zone of approximate hemi-sphere is present underneath the indenter. There is a large resistance to the penetration of the indenter onto the material. For the indentation at the wave valley, the plastic zone is present near the contact edge between the indenter and the material. The deformation state for the material directly underneath the indenter is elastoplastic. Such a big difference between the deformation states indicates that there likely exists some difference in the contact area, which is associated with the calculation of the indentation hardness.
Fig. 14 shows the variation of the indentation hardness calculated from the local fluctuations with the indentation depth of the primary indentation for different combination of (E, σy). Generally, the indentation hardness calculated at the wave peak slightly decreases with the increase of the indentation depth of the primary indentation, while the indentation hardness calculated at the wave valley slightly increases with the increase of the indentation depth of the primary indentation. There is an exception for the indentation of the material with the E/σy being 73![[thin space (1/6-em)]](https://www.rsc.org/images/entities/char_2009.gif) :
:![[thin space (1/6-em)]](https://www.rsc.org/images/entities/char_2009.gif) 3.1. Such a trend reveals the effect of the material properties on the measurement of the indentation hardness from the CSM method. From Fig. 14, it is evident that the percentage difference between the indentation hardness at the wave peak and that at the wave valley increases with the increase of the ratio of E/σy. The least percentage difference of 13.1% between the indentation hardness at the wave peak and that at the wave valley is for indentation of the material with the E/σy being 73
3.1. Such a trend reveals the effect of the material properties on the measurement of the indentation hardness from the CSM method. From Fig. 14, it is evident that the percentage difference between the indentation hardness at the wave peak and that at the wave valley increases with the increase of the ratio of E/σy. The least percentage difference of 13.1% between the indentation hardness at the wave peak and that at the wave valley is for indentation of the material with the E/σy being 73![[thin space (1/6-em)]](https://www.rsc.org/images/entities/char_2009.gif) :
:![[thin space (1/6-em)]](https://www.rsc.org/images/entities/char_2009.gif) 3.1, and the largest percentage difference of 59.6% is for indentation of the material with the E/σy being 232
3.1, and the largest percentage difference of 59.6% is for indentation of the material with the E/σy being 232![[thin space (1/6-em)]](https://www.rsc.org/images/entities/char_2009.gif) :
:![[thin space (1/6-em)]](https://www.rsc.org/images/entities/char_2009.gif) 1.1. Such a big percentage difference suggests that large errors can be introduced for the measurement of the indentation hardness by the CSM method, which is qualitatively in accord with the experimental results shown in Fig. 8. One needs to be cautious in using the CSM method to measure the indentation hardness of materials.
1.1. Such a big percentage difference suggests that large errors can be introduced for the measurement of the indentation hardness by the CSM method, which is qualitatively in accord with the experimental results shown in Fig. 8. One needs to be cautious in using the CSM method to measure the indentation hardness of materials.
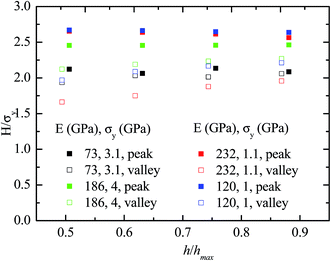 | ||
| Fig. 14 Variation of the indentation hardness calculated from the local fluctuations with the indentation depth of the primary indentation for different combination of (E, σy). | ||
5. Summary
In summary, the CSM method has been used to measure the elastic moduli and the indentation hardnesses of three different materials of fused silica, Si, and duplex stainless steel in order to examine whether the CSM method will provide approximately the “same” results of the contact modulus and the indentation hardness as those measured from the quasi-static single loading–unloading indentation. The following is the summary of the results.(1) There is no significant difference of the SEM images between the indents produced by the CSM method and those by the quasi-static single loading–unloading indentation at the same indentation depth of the primary indentation. The small oscillation superposed on the primary indentation has negligible effects on the surface characteristics of the indents.
(2) With large indentation depth of the primary indentation, the elastic modulus measured by the CSM method reaches plateau, which can be referred to as the elastic modulus of the material. The elastic modulus measured by the CSM method is compatible with that by the quasi-static loading–unloading indentation for hard materials.
(3) With large indentation depth of the primary indentation, the indentation hardness measured by the CSM method reaches plateau, which can be referred to as the indentation hardness of the material. For fused silica, the percentage difference between the smallest value and the largest value of the measured indentation hardnesses from the CSM method is ∼21.3%, showing the strain-rate dependence. The largest percentage difference between the hardness measured by the CSM method and the single indentation is ∼15.3% for duplex stainless steel. The large percentage difference suggests that the indentation hardness measured by the CSM method may not be compatible with that by the quasi-static loading–unloading method for hard materials.
(4) The numerical results find the effect of the material properties on the measurement of the indentation hardness from the CSM method. The percentage difference between the indentation hardness at the wave peak and that at the wave valley increases with the increase of the ratio of E/σy.
Acknowledgements
This work was sponsored by National Natural Science Foundations of China (51605164), Shanghai Sailing Program (16YF1402300), Shanghai Chenguang Program (16CG34), and the Fundamental Research Funds for the Central Universities (222201718005).References
- H. Hertz, On the contact of elastic solids, J. Reine Angew. Math., 1881, 92(156–171), 110 Search PubMed.
- W. C. Oliver and G. M. Pharr, An improved technique for determining hardness and elastic modulus using load and displacement sensing indentation experiments, J. Mater. Res., 1992, 7(6), 1564–1583 CrossRef CAS.
- G. M. Pharr, J. H. Strader and W. Oliver, Critical issues in making small-depth mechanical property measurements by nanoindentation with continuous stiffness measurement, J. Mater. Res., 2009, 24(3), 653–666 CrossRef CAS.
- G. Guillonneau, G. Kermouche, J. Teisseire, E. Barthel, S. Bec and J.-L. Loubet, Is the second harmonic method applicable for thin films mechanical properties characterization by nanoindentation?, Philos. Mag., 2015, 95(16–18), 1999–2011 CrossRef CAS.
- W. Oliver and G. Pharr, Measurement of hardness and elastic modulus by instrumented indentation: Advances in understanding and refinements to methodology, J. Mater. Res., 2004, 19(01), 3–20 CrossRef CAS.
- X. D. Li and B. Bhushan, A review of nanoindentation continuous stiffness measurement technique and its applications, Mater. Charact., 2002, 48(1), 11–36 CrossRef CAS.
- E. G. Herbert, K. E. Johanns, R. S. Singleton and G. M. Pharr, On the measurement of energy dissipation using nanoindentation and the continuous stiffness measurement technique, J. Mater. Res., 2013, 28(21), 3029–3042 CrossRef CAS.
- S. S. Asif, K. Wahl and R. Colton, Nanoindentation and contact stiffness measurement using force modulation with a capacitive load-displacement transducer, Rev. Sci. Instrum., 1999, 70(5), 2408–2413 CrossRef CAS.
- N. Ye and K. Komvopoulos, Indentation analysis of elastic-plastic homogeneous and layered media: Criteria for determining the real material hardness, J. Tribol., 2003, 125(4), 685–691 CrossRef.
- L. Kogut and K. Komvopoulos, Analysis of the spherical indentation cycle for elastic-perfectly plastic solids, J. Mater. Res., 2004, 19(12), 3641–3653 CrossRef CAS.
- Z. Song and K. Komvopoulos, Elastic-plastic spherical indentation: Deformation regimes, evolution of plasticity, and hardening effect, Mech. Mater., 2013, 61, 91–100 CrossRef.
- K. Durst, O. Franke, A. Böhner and M. Göken, Indentation size effect in Ni–Fe solid solutions, Acta Mater., 2007, 55(20), 6825–6833 CrossRef CAS.
- F. Yang, L. Peng and K. Okazaki, Cyclic indentation in aluminum, J. Mater. Sci., 2007, 42(12), 4513–4520 CrossRef CAS.
- Y. Jia, F.-Z. Xuan and F. Yang, Viscoplastic response of tooth enamel under cyclic microindentation, Mater. Sci. Eng., Proc. Conf., 2015, 55, 448–456 CrossRef CAS.
- D. B. Ge, V. Domnich and Y. Gogotsi, High-resolution transmission electron microscopy study of metastable silicon phases produced by nanoindentation, J. Appl. Phys., 2003, 93(5), 2418–2423 CrossRef CAS.
- J. Yan, H. Takahashi, X. Gai, H. Harada, J. i. Tamaki and T. Kuriyagawa, Load effects on the phase transformation of single-crystal silicon during nanoindentation tests, Mater. Sci. Eng., Proc. Conf., 2006, 423(1–2), 19–23 CrossRef.
- J. I. Jang, M. J. Lance, S. Q. Wen, T. Y. Tsui and G. M. Pharr, Indentation-induced phase transformations in silicon: influences of load, rate and indenter angle on the transformation behavior, Acta Mater., 2005, 53(6), 1759–1770 CrossRef CAS.
- L. Li, A. Ovcharenko, I. Etsion and F. Talke, The Effect of Asperity Flattening During Cyclic Normal Loading of a Rough Spherical Contact, Tribol. Lett., 2010, 40(3), 347–355 CrossRef.
- L. Li, I. Etsion and F. E. Talke, Elastic–Plastic Spherical Contact Modeling Including Roughness Effects, Tribol. Lett., 2010, 40(3), 357–363 CrossRef.
- L. Li, I. Etsion and F. E. Talke, Contact Area and Static Friction of Rough Surfaces With High Plasticity Index, J. Tribol., 2010, 132(3), 031401 CrossRef.
- Y. Kadin, Y. Kligerman and I. Etsion, Multiple loading–unloading of an elastic–plastic spherical contact, Int. J. Solids Struct., 2006, 43(22), 7119–7127 CrossRef.
- A. B. Shorey, K. Xin, K.-H. Chen and J. C. Lambropoulos, Deformation of fused silica: nanoindentation and densification, Proc. SPIE 3424, Inorganic Optical Materials, 1998, vol. 3424, pp. 72–81 Search PubMed.
- K. Xin and J. C. Lambropoulos, Densification of fused silica: effects on nanoindentation, Proc. SPIE 4102, Inorganic Optical Materials II, 2000, vol. 4102, pp. 112–121 Search PubMed.
- T. Deschamps, J. Margueritat, C. Martinet, A. Mermet and B. Champagnon, Elastic Moduli of Permanently Densified Silica Glasses, Sci. Rep., 2014, 4, 7193 CrossRef CAS PubMed.
- Y.-H. Chen, Y. Jia, F. Yang, C.-C. Huang and S. Lee, Boussinesq type solution for a viscoelastic thin film on an elastic substrate, Int. J. Mech. Sci., 2016, 117, 79–92 CrossRef.
- Y. Jia, F.-Z. Xuan, X. Chen and F. Yang, Finite element analysis of the cyclic indentation of bilayer enamel, J. Phys. D: Appl. Phys., 2014, 47(17), 175401 CrossRef.
- Y. Jia, F.-Z. Xuan and F. Yang, Finite element analysis of depth effect on measuring elastic modulus of a core–shell structure for application of instrumented indentation in tooth enamel, Mater. Sci. Eng., Proc. Conf., 2014, 37, 84–89 CrossRef CAS PubMed.
- Y. Jia, F.-Z. Xuan and F. Yang, Analysis of the effect of a compliant layer on indentation of an elastic material, J. Mech. Behav. Biomed. Mater., 2013, 25, 33–40 CrossRef CAS PubMed.
- I. N. Sneddon, The relation between load and penetration in the axisymmetric Boussinesq problem for a punch of arbitrary profile, Int. J. Eng. Sci., 1965, 3(1), 47–57 CrossRef.
| This journal is © The Royal Society of Chemistry 2017 |

