 Open Access Article
Characteristics of rumen microorganisms involved in anaerobic degradation of cellulose at various pH values
Lu Zhang a,
Jongshik Chung
 a,
Qingqing Jianga,
Rui Suna,
Jian Zhangb,
Yingjuan Zhongb and
Nanqi Ren*a
aState Key Laboratory of Urban Water Resource and Environment, School of Municipal and Environmental Engineering, Harbin Institute of Technology, Harbin 150090, China. E-mail: rnq@hit.edu.cn; Fax: +86 451 86282195; Tel: +86 451 86282195
bShenzhen Greenster Environmental Technology Co., Ltd., Shenzhen 518055, China
First published on 17th August 2017
Abstract
Microbial degradation of straw, the main by-product of agricultural production, has proved to be the most economical and effective means of producing hydrogen. Mixed cultures provide stable combinations to process complex materials, thereby supporting more efficient decomposition and hydrogenation of biomass than pure bacterial species. Cellulose, the main component of straw, is degraded by microorganisms found in the rumen fluid of cows and converted to hydrogen gas, ethanol, and other fuels. This study investigated hydrogen production and microbial community structures during cellulose degradation by rumen microorganisms at pH values in the range of 5.5–7.5. The highest degradation efficiency was 81% at pH 6.5 with no methane and with the maximum hydrogen yield of 178.16 mL L−1 (culture medium) (8.42 mmol H2 g−1 Avicel). The yield value is higher than that associated with most mesophilic bacteria subjected to serial inoculation. The microbial diversity of rumen liquid enrichments at different pH values was analyzed using 454 pyrosequencing techniques. The dominant bacteria changed from Bacteroides, Enterococcus, and Enterobacter to Oscillibacter. This study thus examined the effect of pH on the efficiency of cellulose utilization in rumen bacteria growth. The results provide information about the mechanisms of metabolization at different pH values in diverse microflora.
Biological hydrogen production is a sustainable energy technology that uses microbial metabolism to produce hydrogen.1–3 One way to lower the cost of hydrogen production is to use cheap and renewable feedstocks such as cellulose. As cellulose is one of the most widely found carbohydrates, its degradation to produce renewable energy is a popular research topic.4 However, because of its highly ordered crystalline structure, cellulose is difficult to degrade. Compared to chemical or physical means, the biological method of degradation is considered to be environmentally friendly and more cost-effective.5 Culture resources such as anaerobic sludge, rumen fluid, and other microorganisms are typically applied to degrade cellulose. Rumen microorganisms are superior cellulose degraders compared to other microbes because of their advantageous cellulolytic activity; they degrade cellulose and its wastes into volatile fatty acids (VFAs) and gases.6 Microbial communities and their functional strains are indispensable in degrading cellulose and maximizing hydrogen production. Degradation of cellulose by anaerobic cellulolytic bacteria requires the synergistic interaction of many enzymes such as endo-β-glucanohydrolase, glucosidase, and endo-xylanase. Since many strains cannot produce all the needed enzymes, it is difficult to degrade raw cellulose using a pure culture of microbes. On the other hand, there is a synergistic effect between floras that promote degradation, namely, the cellulose synergy between different cellulose-degrading bacteria, and between cellulose-degrading bacteria and other microorganisms.7 These synergistic interactions and the composition of bacterial communities are important in determining the level of ecosystem function.8 For example, the utilization of cellobiose and glucose can eliminate the feedback inhibition of cellulose-degrading bacteria.9 Biological conversion of cellulose to VFA and gases is best achieved using microflora rather than pure cultures because of the former's higher conversion rates and the utilization of wider carbon sources. The cooperation between the strains may overcome the frequently encountered repression problem in the cellulose hydrolysis process.10 The compound microflora MC1 isolated from the compost could degrade 0.48 g filter paper in a 100 mL static culture at 50 °C in 72 h.11 Using the method of limited cultures, the anaerobic bacteria FYG-2 was screened from rumen residue. The flora could degrade 1 g of filter paper completely within 5 d at 38.5 °C at pH levels of 6.4–6.8.12 These past studies showed that cultivating anaerobic cellulose composites has proven effective in cellulose degradation.
Enrichment culture is a kind of culture method which aims at increasing the proportion of the target bacteria and tending to pure culture. Enrichment culture is mainly to control physiological factors, such as carbon source, nitrogen source, pH, temperature, oxygen demand and so on. Based on the characteristics of enrichment culture effectiveness research community in the process, on the one hand, it can simulate the optimal growth and metabolic environment of target bacteria, increase the number of specific microorganisms, and improve the biological activity of functional bacteria and the ability to degrade the specified substrate as much as possible 1; on the other hand, through enrichment and cultivation of microbial flora, some gene recombination or exchange between microorganisms can be carried out, so as to better obtain the expanded culture medium of the target microorganism.13 Ren14 found enrichment of cow dung compost with cellulose was a method effectively to prevent methanogens and degrade cellulose and 272 mL g−1-cellulose at 10 g L−1 cellulose under 37 °C, initial pH 6.8.
The aspects of microbial metabolism, including the change in cell membrane charge, energy sources, substrate degradation efficiency, synthesis of proteins, various types of storage material, and release of metabolic products from cells,15 are considerably influenced by pH variations over the range in which the microorganisms can grow. All cellulolytic ruminal bacteria are sensitive to even modest declines in pH,16 and low ruminal pH can be a critical factor limiting cellulose digestion under commercial feeding situations. Since pH affects the growth rate of microorganisms, the changes in pH may cause drastic shifts in the relative number of species in a heterogeneous population. Fibrolytic ruminal bacteria are generally sensitive to low pH.17 Despite the significance of pH in fermentation, there is little information on the effect of pH on the fermentation of cellulose by rumen microorganisms.
This study investigated fermentative hydrogen production from cellulose by rumen liquor compost cultures that were continuously enriched in cellulose-containing media. The effect of various pH values on hydrogen production and cellulose degradation was discussed. The microbial community was also analyzed to analyze the metabolic patterns of the mixture.
1 Materials and methods
1.1 Inoculum, culture conditions and batch tests
Rumen residue obtained from a buffalo cow in Harbin City, China, were poured into sterile bottles purged with N2 gas at a cool temperature. 4–5 g samples were transferred to 100 mL serum bottles with a few glass beads containing 50 mL sterile deionized water in an incubator at 37 °C. After 2 h, 5 mL supernatant was transferred into new bottles containing 50 mL nutrient medium with the following composition (g L−1): filter paper, 5 g; yeast, 2 g; NH4Cl, 1 g; NaCl, 1 g; K2HPO4, 1 g; KH2PO4, 1 g; L-cysteine, 0.5 g; MgCl2·6H2O, 0.5 g; KCl, 0.2 g; and resazurin 1 mL (0.2%). The medium was supplemented with 1 mL vitamin solution and 1 mL trace element solution (Cao et al. 2010 (9)). Batch tests without pH control were conducted with a 50 mL medium (5.0 g of Avicel PH-101 instead of a filter) in 100 mL anaerobic bottles placed in a shaker at 130 rpm at 37 °C under pH 5.5, 6, 6.5, 7, and 7.5. After being incubated for two days, the inoculum was 10% by volume from the resultant culture broth was added to the fresh medium under different pH values respectively and cultured for another two days. The enrichment procedure (enrich-to-serial) was repeated three times before the tests. Samples were collected every 6 h to determine the cell biomass, change in pH, biogas, and end products.1.2 Chemical analyses
The generated biogas was collected by gas sampling bags and sampled by injecting 1 mL of headspace gas using a gas-tight syringe (Hamilton, NV, USA). The biogas was analyzed using a gas chromatograph (GC-122, Shanghai Analysis Instrument Company, China) equipped with a thermal conductivity cell detector with nitrogen as the carrier gas at a rate of 70 mL min−1. The column (2 m) packed with TDS 01 (60–80 meshes). The column and detector were kept at 150 °C.18 The biogas was analyzed using a gas chromatograph (GC-122, Beijing) equipped with a thermal conductivity cell detector with argon as the carrier gas. Biomass quantity was determined by measuring the total cellular protein quantity after cell lysis according to Wang19 and quantified using UV-vis spectrophotometer (DU800, Beckman, USA) by the Lowry method. Cellulose concentration was measured according to the method devised by Huang,20 using phenol–sulfuric acid with glucose as the standard.21 After the fermenting liquor was centrifugated (10![[thin space (1/6-em)]](https://www.rsc.org/images/entities/char_2009.gif) 000 rpm), the supernatant was filtered with 0.22 M filter membrane. The concentrations of metabolic products (VFAs and ethanol) were detected by gas chromatography (7890 A, Agilent, USA) fitted with a flame ionization detector (FID). A stainless steel column (2 m) with a vector GDX103 (60–80 meshes) and the temperature in vaporizing chamber, column and room are 200 °C, 190 °C and 240 °C respectively. The pH was measured by a pH meter (PHS-2F, Lei-Ci, Shanghai, China). All experiments were conducted in triplicate and the mean values were calculated.
000 rpm), the supernatant was filtered with 0.22 M filter membrane. The concentrations of metabolic products (VFAs and ethanol) were detected by gas chromatography (7890 A, Agilent, USA) fitted with a flame ionization detector (FID). A stainless steel column (2 m) with a vector GDX103 (60–80 meshes) and the temperature in vaporizing chamber, column and room are 200 °C, 190 °C and 240 °C respectively. The pH was measured by a pH meter (PHS-2F, Lei-Ci, Shanghai, China). All experiments were conducted in triplicate and the mean values were calculated.| Hydrogen production (mL L−1) = (accumulated biogas production quantity) × (hydrogen content in gas)/(medium volume). QH2 (mmol g−1) = (accumulated biogas production quantity) × (hydrogen content in gas)/total cellulose quantity in the medium. |
1.3 DNA extraction, polymerase chain reaction and sequence analysis
DNA of the cells was extracted at different pH values (Power Soil DNA Isolation Kit, MO-BIO). The partial 16S rDNA fragments were amplified by polymerase chain reaction (PCR) using a pair of universal primers 8F 5′-AGAGTTTGATCCTGGCTCAG-3′ and 533R (50-TTACCGCGGCTGCTGG-CAC-30) corresponding to the V1–V3 region of the bacterial 16S rDNA genes. The reaction mixture (25 μL) contained 2.5 μL 10 × PCR buffer (Mg2+), 2.5 μL of 2.5 mmol L−1 deoxy-ribonucleoside triphosphate (dNTP), 0.125 μL of Ex Taq DNA polymerase, 0.25 μmol L−1 forward primer, 0.25 μmol L−1 reverse primer (20 pmol L−1), and 20 ng template DNA. The samples were amplified with the thermal profile followed by a 9700 PCR meter (PE9700, Biometra, Tgradient) for 5 min at 95 °C, 30 s at 60 °C, and 1 min at 72 °C for 30 cycles. Pyrosequencing was carried out on a Roche massively parallel 454 GS-FLX sequencer. To analyze the bacterial diversity and microbial community structure at different initial pH values, the sequences were phylogenetically allocated down to the phylum, family, and genus levels using the MOTHUR program in the confidence threshold of 95% at a 0.03 distance level (97% similarity). Relative abundance of a given group was calculated by dividing the sequence number of that group by the total number of sequences.2 Results and discussion
2.1 Effects of pH values on cellulose degradation and hydrogen production yield
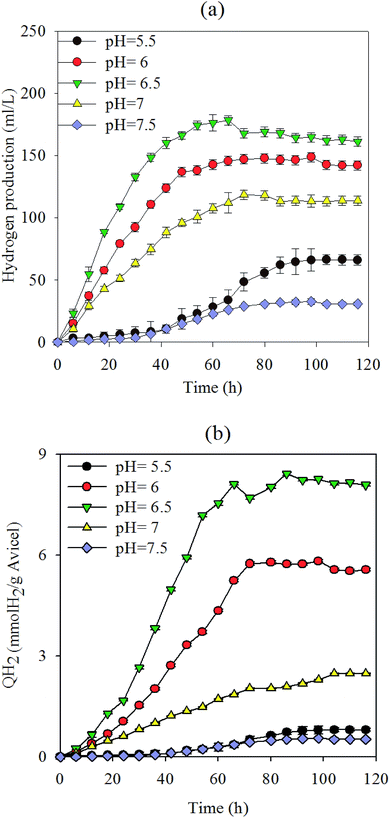
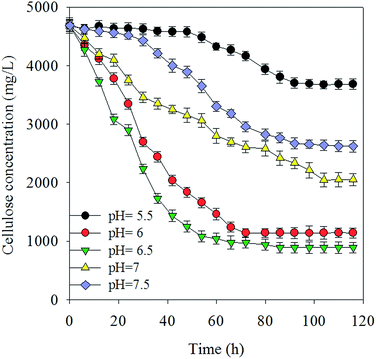
Under normal fermentation conditions, the rumen environment is weakly acidic and populated by microbes that are adapted to pH values between 5.5 and 6.5.22 Fig. 1(a and b) shows the hydrogen production yield in culture medium and total substrate at various pH values, respectively, using 5 g L−1 Avicel as the sole carbon substrate. Cellulose was degraded to produce 36 mL L−1 (0.55 mmol H2 g−1 Avicel)–178 mL L−1 H2 (8.42 mmol H2 g−1 Avicel) (Fig. 1 and 2). The pH value of 6.5 presents the best value that can maintain the cellulose degradation (81.3%) with a hydrogen-producing capacity of 178 mL L−1. The liquor at pH 6.5 resulted in the highest hydrogen production and cellulose-degrading capacity, peaking at 8.42 mmol H2 g−1 Avicel. This value was higher than that for most microorganisms in the first-generation feedstock.23,24 At pH 6, 6.5, and 7, the cellulose hydrolysis started with no apparent time lag due to the enriched mixture culture and suitable pH values. Hydrogen production at pH 6.5 reached the maximum value earlier than at the other pH values, because the cooperation of microflora increased for up to 48 h and then slowed down. Hydrogen production and degradation of cellulose were slowed down by the decrease in pH accompanied by the formation of VFAs and ethanol throughout the cellulose fermentation. The H2 yield was a little lower in the next 60 h because of some strains which consumed hydrogen. However, a longer lag-time and inefficiency were observed when pH was below 5.5. Fibrolytic ruminal bacteria are generally sensitive to low pH and the growth levels of the main cellulolytic bacteria, such as Ruminococcus and Fibrobacter, are considerably suppressed below pH 6.1 even after adaptation to low pH.25,26 Besides, many of the non-cellulolytic ruminal bacteria are less sensitive to low pH than the cellulolytic bacteria.27 Generally, enzyme activity related to the growth and metabolism of bacterial cells was inhibited at high pH, and this affected the absorption of nutrients, resulting in low biomass and a decline in hydrogen production capacity. In summary, pH above 7.5 revealed a poor efficiency with regard to both cellulose degradation and hydrogen production. There was no methane production during the experiment (Fig. 3).2.2 VFA production
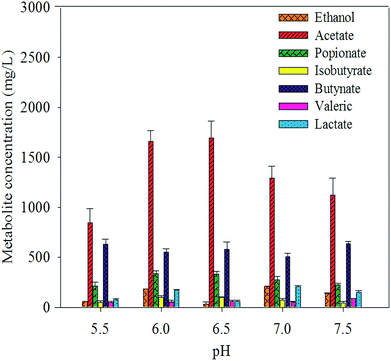
The concentrations of individual VFAs were determined from the final concentration at the end of the fermentation. In all batches, acetate, butyrate, and propionate were found to be the major aqueous products of cellulose fermentation. Ethanol, lactate, and other macromolecular VFAs were also detected but at low concentrations. The concentration of acetate increased as pH dropped below 6.5 and decreased as pH as well as butyrate increased. The concentrations of individual VFAs were determined from the final concentration at the end of the fermentation. In all batches, acetate, butyrate, and propionate were found to be the major aqueous products of cellulose fermentation. Ethanol, lactate, and other macromolecular VFAs were also detected but at low concentrations. The concentration of acetate increased as pH dropped below 6.5 and decreased as pH as well as butyrate increased. This result suggests that the variation in pH led to the change in the distribution of fermentative products. Hydrogen production and the decrease in pH were accompanied by the formation of VFAs and ethanol throughout the cellulose-consuming fermentation. Acetate, the main fatty acid among the fermentation end-products, constituted more than 65% of total soluble metabolites. The results suggested that the hydrogen was produced from Avicel by anaerobic mixed cultures in cow manure via mixed acid fermentation (Fig. 4).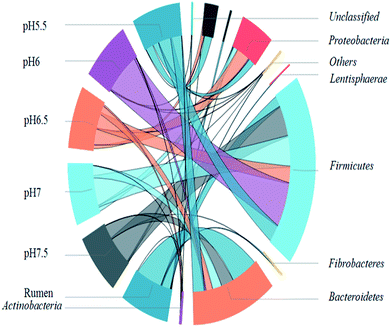 | ||
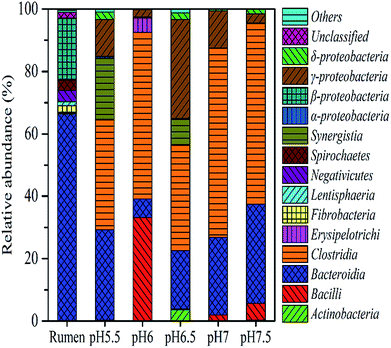
| Fig. 4 Microbial community structure of original rumen liquid at different pH values at the phylum level. R in x-axis is short for original rumen liquid. | ||
2.3 Microbial community analysis
To identify the phylogenetic diversity of bacterial communities in diverse pH values, qualified reads were assigned to known phyla, classes, and genera. The original rumen microorganisms were mainly Bacteroidetes (66.65%), Firmicutes (23.31%), and Spirochaetae (3.26%) at the phylum level. Some major changes occurred in the process of the transition of the rumen microbes; for example, Firmicutes became the dominant microorganism (91.02% at pH 6). It is important to explain the next step, which concerns the separation of the bacteria. The present enrich-to-serial select method produces a much simpler microbial structure than the original rumen liquor, which is composed of at least ten strains. Firmicutes contain a large number of cellulolytic bacteria, including Ruminococcus (Ruminococciis), Butyrivibrio (Butyvibrh), false Butyrivibrio (Pseudobutyrivibrio), Helicobacter species (Oscillibacter), and Eubacterium (Eubacterium).28 Bacteroides were reported to be capable of hydrolyzing complex organics.29 They are also the most predominant bacteria found in the human intestine, where they assist in breaking down food and producing the nutrients and energy that the body needs. An important hemicellulolytic activity has been observed in several bacterial species including the predominant Bacteroides;30 in addition, some Bacteroides species isolated from human fecal samples have been investigated as important decomposers of hemicellulose or xylan.31,32 Synergistetes33 (19.61% at pH 5.5) are widely distributed throughout anaerobic environments, especially those associated with the digestive system of animals and Proteobacteria.In order to understand the gap between the six groups in detail, we classified the microorganisms into higher nucleotide identities (class). Clostridia-dominant Bacteroidia at all pH values (60.7% at pH 7) anaerobically degraded simple and complex carbohydrates including cellulosic biomass (Fig. 5).34 Furthermore, many Clostridia species were reported to be capable of producing H2.35 Bacilli (34% at pH 6) belong to Firmicutes and contain species that secrete celluloses and accelerate cellulose degradation36 as well as fermentative hydrogen production.37 Synergistia (19.6% at pH 5.5) have the ability to degrade cellulose and hemicellulose components of plant material that are indigestible by the host in the gut environment.38 The gamma-Proteobacteria contains medically and scientifically important groups of bacteria, such as the Enterobacteriaceae, Vibrionaceae, and Pseudomonadaceae.
Many gamma-Proteobacteria (31.7% at pH 6.5) grow on a cellulose derivative and a structurally diverse substrate such as the ammonia fiber explosion-treated corn stover.45 The analysis of the genus distribution can provide more information on the function of the community. In order to facilitate the analysis, only the dominant genus (>2%) are listed in an arbitrary sample. Table 1 shows the relative abundance and phylogenetic characteristics of rumen microorganisms in the original liquid. The results show that the number of cultivable rumen microorganisms accounts for less than 10% of the total number of microorganisms, consistent with the previous research.46 After acclimation, known rumen bacteria, such as Enterococcus, were detected in many hydrogen production systems (32.8% at pH 6) instead of the uncultured bacterium (Table 2).47 Enterobacter48 is known to function as a hydrogen producer (31.2% at pH 6.5), and Oscillibacter (37.7% at pH 7 and 34.9% at pH 7.5) are known to contribute to the basic functions of the rumen ecosystem49 as well as many environmental sequences similar to the ones in cow and goat fecal samples.2 Moreover, cellulolytic bacteria such as Pyramidobacter50 belong to Synergistetes33 and are widely associated with the digestive system of animals. Lachnospiraceae, and Ruminococcaceae were enriched in endo-1, 4-beta-xylanase and cellulase genes,38 Erysipelotrichaceae51 and Proteiniclasticum52 (Fig. 6). Clostridium belongs to the Firmicutes phylum and has been reported to produce hydrogen using various substrates such as glucose,53 sucrose,54 xylose,55 starch,56 lactose,57 and sweet potatoresides.58 In addition, there are many bacteria that can not only degrade cellulose but also produce hydrogen (e.g., Clostridium). Other microorganisms such as Eubacterium (characterized by heterotrophic growth, with acetic acid, carbon dioxide, and H2 as the main products),59 Enterobacter,60 (it produces H2 from cellulose and glucose), and Enterococcus61 can also provide those two functions. Hydrogen producers such as Anaerofilum62 and Desulfovibrio63 were also observed in the system. After enrichment from rumen, the bacteria in the solution are basically related to hydrogen production from degraded cellulose (Table 2).
| Genome name | Relative abundance (%) | Relationship with cellulose degradation | Reference |
|---|---|---|---|
| a This lists the strains percentage in original rumen liquid and their relationship with cellulose degradation. The flora contains 35.77% of uncultured and unclassified bacterium, 44.88% of uncultured rumen bacterium, 10.63% of unidentified rumen bacterium and 0.56% of other strains. | |||
| Butyrivibrio fibrisolvens | 0.79 | Degradation of several isolated hemicelluloses (xylans, glucomannan, xyloglucan) | 39 |
| Fibrobacter succinogenes | 1.42 | Considered the main bacteria responsible for roughage fiber degradation | 40 |
| Lachnospiraceae bacterium | 0.26 | Lachnospiraceae persist in fibrolytic communities and are uniquely suited to degrade a wide variety of recalcitrant substrates | 13 |
| Prevotella ruminicola | 3.86 | Bacteroides and rumen Prevotella species play important roles in the metabolism of starch, protein, peptides, hemicellulose, and pectin | 41 |
| Bacteroidales bacterium | 0.83 | ||
| Ruminococcus flavefaciens | 0.44 | Cellulolytic Ruminococcus spp. Play an important role in the degradation of plant cell wall polysaccharides | 42 |
| Treponema spp. | 0.27 | Treponema does not utilize cellulose, but is associated with plant cell wall materials and promote the digestion of cellulosic materials with the cellulolytic bacterium | 43 |
| Uncultured Spirochaeta sp. | 0.30 | Some species of Spirochaeta secrete seven glycoside hydrolases for plant biomass degradation | 44 |
| Genus name | Abundance (%) | |||||
|---|---|---|---|---|---|---|
| pH = 5.5 | pH = 6 | pH = 6.5 | pH = 7 | pH = 7.5 | ||
| Cellulolytic bacteria | Bacteroides | 22.14 | 4.63 | 17.59 | 23.44 | 25.7 |
| Dysgonomonas | 0.72 | 0.91 | 0.1 | — | — | |
| Erysipelotrichaceae | 0.07 | 4.5 | 0.1 | — | — | |
| Lachnospiraceae | 0.61 | 0.6 | 2.53 | 0.83 | 3.65 | |
| Oscillibacter | 0.33 | 0.32 | 6.4 | 37.7 | 38.49 | |
| Pyramidobacter | 17.47 | 0.29 | 8.21 | — | — | |
| Proteiniclasticum | 0.03 | 22.38 | 0.07 | 0.04 | — | |
| Ruminococcaceae | 5.12 | 0.3 | 1.13 | 2.38 | 6.38 | |
| Rikenellaceae | 0.58 | 0.05 | 0.01 | 0.1 | 0.01 | |
| Hydrogen producer | Anaerofilum | 21.36 | 3.7 | 18.67 | 14.71 | 6.11 |
| Desulfovibrio | 2.38 | 0.21 | 2.13 | 0.61 | 1.4 | |
| Bacteria produce H2 from cellulose | Enterobacter | 11.67 | 1.79 | 31.22 | 9.76 | 2.7 |
| Eubacterium | 0.92 | 0.05 | 2.18 | 0.81 | 0.36 | |
| Clostridium | 0.24 | 6.68 | 1.43 | 0.1 | 1.21 | |
| Citrobacter | 0.05 | 0.02 | — | 1.76 | — | |
| Enterococcus | 0.06 | 32.8 | 0.34 | 1.73 | 5.27 | |
| Hydrogen consumer | Veillonellaceae | 0.13 | 0.0000 | 0.19 | 3.56 | 1.44 |
| Lachnospiraceae | 0.61 | 0.6 | 2.53 | 0.83 | 3.65 | |
| Total | 84.49 | 79.83 | 94.83 | 98.36 | 96.37 | |
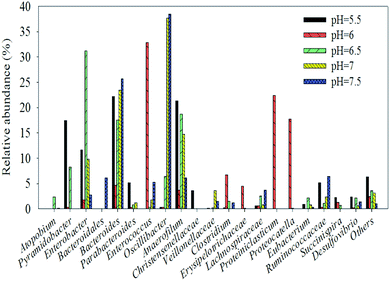 | ||
| Fig. 6 Different microbial community structures of original rumen liquid at different pH values at the genus level the chart shows the dominant strains (>2%) only. | ||
The experiment also revealed the presence of possible hydrogen consumers related to the class Bacteroidetes and other strains affiliated with Lachnospiraceae and Veillonellaceae.64 The presence of hydrogen consumers is a good indication of the reduction in hydrogen production at the later stage of fermentation.
3 Conclusions
The experimental results showed that efficient degradation of cellulose could be achieved in batch cultures inoculated with rumen microorganisms. The rumen enriched cultures showed the best cellulose hydrolysis efficiency of 81% and the maximum hydrogen yield of 178.16 mL L−1 (8.42 mmol H2 g−1 Avicel) at pH 6.5. Acetate, propionate, and butyrate were the major liquid products at all pH values. Smaller amounts of ethanol and lactate were produced during the conversion of cellulose into hydrogen. The relative abundances of bacterial populations changed during the pH value transition.Conflicts of interest
There are no conflicts to declare.Acknowledgements
We are grateful to the National Natural Science Foundation of China (No. 51178140, No. 31270004), National science and technology plan of China (2014BAD02B03) and Shen Zhen Project (No. JSGG20140701142025265).References
- J. O. M. Bockris, Int. J. Hydrogen Energy, 2002, 27, 731–740 CrossRef CAS.
- G. H. Lee, S. Kumar, J. H. Lee, D. H. Chang, D. S. Kim, S. H. Choi, M. S. Rhee, D. W. Lee, M. H. Yoon and B. C. Kim, J. Bacteriol., 2012, 194, 6362 CrossRef CAS PubMed.
- N. Ren, J. Li, B. Li, Y. Wang and S. Liu, Int. J. Hydrogen Energy, 2006, 31, 2147–2157 CrossRef CAS.
- S. D. Kim and B. E. Dale, Biomass Bioenergy, 2004, 26, 361–375 CrossRef.
- C. E. Wyman, D. D. Spindler and K. Grohmann, Biomass Bioenergy, 1992, 3, 301–307 CrossRef CAS.
- Z. H. Hu, G. Wang and H. Q. Yu, Biochem. Eng. J., 2004, 21, 59–62 CrossRef CAS.
- S. M. Lewis, L. Montgomery, K. A. Garleb, L. L. Berger and G. C. Fahey, Appl. Environ. Microbiol., 1988, 54, 1163–1169 CAS.
- T. Bell, J. A. Newman, B. W. Silverman, S. L. Turner and A. K. Lilley, Nature, 2005, 436, 1157–1160 CrossRef CAS PubMed.
- Z. H. Hu and H. Q. Yu, Process Biochem., 2005, 40, 2371–2377 CrossRef CAS.
- Y. H. Yang, B. C. Wang, L. J. Xiang, C. R. Duan, Q. H. Wang and J. Lian, Colloids Surf., B, 2003, 32, 51–56 CrossRef CAS.
- Z. Cui, M. Li, Z. Piao, Z. Huang, M. Ishii and Y. Igarashi, Chin. J. Mar. Environ. Sci., 2002, 23, 36 CAS.
- Y. U. Yan-Ling, Y. J. Feng, G. Fei, Y. U. Li-Xin and X. U. Chen, J. Harbin Inst. Technol., 2011, 43, 30–34 Search PubMed.
- J. M. Brulc, D. A. Antonopoulos, M. E. B. Miller, M. K. Wilson, A. C. Yannarell, E. A. Dinsdale, R. E. Edwards, E. D. Frank, J. B. Emerson and P. Wacklin, Proc. Natl. Acad. Sci. U. S. A., 2009, 106, 1948–1953 CrossRef CAS PubMed.
- N. Q. Ren, J. F. Xu, L. F. Gao, L. Xin, J. Qiu and D. X. Su, Int. J. Hydrogen Energy, 2010, 35, 2742–27462008 CrossRef CAS.
- X. J. Zheng and H. Q. Yu, Appl. Biochem. Biotechnol., 2004, 112, 79–90 CrossRef CAS PubMed.
- C. S. Stewart, Appl. Environ. Microbiol., 1977, 33, 497–502 CAS.
- H. E. T Miwa, J. Umemori and T. Hino, Appl. Environ. Microbiol., 1997, 63, 2155–2158 Search PubMed.
- G. Cao, N. Ren, A. Wang, D. J. Lee, W. Guo, B. Liu, Y. Feng and Q. Zhao, Int. J. Hydrogen Energy, 2009, 34, 7182–7188 CrossRef CAS.
- A. Wang, L. Gao, N. Ren, J. Xu, C. Liu, G. Cao, H. Yu, W. Liu, C. L. Hemme and Z. He, Appl. Environ. Microbiol., 2011, 77, 517–523 CrossRef CAS PubMed.
- L. Huang, L. N. Gibbins and C. W. Forsberg, Appl. Environ. Microbiol., 1985, 50, 1043 CAS.
- M. Dubois, K. A. Gilles, J. K. Hamilton, P. A. Rebers and F. Smith, Nature, 1951, 168, 167 CrossRef CAS PubMed.
- P. N. Hobson and C. S. Stewart, The Rumen Microbial Ecosystem, Springer, Netherlands, 1997 Search PubMed.
- C. L. Cheng, Y. C. Lo, K. S. Lee, D. J. Lee, C. Y. Lin and J. S. Chang, Bioresour. Technol., 2011, 102, 8514–8523 CrossRef CAS PubMed.
- A. Wang, N. Ren, Y. Shi and D. J. Lee, Int. J. Hydrogen Energy, 2008, 33, 912–917 CrossRef CAS.
- N. Asanuma and T. Hino, Mendeleev Commun., 2005, 15, 222–223 CrossRef.
- K. Miyazaki, T. Hino and I. Hisao, J. Gen. Appl. Microbiol., 1992, 38, 567–573 CrossRef CAS.
- J. B. Russell and D. B. Dombrowski, Appl. Environ. Microbiol., 1980, 39, 604–610 CAS.
- N. J. Evans, J. M. Brown, R. D. Murray, B. Getty, R. J. Birtles, C. A. Hart and S. D. Carter, Appl. Environ. Microbiol., 2011, 77, 138 CrossRef CAS PubMed.
- H. Rismani-Yazdi, S. M. Carver, A. D. Christy, Z. Yu, K. Bibby, J. Peccia and O. H. Tuovinen, Bioresour. Technol., 2013, 129, 281–288 CrossRef CAS PubMed.
- H. G. Betian, B. A. Linehan, M. P. Bryant and L. V. Holdeman, Appl. Environ. Microbiol., 1977, 33, 1009–1010 CAS.
- A. E. Naas, A. K. Mackenzie, J. Mravec, J. Schückel, W. G. Willats, V. G. Eijsink and P. B. Pope, mBio, 2014, 5, 01401–01414 CrossRef PubMed.
- M. J. Hopkins, H. N. Englyst, S. Macfarlane, E. Furrie, G. T. Macfarlane and A. J. Mcbain, Appl. Environ. Microbiol., 2003, 69, 6354–6360 CrossRef CAS PubMed.
- J. J. Godon, J. Morinière, M. Moletta, M. Gaillac, V. Bru and J. P. Delgènes, Environ. Microbiol., 2005, 7, 213 CrossRef CAS PubMed.
- M. Desvaux, FEMS Microbiol. Rev., 2005, 29, 741–764 CrossRef CAS PubMed.
- J. N. Zhang, Y. H. Li, H. Q. Zheng, Y. T. Fan and H. W. Hou, Bioresour. Technol., 2015, 192, 60 CrossRef CAS PubMed.
- L. X. Li, K. Li, K. Wang, C. Chen, C. Gao, C. Q. Ma and P. Xu, Bioresour. Technol., 2014, 170, 256–261 CrossRef CAS PubMed.
- V. C. Kalia, S. R. Jain, A. Kumar and A. P. Joshi, World J. Microbiol. Biotechnol., 1994, 10, 224–227 CrossRef CAS PubMed.
- A. Biddle, L. Stewart, J. Blanchard and S. Leschine, Diversity, 2013, 5, 627–640 CrossRef.
- E. Berger, W. A. Jones, D. T. Jones and D. R. Woods, Mol. Genet. Genomics, 1990, 223, 310–318 CrossRef CAS PubMed.
- C. W. Forsberg, K. J. Cheng and B. A. White, Polysaccharide Degradation in the Rumen and Large Intestine, Springer, US, 1997 Search PubMed.
- H. J. Flint, J. C. Martin and A. M. Thomson, Prevotella bryantii, P. ruminicola and Bacteroides Strains, Springer, Berlin Heidelberg, 2000 Search PubMed.
- M. T. Rincón, S. I. Mccrae, J. Kirby, K. P. Scott and H. J. Flint, Appl. Environ. Microbiol., 2001, 67, 4426–4431 CrossRef.
- A. Z. Bekele, S. Koike and Y. Kobayashi, FEMS Microbiol. Lett., 2011, 316, 51–60 CrossRef CAS PubMed.
- A. Schiefner, A. Angelov, W. Liebl and A. Skerra, Proteins: Struct., Funct., Bioinf., 2016, 84, 855–858 CrossRef CAS PubMed.
- A. S. Adams, M. S. Jordan, S. M. Adams, G. Suen, L. A. Goodwin, K. W. Davenport, C. R. Currie and K. F. Raffa, ISME J., 2011, 5, 1323–1331 CrossRef CAS PubMed.
- S. Kumar and D. W. Pitta, Revolution in Rumen Microbiology, Springer, India, 2015 Search PubMed.
- C. Cisneros-Pérez, J. Carrillo-Reyes, L. B. Celis, F. Alatriste-Mondragón, C. Etchebehere and E. Razo-Flores, Int. J. Hydrogen Energy, 2015, 40, 6329–6339 CrossRef.
- N. Kumar and D. Das, Process Biochem., 2000, 35, 589–593 CrossRef CAS.
- M. Kim, J. Kim, L. A. Kuehn, J. L. Bono, E. D. Berry, N. Kalchayanand, H. C. Freetly, A. K. Benson and J. E. Wells, J. Anim. Sci., 2014, 92, 683–694 CrossRef CAS PubMed.
- J. Downes, S. R. Vartoukian, F. E. Dewhirst, J. Izard, T. Chen, W. H. Yu, I. C. Sutcliffe and W. G. Wade, Int. J. Syst. Evol. Microbiol., 2009, 59, 972–980 CrossRef CAS PubMed.
- J. H. Liu, G. R. Bian, W. Y. Zhu and S. Y. Mao, Front. Microbiol., 2015, 6, 167 Search PubMed.
- L. Y. Yang, J. Chen, X. L. Cheng, D. M. Xi, S. L. Yang, W. D. Deng and H. M. Mao, Mol. Biol. Rep., 2010, 37, 553 CrossRef CAS PubMed.
- Z. X. Song, X. H. Li, W. W. Li, Y. X. Bai, Y. T. Fan and H. W. Hou, Bioresour. Technol., 2014, 157, 91 CrossRef CAS PubMed.
- C. Y. Lin and R. C. Chang, Int. J. Hydrogen Energy, 2004, 29, 715–720 CrossRef CAS.
- F. Taguchi, N. Mizukami, K. Hasegawa and T. Saitotaki, Can. J. Microbiol., 2011, 40, 228–233 CrossRef.
- G. Liu and J. Shen, J. Biosci. Bioeng., 2004, 98, 251–256 CrossRef CAS PubMed.
- C. Collet, N. Adler, J. P. Schwitzguébel and P. Péringer, Int. J. Hydrogen Energy, 2004, 29, 1479–1485 CrossRef CAS.
- H. Yokoi, A. Saitsu, H. Uchida, J. Hirose, S. Hayashi and Y. Takasaki, J. Biosci. Bioeng., 2001, 91, 58–63 CrossRef CAS PubMed.
- T. A. D. Nguyen, S. J. Han, J. P. Kim, S. K. Mi, K. O. You and J. S. Sang, Int. J. Hydrogen Energy, 2008, 33, 5161–51682 CrossRef CAS.
- M. A. Rachman, Y. Nakashimada, T. Kakizono and N. Nishio, Appl. Microbiol. Biotechnol., 1998, 49, 450–454 CrossRef CAS.
- Z. X. Song, Z. Y. Wang, L. Y. Wu, Y. T. Fan and H. W. Hou, Int. J. Hydrogen Energy, 2012, 37, 6554–6561 CrossRef CAS.
- S. V. Mohan, L. Agarwal, G. Mohanakrishna, S. Srikanth, A. Kapley, H. J. Purohit and P. N. Sarma, Int. J. Hydrogen Energy, 2011, 36, 8234–8242 CrossRef.
- S. Benomar, D. Ranava, E. Trably, Y. Rafrafi, A. Ducret, J. Hamelin, E. Lojou, J. P. Steyer and M. T. Giudiciorticoni, Nat. Commun., 2015, 6, 6283 CrossRef CAS PubMed.
- P. E. P. Koskinen, A. H. Kaksonen and J. A. Puhakka, Biotechnol. Bioeng., 2007, 97, 742–758 CrossRef CAS PubMed.
| This journal is © The Royal Society of Chemistry 2017 |

