 Open Access Article
Improved mechanical and fatigue properties of graphene oxide/silica/SBR composites†
Songbo Zhanga,
Long Zhenga,
Donghai Liua,
Zongchao Xua,
Liqun Zhang a,
Li Liu*b and
Shipeng Wen
 *a
*a
aBeijing Engineering Research Center of Advanced Elastomers, Beijing University of Chemical Technology, Beijing 100029, China. E-mail: wensp@mail.buct.edu.cn
bState Key Laboratory of Chemical Resource Engineering, Beijing University of Chemical Technology, Beijing 100029, China
First published on 22nd August 2017
Abstract
In this research, graphene oxide (GO) and silica reinforced styrene-butadiene rubber (SBR) composites were prepared by compounding GO/SBR masterbatch with silica. The influence of GO on the evolution of the filler network and crosslinking network of the composite during the fatigue process was investigated. Furthermore, the fatigue lifetimes of composites with different GO contents were obtained. The results showed that the GO sheets had a fine dispersion in the SBR matrix. The filler network constructed by GO and silica was improved after addition of the GO, resulting in the enhanced mechanical properties of the composites. During the fatigue process, the dispersion of GO and silica was enhanced, and the crosslinking density of the composites gradually decreased. S–N curves showed that the fatigue lifetime of the composites was improved after the addition of GO. Strain energy density can be used as a predictor of fatigue lifetime for the GO/silica/SBR composites.
Introduction
Rubber components, such as tires, conveyor belts, and dampers, are usually used under cyclic stress or deformations. After serving for a long time, these components will gradually be destroyed, leading to the potential for accidents to occur.1 Therefore, research about the fatigue mechanism and lifetime still attracts more and more attention. In general, the composite failure during the fatigue process involves the initiation and propagation of micro cracks. These processes are governed by a combination of factors including rubber matrix, filler, crosslinking, surrounding atmosphere and so on.2,3 Among these factors, fillers have a more important influence on the rubber fatigue, because fillers not only act as a barrier to crack propagation, but also make the crack tip blunt and inhibit the expansion of the crack.4 Traditional rubber composites are mainly filled by carbon black (CB), silica, carbon nanotube (CNT), clay, and so on.5–8 The shape of these particles has different influences on the fatigue properties of the composites. Especially, the composites with sheet particles showed a better tear resistance and gas barrier properties9–12 compared with those with spherical particles. For example, the addition of clay into the rubber improved the hysteresis and tearing energy, effectively blunted the crack tip, hindered the crack growth, and increased the fatigue life.13–15Recently, graphene oxide (GO) has been extensively studied in the field of rubber composites.16–18 Compared with clay, GO has much smaller thickness, and larger specific surface area. Meanwhile, GO can be well-dispersed in the rubber matrix and form a strong interface with rubber matrix, due to the presence of oxygen-contained groups on the surface of the GO sheets. These features make GO as an ideal candidate for preventing crack growing19 and improve fatigue resistance of rubber composites. Wu Y. P. et al.20 studied the effect of different GO loadings on the fatigue properties of natural rubber. It was found that the addition of GO significantly improved the fatigue properties. The crack propagation rate was the lowest in the tear energy range with 1 phr GO which was mainly related to the high hysteresis. Ning Yan et al.21 found that graphene accelerated the crack growth of natural rubber at low strain, and the crack growth was hindered in the relatively high strain, mainly attributed to the addition of GO and tensile crystallization of natural rubber. However, most graphene/rubber composites in the previous research were only filled by graphene. In fact, different fillers are often filled together into rubber component to get comprehensive properties. Therefore, the influence of the combinations of GO and other filler on the performance of the composites is still required to be understood. Furthermore, the evolutions of filler network and crosslinking network are crucial to the fatigue properties of composites and need to be investigated.
In this research, GO and silica were chosen to reinforce styrene-butadiene rubber (SBR). The mechanical and fatigue properties of the GO/silica/SBR composite were mainly investigated. To obtain the fine dispersion of the fillers, GO/SBR masterbatch was first prepared by the latex compounding19 which is a green and effective method to obtain a well-dispersed structure of fillers in the rubber. Then, silica was filled into the GO/SBR masterbatch to form GO/silica/SBR composite. The evolution of the filler network contrasted by GO and silica, and the crosslinking network during the fatigue process was investigated. Finally, the influence of GO on the fatigue lifetimes of the composite and the lifetime predictor were obtained.
Experimental
Materials
Styrene-butadiene rubber (SBR, 1502) latex was supplied by Jilin Rubber Co., Ltd, China. GO was prepared according to the Hummers method. Silica (SiO2, VN3) was supplied by Degussa Co., Ltd, Germany. Coupling agent (Si69) was supplied by Nanjing Shuguang Chemical Co., Ltd, China. Others are all commercial reagents.Formulation
The formulation was as follows: SBR, 100 phr; SiO2, 30 phr; TESPT, 3 phr; zinc oxide, 5 phr; stearic acid, 2 phr; sulfur, 2 phr; accelerant CZ, 1.5 phr; antioxidant 4020, 1.5 phr; GO, 1, 2, 3 phr.Preparation of GO/SBR and GO/SiO2/SBR composites
GO solution and the SBR latex were mixed and mechanically stirred for 2 hours. Then, the flocculant was added to get the GO/SBR compound. The compound was further washed and dried. According to the above formula, the dry GO/SBR compound was further mixed with silica and other agents in an open mixer. Finally, the GO/SiO2/SBR compound was cured at 150 °C and the pressure of 15 MPa.Characterization
The dispersion of GO in the SBR matrix was observed by transmission electron microscopy (H-800, Hitachi Co, Japan). To determine the quality of particle dispersion after fatigue, a particle analysis was performed using the software Image J. The information obtained from the image analysis containing number of detected silica particles, average area, and area fraction of particles was shown in Table S1.† Also, a dispersion index D was used which reflects particle dispersion in the matrix. The dispersion index D was calculated using the following equation:22,23| D = 1 − f(AP/A0)/Φvol | (1) |
 | (2) |
Results and discussion
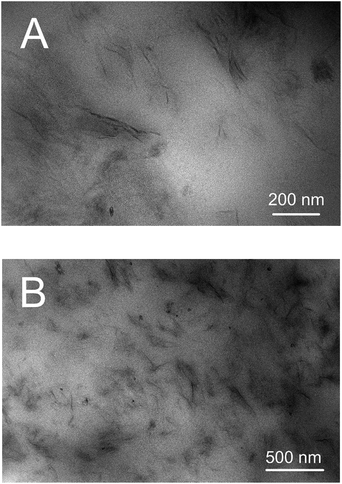
GO sheets were characterized by the Raman spectra and atomic force microscope. The results were shown in Fig. S1 and S2.† The dispersion of GO in the SBR matrix is crucial to the fatigue properties of the composites. Therefore, latex compounding was used to get the GO/SBR masterbatch. TEM photos of masterbatch are shown in Fig. 1. The dark lines represent the intersections of GO sheets and SBR matrix. No obvious agglomeration of GO was observed, indicating that GO sheets were homogeneously dispersed in the SBR matrix. Also, there were no obvious interface defects between GO and SBR, which was beneficial to the fatigue lifetimes. Based on the fine dispersion of GO in the SBR, silica was further added into the GO/SBR masterbatch to get the GO/SiO2/SBR composite.Fig. 2A shows typical Payne effect of filler network. The storage modulus G′ value increased with the increase of GO content. When the GO content was up to 3 phr, G′ increased by 2 times compared with the sample without GO. This strong reinforcement for SBR was mainly attributed to the large layer and high specific surface area of GO which had the strong ability to form a network structure cooperated with silica. With the increase of strain, the G′ of composites with different GO contents decreased rapidly. At the 400% strain, G′ came close to the same value, indicating that the filler network was almost completely destroyed. Fig. 2B shows the loss factor of composites dependence on the strain. Loss factor gradually increased with the increase of the strain and GO content. This phenomenon was due to the increasing friction between fillers or between rubber chains and fillers under the large deformation and filler content. Especially, the addition of GO enhanced filler network. More energy was required to deform the filler network constructed by both GO and silica.
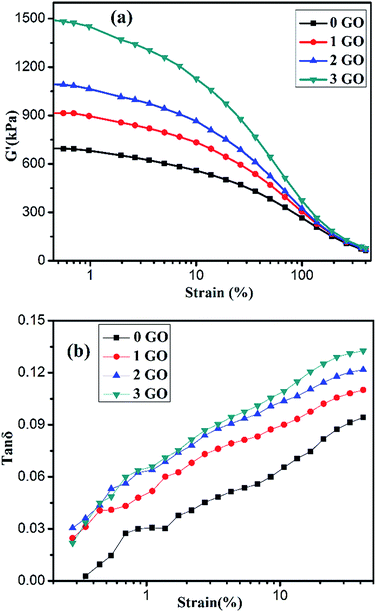 | ||
| Fig. 2 Storage modulus G′ (A) and loss factor (B) versus strain curves of uncured GO/SiO2/SBR composites. | ||
As shown in Table 1, the tensile strength, stress at 100% elongation and tear strength of the composites increased with the increase of GO content. Especially, the tensile and tear strength of composites filled with 3 phr GO increased by 63.2 and 36.6%, respectively, compared with those of composites without GO. This obvious reinforcement was mainly attributed to the large-scale sheet and specific surface area of GO. Also, the increased tear strength indicated that the addition of GO was beneficial to prevent the crack propagation of the composites during the fatigue. Noting that the elongation at break also increased with the increase of GO content. It was speculated that the introduction of GO led to less entanglement of rubber molecules due to the large sheet of GO. Meanwhile, GO sheet can isolate the neighbouring rubber chains, and decrease the viscous hysteresis when the GO/SBR composites was subject to the external force. SBR chains easily slipped along the GO sheets. Therefore, these factors were in favour of the increase in elongation at break. This phenomenon is similar to the clay filled rubbers.25
| Sample | 0 GO | 1 GO | 2 GO | 3 GO |
|---|---|---|---|---|
| Tensile strength/MPa | 11.4 ± 1.2 | 14.4 ± 1.0 | 18.0 ± 0.8 | 18.6 ± 1.1 |
| Elongation at break/% | 327 ± 12 | 375 ± 8 | 435 ± 6 | 404 ± 7 |
| Stress at 100%/MPa | 2.3 ± 0.1 | 2.6 ± 0.1 | 3.1 ± 0.2 | 3.7 ± 0.1 |
| Stress at 300%/MPa | 10.0 ± 0.2 | 10.7 ± 0.1 | 11.0 ± 0.3 | 12.4 ± 0.1 |
| Tear strength/kN m−1 | 33.1 ± 1.0 | 38.7 ± 1.6 | 41.8 ± 0.8 | 45.2 ± 1.2 |
| Hardness/Shore A | 60 ± 2 | 65 ± 2 | 69 ± 1 | 71 ± 1 |
During the fatigue process, the crosslink network and filler network both changed due to the cyclic strain. This evolution further influenced the fatigue properties of the composites. Therefore, the crosslinking densities of the GO/SiO2/SBR composites with different fatigue cycles were tested, and the results are shown in Table 2. The crosslinking densities of all samples tended to decrease with the increase of the fatigue cycles. The decrease in crosslink network after 20 thousand cycles may be mainly attributed to the breakdown of some weak crosslink bonds under the large cyclic deformation. As the fatigue cycle accumulated (50 thousand cycles), some uneven crosslink bonds continued to break. However, the decrease extent of the composites with GO was slight smaller than that without GO. This phenomenon may be attributed to the fact that the strong filler network constructed by GO and silica consumed more deformation energy and the crosslinking network was less damaged.
| Crosslinking density/(10−5 mol cm−3) | 0 GO | 1 GO | 2 GO | 3 GO |
|---|---|---|---|---|
| No fatigue | 11.07 | 11.28 | 11.27 | 11.16 |
After 20![[thin space (1/6-em)]](https://www.rsc.org/images/entities/char_2009.gif) 000 cycles 000 cycles |
10.98 | 11.13 | 11.22 | 10.96 |
After 50![[thin space (1/6-em)]](https://www.rsc.org/images/entities/char_2009.gif) 000 cycles 000 cycles |
10.52 | 10.84 | 10.95 | 10.91 |
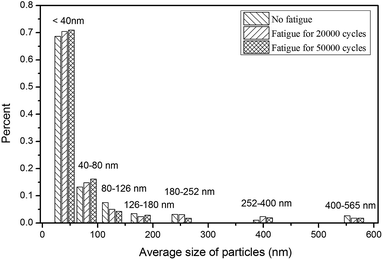
Fig. 3 shows the evolution of filler dispersion during the fatigue process. As shown in Fig. 3A, GO was well-dispersed in the composites, which was similar to the dispersion in the masterbatch (Fig. 1). However, silica dispersed unevenly in the SBR matrix. There were still some blank spaces circled by ovals between silica aggregates. After fatigue for 20 thousand and 50 thousand cycles, the blank spaces in Fig. 3B and C became smaller. The particle size distribution (Fig. 4) and dispersion index D were both obtained to get a quantitative evaluation of fillers dispersion. For the composite after fatigue for 50![[thin space (1/6-em)]](https://www.rsc.org/images/entities/char_2009.gif) 000 cycles, the statistic size distribution of particles showed that the particles with the size below 80 nm accounted for 87.2% of the total particles, which was higher than that (80.9%) of composite without fatigue. In addition, the dispersion indexes for the composites without fatigue, after 20
000 cycles, the statistic size distribution of particles showed that the particles with the size below 80 nm accounted for 87.2% of the total particles, which was higher than that (80.9%) of composite without fatigue. In addition, the dispersion indexes for the composites without fatigue, after 20![[thin space (1/6-em)]](https://www.rsc.org/images/entities/char_2009.gif) 000 and 50
000 and 50![[thin space (1/6-em)]](https://www.rsc.org/images/entities/char_2009.gif) 000 cycles were 15.3%, 19.4% and 24.6%, respectively. The increased small particle distribution and dispersion index indicated that the filler network changed during the cyclic deformation and the dispersion of silica became uniform. The improved dispersion of silica can be attributed to two main factors. First, the dynamical deformation of rubber molecules was beneficial to the dispersion of silica.26 Second, the GO sheet can penetrate into the silica aggregates and facilitate the dispersion of silica.27,28
000 cycles were 15.3%, 19.4% and 24.6%, respectively. The increased small particle distribution and dispersion index indicated that the filler network changed during the cyclic deformation and the dispersion of silica became uniform. The improved dispersion of silica can be attributed to two main factors. First, the dynamical deformation of rubber molecules was beneficial to the dispersion of silica.26 Second, the GO sheet can penetrate into the silica aggregates and facilitate the dispersion of silica.27,28
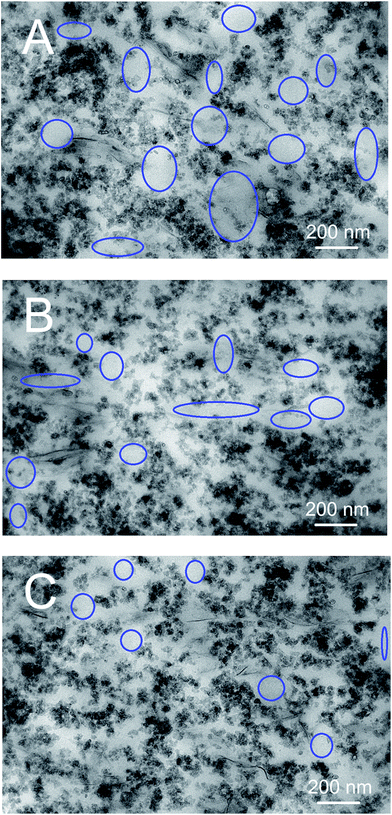 | ||
Fig. 3 TEM photos of the GO/SiO2/SBR composites with 1 phr GO (A) no fatigue (B) fatigue for 20![[thin space (1/6-em)]](https://www.rsc.org/images/entities/char_2009.gif) 000 cycles (C) fatigue for 50 000 cycles (C) fatigue for 50![[thin space (1/6-em)]](https://www.rsc.org/images/entities/char_2009.gif) 000 cycles. 000 cycles. | ||
After the GO/SiO2/SBR composites were subjected to tensile fatigue for 20![[thin space (1/6-em)]](https://www.rsc.org/images/entities/char_2009.gif) 000 cycles, the mechanical properties of composites are shown in Table 3. It was obvious noted that the tensile strength and elongation at break of the composites after fatigue were much higher than those without fatigue (Table 1). The increase in both tensile strength and elongation at break were attributed to three factors. (I) As discussed in Table 2, the crosslink density gradually decreased during the fatigue process. Hence, the increase in tensile strength was mainly attributed to the improved dispersion of fillers shown in Fig. 3. (II) Some of the silica agglomerates, especially the loosely packed ones, gradually were broken into small agglomerates or isolated particles during the fatigue process, and unable to be agglomerated again. As a result, more confined rubber chains on the silica surface were released. (III) The physical interaction between GO and SBR chains provided by the absorption sites on the surface of the GO was easily destroyed during the dynamic deformations. As a result, the less limited GO sheets were beneficial to less entanglement and the slippery of SBR chains during fatigue process. Therefore, the released confined SBR chains and weak physical interaction between GO and SBR chains after fatigue led to the increase in elongation at break of the composites after fatigue.
000 cycles, the mechanical properties of composites are shown in Table 3. It was obvious noted that the tensile strength and elongation at break of the composites after fatigue were much higher than those without fatigue (Table 1). The increase in both tensile strength and elongation at break were attributed to three factors. (I) As discussed in Table 2, the crosslink density gradually decreased during the fatigue process. Hence, the increase in tensile strength was mainly attributed to the improved dispersion of fillers shown in Fig. 3. (II) Some of the silica agglomerates, especially the loosely packed ones, gradually were broken into small agglomerates or isolated particles during the fatigue process, and unable to be agglomerated again. As a result, more confined rubber chains on the silica surface were released. (III) The physical interaction between GO and SBR chains provided by the absorption sites on the surface of the GO was easily destroyed during the dynamic deformations. As a result, the less limited GO sheets were beneficial to less entanglement and the slippery of SBR chains during fatigue process. Therefore, the released confined SBR chains and weak physical interaction between GO and SBR chains after fatigue led to the increase in elongation at break of the composites after fatigue.
![[thin space (1/6-em)]](https://www.rsc.org/images/entities/char_2009.gif) 000 cycles (deformation: 200% strain)
000 cycles (deformation: 200% strain)
| Sample | 0 GO | 1 GO | 2 GO | 3 GO |
|---|---|---|---|---|
| Tensile strength/MPa | 23.4 ± 0.6 | 22.9 ± 0.8 | 22.1 ± 0.7 | 20.7 ± 0.7 |
| Elongation at break/% | 513 ± 10 | 455 ± 7 | 462 ± 6 | 394 ± 8 |
| Stress at 100%/MPa | 2.2 ± 0.2 | 2.3 ± 0.1 | 3.4 ± 0.1 | 4.5 ± 0.3 |
| Stress at 300%/MPa | 8.9 ± 0.7 | 9.6 ± 1.0 | 12.3 ± 0.8 | 14.9 ± 0.9 |
| Hardness/Shore A | 60 ± 1 | 64 ± 1 | 68 ± 1 | 70 ± 2 |
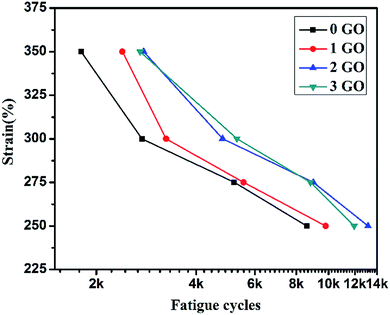
The influence of GO on the fatigue life of GO/SiO2/SBR composites was investigated and the results are shown in Fig. 5. Under the same dynamic strain, the fatigue lifetimes of composites increased obviously with the increase of GO content. The increased lifetimes were mainly attributed to the large sheet structure of GO. The GO sheet network in the SBR can effectively stop the crack growth or cause crack deflection or branching, resulting into the prolonged crack growth path and fatigue lifetime. Besides, the filler dispersion which became finer during the fatigue process also contributed to the fatigue lifetime. The fine dispersion can avoid the stress concentration and micro cracks.
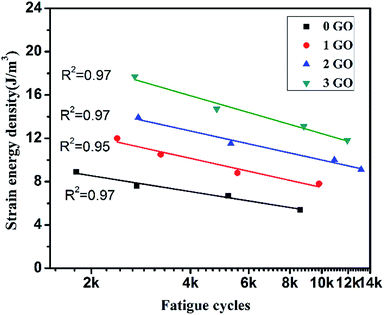
To get a predictor of lifetimes of the composites, strain energy densities (SED) of the composites at different maximum stains were calculated in Table 4, and the relation between the SED and fatigue lifetime was plotted in Fig. 6. SED was used to formulate failure criteria for materials exhibiting both ductile and brittle behaviour. The SED and fatigue life in Fig. 6 were obtained from the Table 4 and Fig. 5, respectively. Table 4 shows that the SED increases with the increase of the strain and GO content. Fig. 6 shows the relationship between SED and fatigue lifetimes. The fatigue lifetimes also increased with the increase in GO content, and the decrease in SED of the composites. This conclusion was consistent with that in Fig. 5. More importantly, the linear fitting curves for the relation of SED and fatigue lifetimes was obtained (Fig. 6), and the R square value was up to 0.95. This indicated that SED can be used as a plausible predictor of fatigue lives for the GO/SiO2/SBR composites.
| Strain/% | 0 GO | 1 GO | 2 GO | 3 GO |
|---|---|---|---|---|
| 200 | 5.4 | 5.9 | 6.9 | 9.0 |
| 250 | 6.7 | 7.8 | 9.1 | 11.8 |
| 275 | 7.6 | 8.8 | 10.0 | 13.1 |
| 300 | 8.9 | 10.0 | 11.5 | 14.7 |
| 350 | — | 12.2 | 13.9 | 17.7 |
Conclusions
The GO/SiO2/SBR composites were prepared by mixing GO/SBR masterbatch and silica. The GO layers were dispersed homogeneously in rubber matrix. With the increase of GO content, the filler network composed of silica and GO was also enhanced, leading to the increase in tensile strength, tear strength and stress at 100% elongation. After fatigue, the crosslinking density of the composites declined gradually, but the addition of GO delayed the decreased trend. However, the filler network composed of silica and GO became better as the fatigue cycle accumulated. Finally, the addition of GO and fine dispersion of total filler network leads to the prolonged fatigue lifetimes of the GO/SiO2/SBR composites. Strain energy density can be used as a predictor of fatigue lifetime for the composites.Conflicts of interest
There are no conflicts to declare.Acknowledgements
The authors gratefully acknowledge the financial support from the National Basic Research Program of China (2015CB654700(2015CB674705)), the National Natural Science Foundation of China (51573007) and the fundamental research funds for the central universities (JD1705). Beijing Municipal Science and Technology Project (Z171100002217033).Notes and references
- J. E. Mark, J. Phys. Chem. B, 2003, 107, 903–913 CrossRef CAS.
- W. V. Mars and A. Fatemi, Rubber Chem. Technol., 2004, 77, 391–412 CrossRef CAS.
- W. V. Mars and A. Fatemi, Int. J. Fatigue, 2002, 24, 949–961 CrossRef CAS.
- G. J. Lake, Rubber Chem. Technol., 1972, 45, 161–174 CrossRef.
- L. Q. Zhang and Y. Q. Wang, J. Appl. Polym. Sci., 2000, 78, 1873–1878 CrossRef CAS.
- Y. Wang and J. Liu, Polym. Eng. Sci., 2012, 52, 1027–1036 Search PubMed.
- Y. Q. Wang and Y. P. Wu, Macromol. Mater. Eng., 2012, 297, 20–25 CrossRef.
- Y. Quan, Y. Q. Wang and Y. P. Wu, J. Appl. Polym. Sci., 2013, 130, 113–119 CrossRef CAS.
- Y. P. Wu, Q. X. Jia and Y. Q. Wang, J. Appl. Polym. Sci., 2003, 89, 3855–3858 CrossRef CAS.
- Y. P. Wu, L. Q. Zhang and Y. Q. Wang, J. Appl. Polym. Sci., 2001, 82, 2842–2848 CrossRef CAS.
- L. Q. Zhang, W. Y. Zhong and Y. Q. Wang, J. Appl. Polym. Sci., 2000, 78, 1873–1878 CrossRef CAS.
- H. F. Zhang, Y. Q. Wang and Y. P. Wu, J. Appl. Polym. Sci., 2005, 97, 844–849 CrossRef CAS.
- S. Rooj, A. Das and I. A. Morozov, Compos. Sci. Technol., 2013, 76, 61–68 CrossRef CAS.
- Y. P. Wu and L. Q. Zhang, Macromol. Mater. Eng., 2006, 291, 944–949 CrossRef CAS.
- L. L. Qu, Y. J. Nie and G. S. Huang, J. Macromol. Sci., Part B: Phys., 2011, 50, 1646–1657 CrossRef.
- H. Kang, K. Zuo and Z. Wang, Compos. Sci. Technol., 2014, 92, 1–8 CrossRef CAS.
- S. Araby, Q. Meng and J. Ma, Polymer, 2014, 55, 201–210 CrossRef CAS.
- Y. Srinivasarao, R. Hanum and Y. Subban, Adv. Mater. Res., 2013, 812, 263–266 CrossRef.
- Y. Y. Mao and S. P. Wen, Sci. Rep., 2013, 3, 2508 CrossRef PubMed.
- B. Dong, C. Liu and Y. P. Wu, RSC Adv., 2015, 5, 17140–17148 RSC.
- N. Yan, H. Xia and Y. Zhan, Macromol. Mater. Eng., 2013, 298, 38–44 CrossRef CAS.
- T. Villmow, P. Potschke, S. Pegel, L. Haussler and B. Kretzschmar, Polymer, 2008, 49, 3500 CrossRef CAS.
- Z. H. Jiang, J. Jin, C. F. Xiao, X. Li and L. X. Kong, J. Instrum. Anal., 2011, 30, 330 Search PubMed.
- G. C. Sih and E. Madenci, Eng. Fract. Mech., 1983, 18, 1159–1171 CrossRef.
- C. Y. Wan, W. Dong and Y. X. Zhang, J. Appl. Polym. Sci., 2008, 107, 650 CrossRef CAS.
- F. Z. Zhang, S. P. Wen and L. Liu, RSC Adv., 2014, 4, 26706–26713 RSC.
- I. Sheet, A. Kabbani and H. Holail, Energy Procedia, 2014, 5, 130 CrossRef.
- F. Luo, L. Chen and N. Ning, J. Appl. Polym. Sci., 2012, 125, 348 CrossRef.
Footnote |
| † Electronic supplementary information (ESI) available. See DOI: 10.1039/c7ra06635j |
| This journal is © The Royal Society of Chemistry 2017 |

