 Open Access Article
In situ synthesis of g-C3N4/TiO2 heterostructures with enhanced photocatalytic hydrogen evolution under visible light†
Hui Zhang a,
Feng Liua,
Hao Wua,
Xin Caoa,
Jianhua Sun
 *a and
Weiwei Lei
 *b
*b
aSchool of Chemistry and Environmental Engineering, Jiangsu University of Technology, Changzhou 213001, Jiangsu Province, P. R. China. E-mail: sunjh@jsut.edu.cn
bInstitute for Frontier Materials, Deakin University, Waurn Ponds, Victoria 3216, Australia. E-mail: weiwei.lei@deakin.edu.au
First published on 18th August 2017
Abstract
Graphitic carbon nitride (g-C3N4) nanosheets/titanium dioxide (TiO2) nanoparticles heterostructures have been in situ synthesized via a modified sol–gel method combined with a calcination process. The prepared g-C3N4/TiO2 heterostructured composites exhibited excellent photocatalytic hydrogen generation from water splitting under visible light irradiation. It was found that the TiO2 nanoparticles are well-dispersed on the g-C3N4 nanosheets. The as-obtained g-C3N4 coupled with TiO2 not only increased the surface area of g-C3N4, but also promoted the separation of photo-generated charge carriers. The developed composite exhibits an excellent hydrogen evolution rate of 40 μmol h−1, which is about 2.7 times higher than that of pure g-C3N4 nanosheets.
Introduction
Nowadays, over-reliance on fossil fuels intensifies the energy crisis and environmental pollution. Therefore, development of renewable and clean energy supplies is urgently needed.1,2 Since the first reported photoelectronchemical splitting of water on TiO2 electrodes in 1972,3 semiconductor-based photocatalysis has been considered as one of the most attractive and important technologies to address global energy and environmental issues. To date, TiO2 is the most extensively studied photocatalyst owing to its non-toxicity, low cost and excellent photochemical stability. However, the wide bandgap (3.2 eV) of TiO2 only allows the absorption of ultra-violet (UV) light which accounts for just 4% of the solar energy.4 To efficiently utilize the energy of the solar spectrum, it is a competitive strategy to fabricate the heterostructured composites of TiO2 with other narrow bandgap semiconductors.In recent years, graphitic carbon nitride (g-C3N4) has emerged as a stable photocatalyst and attracted great attention.5–7 Due to its smaller band gap (2.7 eV),8 g-C3N4 can be excited by visible light and thereby exhibit better sunlight utilization. Despite its disadvantages including small surface area and high recombination rate of photo-generated charge carriers, g-C3N4 is still a promising candidate for constructing heterostructures with a wide bandgap semiconductor.9–11 Particularly, g-C3N4/TiO2 heterostructured composites have been widely studied.12–14 Although the improved photocatalytic activities have been achieved in previous research, most of the reported heterostructured photocatalysts are bulk materials possessing small surface areas and limited reaction sites. In addition, the photocatalytic efficiency is still not satisfied for practical application. To optimize the texture of the heterostructures, a solvothermal route has been developed.15 However, the morphologies of TiO2 need to be adjusted by using concentrated HNO3, which is corrosive and requires additional safety precautions. Thus, alternative methods for the preparation of g-C3N4/TiO2 composites with increased surface areas are of great interest.
Here we demonstrate a novel and facile approach to in situ synthesize g-C3N4 nanosheets/TiO2 nanoparticles heterostructured composites with enhanced photocatalytic activity for hydrogen evolution. The composites were synthesized by an in situ process, which could afford an intimate interfacial contact between the two phases of g-C3N4 nanosheets/TiO2 nanoparticles. The hybrid photocatalyst has a relatively large surface area and the TiO2 nanoparticles are well distributed on the g-C3N4 nanosheets. In addition, different from the previous reports,15–18 the fabrication of g-C3N4/TiO2 composites is eco-friendly, without using any hard templates or toxic solvents.
Results and discussion
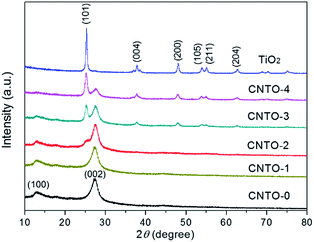
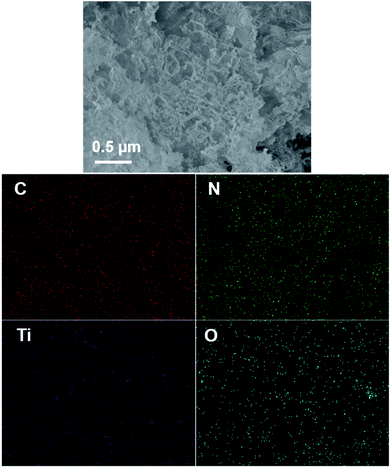
The typical experimental procedure for the synthesis of g-C3N4/TiO2 composites (labeled as CNTO-x, x = 0–4) is illustrated in Fig. 1 (for experimental details see Methods). The crystallographic structures of the as-prepared samples were examined by X-ray diffraction (XRD) firstly. As shown in Fig. 2, two obvious peaks are found at 13.1° and 27.5° in CNTO-0, which can be assigned to (100) and (002) diffraction planes of g-C3N4,19 respectively. The weak peak (100) is related to the in-planar repeat period of the N-bridged tri-s-triazine units, whereas the stronger one (002) can be attributed to the stacking of conjugated aromatic rings.8 For pure TiO2, six typical diffraction peaks appear at 25.3°, 37.8°, 48.1°, 53.9°, 55.1° and 62.7°, which can be attributed to the (101), (004), (200), (105), (211) and (204) crystal planes of anatase TiO2 (JCPDS NO. 21-1272), respectively. The intensity of the characteristic diffraction peaks of TiO2 gradually increases in the CNTO-1, CNTO-2, CNTO-3 and CNTO-4 samples, suggesting the increasing amount of coupled TiO2.The heterojunction of TiO2 and g-C3N4 can be directly observed in the transmission electron microscopy (TEM) and high-resolution transmission electron microscopy (HRTEM) images. As seen in Fig. S1,† CNTO-0 sample was exfoliated to afford g-C3N4 nanosheets after sonication. Fig. 3a–c display the morphology of the obtained CNTO-2 sample. The TiO2 nanoparticles are well distributed on the g-C3N4 nanosheets. This result indicates an excellent interfacial contact between the TiO2 phase and g-C3N4 phase. In the HRTEM image of CNTO-2 (Fig. 3d), the lattice spacing is measured to be 0.35 nm, corresponding to the (101) crystal planes of anatase TiO2, in good agreement with the above XRD analysis. In order to further confirm the interfacial contact, energy dispersive X-ray spectroscopy (EDX) mapping of the as-prepared CNTO-2 sample was carried out to investigate the distribution patterns of the component elements. As seen in Fig. 4, all of the four major elements (C, N, Ti, and O) disperse uniformly in the CNTO-2 sample. Combined with the TEM and XRD results, it suggests that within CNTO-2 sample, the TiO2 nanoparticles are indeed well dispersed on g-C3N4 nanosheets and show intimately contact.
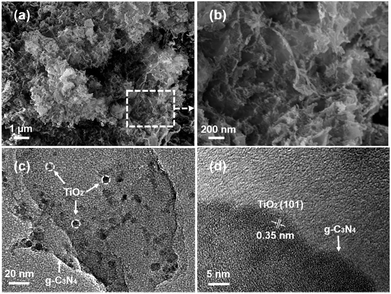 | ||
| Fig. 3 (a) SEM image of CNTO-2, (b) a magnified SEM image of the selected region in (a), (c) TEM and (d) HRTEM images of CNTO-2. | ||
The specific surface area and porous structure of all the as-prepared samples were investigated by nitrogen adsorption–desorption isotherms, and the corresponding calculated parameters are list in Table 1. The obtained g-C3N4 nanosheets (61.8 m2 g−1) has a larger surface area than the bulk one (normally below 10 m2 g−1).6,8,20 The specific surface areas of the CNTO-x samples increase with increasing TiO2 concentrations, which may come from the contribution of the enlarged external surface area of TiO2 nanoparticles. Fig. S2† shows that the isotherms of CNTO-x are identified as type IV, indicating the presence of mesopores. Moreover, the isotherm profiles exhibit typical H3 type hysteresis loops, suggesting the presence of slit-like pores.21,22
| Sample | Special surface area (m2 g−1) | Hydrogen evolution rate (μmol h−1) |
|---|---|---|
| CNTO-0 | 61.77 | 15.0 |
| CNTO-1 | 113.29 | 30.0 |
| CNTO-2 | 120.35 | 40.0 |
| CNTO-3 | 136.58 | 38.0 |
| CNTO-4 | 173.88 | 29.5 |
| TiO2 | 6.51 | 0 |
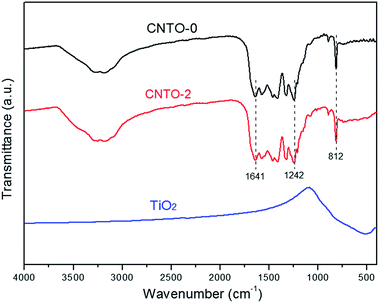
To determine the composition and chemical bonding of CNTO-0, TiO2 and CNTO-2, their Fourier transform infrared (FT-IR) spectra were measured and shown in Fig. 5. For pure CNTO-0, several intense bands in the region 1242–1641 cm−1 are ascribed to characteristic stretching vibration modes of CN heterocycles.23 The strong band at 812 cm−1 is due to the out-of-plane bending vibration characteristic of heptazine rings,24 while the broad weaker band between 3000–3500 cm−1 is assigned to N–H and O–H stretching vibration modes.21 For pure TiO2, the weak absorption bands at 400–800 cm−1 relate to the Ti–O–Ti stretching vibration.25 Notably, for CNTO-2, all of the peaks of TiO2 and g-C3N4 can be observed, demonstrating the formation of g-C3N4/TiO2 heterostructure.
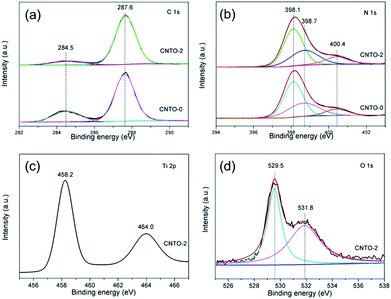
The valence and binding information of the elements were further examined by X-ray photoelectron spectroscopy (XPS). Fig. S3† displays the XPS survey of CNTO-0 and CNTO-2 samples. It is seen that CNTO-2 composite is composed of C, N, Ti and O elements, which confirms the existence of TiO2 and g-C3N4 in the hybrid sample. Fig. 6a presents the high-resolution C 1s spectrum of CNTO-2 sample in comparison with that of CNTO-0. Both of the samples exhibit two C 1s peaks, which are ascribed to the adventitious carbon at 284.5 eV (ref. 26) and the carbon atom in the N–C![[double bond, length as m-dash]](https://www.rsc.org/images/entities/char_e001.gif) N group at 287.6 eV,27 respectively. The N 1s spectra of the two samples provided in Fig. 6b can be deconvoluted into three different Gaussian–Lorentzian peaks centered at 398.1, 398.7 and 400.4 eV. The main peak at 398.1 eV is related to nitrogen atoms sp2-hybridized to carbon atom (C
N group at 287.6 eV,27 respectively. The N 1s spectra of the two samples provided in Fig. 6b can be deconvoluted into three different Gaussian–Lorentzian peaks centered at 398.1, 398.7 and 400.4 eV. The main peak at 398.1 eV is related to nitrogen atoms sp2-hybridized to carbon atom (C![[double bond, length as m-dash]](https://www.rsc.org/images/entities/char_e001.gif) N–C).24 The peak at 398.9 eV could be assigned to amino groups (C–N–H) connecting with structural defects. The weak peak with the binding energy of 400.4 eV is resulted from N bonded to three carbon atoms to develop the N–(C)3 group in the aromatic cycles.28 For CNTO-2 sample, there are no shifts in the high-resolution C 1s and N 1s spectra compared to those of CNTO-0, suggesting that TiO2 nanoparticles are only deposited on the surface of g-C3N4, and no Ti–C or Ti–N bond exists. Fig. 6c shows the high-resolution Ti 2p spectrum of the CNTO-2 sample. The peaks located at 458.2 and 464.0 eV correspond to the Ti 2p3/2 and Ti 2p1/2 of TiO2, respectively,29–31 which further confirms the Ti4+ species in the form of TiO2 nanoparticles. The O 1s spectrum (Fig. 6d) can be fitted into two peaks, and the binding energy of 529.5 and 531.8 eV can be ascribed to TiO2 and H2O, respectively.32
N–C).24 The peak at 398.9 eV could be assigned to amino groups (C–N–H) connecting with structural defects. The weak peak with the binding energy of 400.4 eV is resulted from N bonded to three carbon atoms to develop the N–(C)3 group in the aromatic cycles.28 For CNTO-2 sample, there are no shifts in the high-resolution C 1s and N 1s spectra compared to those of CNTO-0, suggesting that TiO2 nanoparticles are only deposited on the surface of g-C3N4, and no Ti–C or Ti–N bond exists. Fig. 6c shows the high-resolution Ti 2p spectrum of the CNTO-2 sample. The peaks located at 458.2 and 464.0 eV correspond to the Ti 2p3/2 and Ti 2p1/2 of TiO2, respectively,29–31 which further confirms the Ti4+ species in the form of TiO2 nanoparticles. The O 1s spectrum (Fig. 6d) can be fitted into two peaks, and the binding energy of 529.5 and 531.8 eV can be ascribed to TiO2 and H2O, respectively.32
To study the optical absorption performance of g-C3N4/TiO2 composites, the UV-vis diffuse reflection spectra of CNTO-0, TiO2 and CNTO-2 were measured. As shown in Fig. 7, the band gaps of CNTO-0 and TiO2 are estimated to be about 2.68 and 3.14 eV,26,33 with the absorption edges at about 460 and 390 nm, respectively. Although the as-prepared CNTO-2 sample shows a slightly wider band gap of 2.76 eV compared with CNTO-0, it exhibits stronger light absorption in visible light regions. The increased absorption of visible light could be attributed to the more defects in the g-C3N4 phase that are introduced by the TiO2 nanoparticles.34 Such extended absorption suggests that the composite material CNTO-2 can provide more efficient utilization of visible light and thus potentially exhibit higher photocatalytic activity.
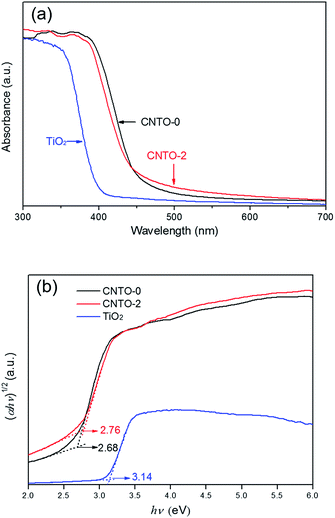 | ||
| Fig. 7 (a) UV-vis diffuse reflection spectra and (b) the plots of the (αhν)1/2 vs. photon energy (hν) for CNTO-0, CNTO-2 and TiO2. | ||
The photocatalytic activities of all the as synthesized photocatalysts were evaluated for hydrogen evolution under visible light irradiation (λ ≥ 420 nm) in the presence of triethanolamine (TEOA) as a sacrificial reagent. Control experiments were carried out in the absence of either photocatalysts or light illumination. No appreciable amounts of hydrogen gas were detected, indicating that hydrogen is generated through photocatalytic reaction. The average rates of hydrogen production within 3 h are displayed in Fig. 8a. Pure TiO2 exhibits negligible H2 generation ascribed to the incapable visible-light response, whereas CNTO-0 shows a relative low H2 production rate (15 μmol h−1) due to the fast recombination of photo-generated charge carriers. Compared with CNTO-0, all CNTO-x (x = 1–4) samples present remarkably enhanced hydrogen evolution performance. The average H2 evolution rate of CNTO-2 is observed to be the highest, 40 μmol h−1, which is about 2.7 times higher than that of CNTO-0. However, when the TiO2 content is further increased, an obvious drop of the H2 evolution rate occurs (Fig. 8a). The excess amount of TiO2 could not only occupy the surface of g-C3N4 resulting less active sites for H2 evolution, but also decrease the thermodynamic driving force for H2 evolution due to the lowered conduction band of the composite catalyst with more TiO2.35
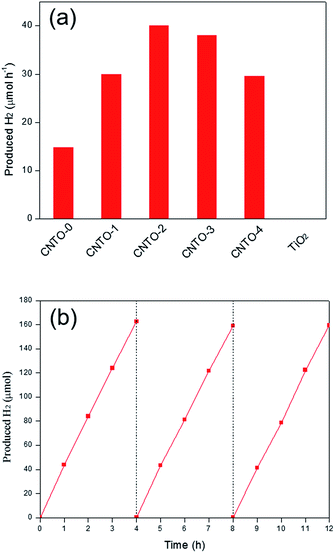 | ||
| Fig. 8 (a) H2 evolution rate of diffident samples under visible light (λ ≥ 420 nm) and (b) the stability test of CNTO-2 under visible-light irradiation. | ||
In addition, the photocatalytic stabilities of the g-C3N4/TiO2 composites were also investigated. As seen in Fig. 8b, the H2 evolution activity of CNTO-2 is highly stable and no obvious deactivation is detected even after 12 h of continuous visible light irradiation. Furthermore, the results of XRD (Fig. S4†) and TEM (Fig. S5†) of CNTO-2 after photocatalytic reactions exhibit same structure and morphology to the fresh sample demonstrating the good stability of CNTO-2.
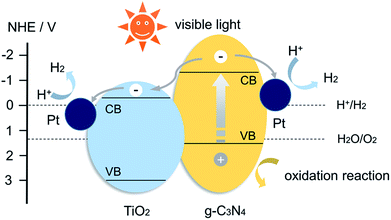
The enhanced photocatalytic activity of CNTO-2 sample lies in the enlarged specific surface area, the improved light-absorption ability and most importantly, the increased photo-generated charge-separation efficiency. Due to the construction of intimate heterojunction and well-matched band edge, the TiO2 nanoparticles could act as the electron accepters, thus improve the efficiency of charge separation. A proposed mechanism for the enhanced photocatalytic performance of the heterostructured composite is illustrated in Fig. 9. According to previous reports, the conduction band (CB) and valence band (VB) potential could be determined to be −1.12 and +1.58 V for g-C3N4, −0.29 and +2.91 V for TiO2.8,21 It is well known that, under visible light irradiation, only g-C3N4 can absorb light to produce electron–hole pairs. In pure g-C3N4, photo-generated electrons and holes are quickly recombined and only a fraction of the electrons participates in the photocatalytic reaction, resulting in a low reactivity. Whereas when the g-C3N4 is modified by TiO2 to form a heterojunction structure, the photo-generated electrons in the CB of g-C3N4 can directly inject into the CB of TiO2 because the CB edge of g-C3N4 is more negative than that of TiO2. Then, the surface-adsorbed Pt2+ was reduced by transferred electrons in the CB of TiO2, and the new formed Pt nanoparticles as the efficient cocatalysts for H2 evolution were deposited on the surface of TiO2 (Fig. S5b†). Thereby the migrated electrons can accumulate on the Pt nanoparticles and participate in H2 evolution.5 Therefore, a remarkable improvement of the photocatalytic activity is achieved for the g-C3N4/TiO2 composite with Pt nanoparticles as cocatalysts.
For a better understanding of the photocatalytic reaction mechanism of the g-C3N4/TiO2 system, the charge-carriers recombination rates of the photo-excited carriers were further investigated by photoluminescence (PL) spectra under excitation wavelength of 350 nm. As shown in Fig. 10a, CNTO-0 exhibits strong PL emission peak at about 460 nm ascribing to the recombination of the photo-generated electrons and holes. In comparison to CNTO-0, a remarkable PL quenching is detected for CNTO-2, indicating that the g-C3N4/TiO2 heterostructure system indeed promotes the separation and transfer of photo-generated charges, thus greatly decrease the radiative recombination of photo-generated charge carriers. To further confirm the effect of the formation of the heterostructure, the transient photocurrent responses of CNTO-0 and CNTO-2 samples were investigated for several on–off cycles under visible light irradiation, respectively. As shown in Fig. 10b, an enhanced photocurrent for CNTO-2-Pt is generated, which is about 2.5 times higher than that of the CNTO-0-Pt sample, illustrating the increased efficiency of charge separation. Therefore, the fast charge recombination of g-C3N4 has been improved by the construction of g-C3N4/TiO2 heterostructure with Pt as cocatalyst.
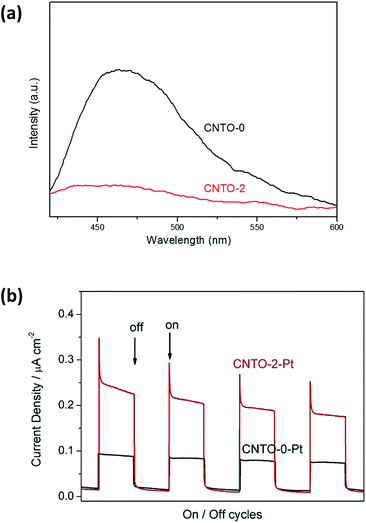 | ||
| Fig. 10 (a) PL spectra of CNTO-0 and CNTO-2 and (b) the transient photocurrent responses of CNTO-0-Pt and CNTO-2-Pt under visible-light (λ ≥ 420 nm) irradiation. | ||
Conclusions
We have developed a facile and eco-friendly route for in situ synthesis of g-C3N4/TiO2 heterojunction photocatalysts with stable interfaces and relatively large surface areas. Compared with the bare TiO2 and g-C3N4, the as-prepared g-C3N4/TiO2 composites exhibit improved photocatalytic performance for hydrogen production under visible light. The enhancement in the photocatalytic activity is mainly attributed to the following factors: (1) enlarged specific surface areas, (2) enhanced optical absorption in the visible region and (3) easy transfer and more efficient separation of photo-induced electron–hole pairs. It is believed that this work could provide an efficient way to develop more superior photocatalysts with great potential in the field of solar energy conversion.Methods
Synthesis
The pure g-C3N4 nanosheets were prepared by heating 20 g urea at 550 °C for 4 h directly, with a ramp rate of 15 °C min−1 in air. The typical experimental procedure for the synthesis of g-C3N4/TiO2 composites is illustrated in Fig. 1. 200 mg as-prepared g-C3N4 nanosheets were dispersed in 20 mL ethanol and sonicated for 1 h to afford a well dispersed homogeneous suspension. Under continuous stirring, 40 μL concentrated ammonia solution (∼28 wt%) was added to the above suspension, followed by the addition of specific amounts of tetrabutyl titanate (TBT) (0, 100, 200, 300 and 400 μL). The mixture was stirred for 12 h to realise the in situ synthesis of amorphous TiO2. After that, the solid was collected and then annealed at 460 °C in air for 2 h. The obtained product was labeled as CNTO-x (x = 0, 1, 2, 3, and 4, respectively). For comparison, the pure TiO2 was also synthesized at same condition without addition of g-C3N4.Characterization
X-ray diffraction (XRD) patterns were recorded in a PANalytical diffractometer (Model PW3040/60) X'pert PRO using monochromated Cu Kα radiation. Scanning electron microscopy (SEM) and energy dispersive X-ray spectroscopy (EDX) patterns of samples were measured by a ZEISS Sigma 500. Transmission electron microscopy (TEM) and high-resolution transmission electron microscopy (HRTEM) analyses were carried out on a JEM-2100 instrument. Fourier transform infrared (FT-IR) spectra data were taken on a Thermo Nicolet IR200. The Brunauer–Emmett–Teller (BET) surface areas of samples were determined on a Quantachrome Instruments 2SI-MP-20. X-ray photoelectron spectroscopy (XPS) measurements were performed on a Thermo Scientific Escalab 250Xi spectrometer using an Al Kα radiation excitation source. The UV-vis diffuse reflection spectra (DRS) were taken on a PerkinElmer Lambda 950. Photoluminescence (PL) spectra were detected by a Cary Eclipse fluorescence spectrometer at an excitation wavelength of 350 nm.Photocatalytic H2 evaluation
The photocatalytic H2 production experiments were performed in a 250 mL Pyrex top-irradiation reaction vessel. 50 mg of the as-prepared photocatalysts were suspended in 100 mL aqueous solution containing 10 vol% TEOA as sacrificial electron donor. 3 wt% Pt was photodeposited onto the catalysts using H2PtCl6 dissolved in the reactant solution. The reactant solution was evacuated several times to remove air completely prior to irradiation under a 300 W Xe lamp with a cut-off filter (vis, λ ≥ 420 nm). The temperature of the reactant solution was maintained at room temperature by a flow of cooling water during the reaction. The evolved gases were analyzed by gas chromatography equipped with a thermal conductive detector with argon as the carrier gas.Photoelectrochemical measurements
Photochemical measurements were performed by CHI-660E workstation (CH instruments) in a standard three-electrode system using the prepared samples as the working electrodes with an active area of ca. 1.0 cm2, Ag/AgCl electrode (immersed in saturated KCl solution) as a reference electrode, and a Pt sheet as the counter electrode. The electrolyte was 0.5 M Na2SO4 aqueous solution. Typically, the working electrodes were prepared as follows: 10 mg sample was dispersed in 0.2 mL DMF to afford slurry. The slurry was spread on to an indium-tin oxide (ITO) glass. After air-drying, the working electrode was further dried at 393 K for 2 h to improve adhesion. The light source was a 300 W Xe lamp (UV-vis) equipped with a cut-off filter (vis, λ ≥ 420 nm).Contributions
J. S. and H. Z. conceived the idea and designed the research project. H. W., X. C. and H. Z. carried out material characterization and interpreted the results. J. S., H. Z. and W. L discussed the results wrote the manuscript. All authors reviewed the manuscript.Conflicts of interest
The authors declare no competing financial interests.Acknowledgements
This work was financially supported by the Natural Science Foundation of China (No. 21373103) and the Australian Research Council Discovery Early Career Researcher Award scheme (DE140100716).References
- M. R. Gholipour, C.-T. Dinh, F. Béland and T.-O. Do, Nanoscale, 2015, 7, 8187–8208 RSC.
- K. Y. Lee, J. Chun, J. H. Lee, K. N. Kim, N. R. Kang, J. Y. Kim, M. H. Kim, K. S. Shin, M. K. Gupta and J. M. Baik, Adv. Mater., 2014, 26, 5037–5042 CrossRef CAS PubMed.
- A. Fujishima and K. Honda, Nature, 1972, 238, 37–38 CrossRef CAS PubMed.
- Z. Li, W. Luo, M. Zhang, J. Feng and Z. Zou, Energy Environ. Sci., 2013, 6, 347–370 CAS.
- K. Maeda, X. Wang, Y. Nishihara, D. Lu, M. Antonietti and K. Domen, J. Phys. Chem. C, 2009, 113, 4940–4947 CAS.
- S. Yan, Z. Li and Z. Zou, Langmuir, 2009, 25, 10397–10401 CrossRef CAS PubMed.
- G. Zhang, J. Zhang, M. Zhang and X. Wang, J. Mater. Chem., 2012, 22, 8083–8091 RSC.
- X. Wang, K. Maeda, A. Thomas, K. Takanabe, G. Xin, J. M. Carlsson, K. Domen and M. Antonietti, Nat. Mater., 2009, 8, 76–80 CrossRef CAS PubMed.
- L. Shi, F. Wang, J. Zhang and J. Sun, Ceram. Int., 2016, 42, 18116–18123 CrossRef CAS.
- L. Shi, L. Liang, F. Wang, M. Liu and J. Sun, Dalton Trans., 2016, 45, 5815–5824 RSC.
- L. Shi, L. Liang, J. Ma, F. Wang and J. Sun, Catal. Sci. Technol., 2014, 4, 758–765 CAS.
- H. Yan and H. Yang, J. Alloys Compd., 2011, 509, L26–L29 CrossRef CAS.
- J. Wang, J. Huang, H. Xie and A. Qu, Int. J. Hydrogen Energy, 2014, 39, 6354–6363 CrossRef CAS.
- J. Lei, Y. Chen, F. Shen, L. Wang, Y. Liu and J. Zhang, J. Alloys Compd., 2015, 631, 328–334 CrossRef CAS.
- W. Chen, T.-Y. Liu, T. Huang, X.-H. Liu, G.-R. Duan, X.-J. Yang and S.-M. Chen, RSC Adv., 2015, 5, 101214–101220 RSC.
- F. Raziq, C. Li, M. Humayun, Y. Qu, A. Zada, H. Yu and L. Jing, Mater. Res. Bull., 2015, 70, 494–499 CrossRef CAS.
- X. Pang, Y. Zhang, C. Liu, Y. Huang, Y. Wang, J. Pan, Q. Wei and B. Du, J. Mater. Chem. B, 2016, 4, 4612–4619 RSC.
- X. Song, Y. Hu, M. Zheng and C. Wei, Appl. Catal., B, 2016, 182, 587–597 CrossRef CAS.
- S. Matsumoto, E.-Q. Xie and F. Izumi, Diamond Relat. Mater., 1999, 8, 1175–1182 CrossRef CAS.
- F. Dong, L. Wu, Y. Sun, M. Fu, Z. Wu and S. Lee, J. Mater. Chem., 2011, 21, 15171–15174 RSC.
- C. Han, Y. Wang, Y. Lei, B. Wang, N. Wu, Q. Shi and Q. Li, Nano Res., 2015, 8, 1199–1209 CrossRef CAS.
- J. Zhang, Y. Wang, J. Jin, J. Zhang, Z. Lin, F. Huang and J. Yu, ACS Appl. Mater. Interfaces, 2013, 5, 10317–10324 CAS.
- J. Yu, S. Wang, J. Low and W. Xiao, Phys. Chem. Chem. Phys., 2013, 15, 16883–16890 RSC.
- J. Liu, T. Zhang, Z. Wang, G. Dawson and W. Chen, J. Mater. Chem., 2011, 21, 14398–14401 RSC.
- J.-G. Yu, H.-G. Yu, B. Cheng, X.-J. Zhao, J. C. Yu and W.-K. Ho, J. Phys. Chem. B, 2003, 107, 13871–13879 CrossRef CAS.
- Y. Jiang, P. Liu, Y. Chen, Z. Zhou, H. Yang, Y. Hong, F. Li, L. Ni, Y. Yan and D. H. Gregory, Appl. Surf. Sci., 2017, 391, 392–403 CrossRef CAS.
- W. Yu, D. Xu and T. Peng, J. Mater. Chem. A, 2015, 3, 19936–19947 CAS.
- S. Pany and K. Parida, Phys. Chem. Chem. Phys., 2015, 17, 8070–8077 RSC.
- B. Chai, T. Peng, J. Mao, K. Li and L. Zan, Phys. Chem. Chem. Phys., 2012, 14, 16745–16752 RSC.
- B. Sambandam, A. Surenjan, L. Philip and T. Pradeep, ACS Sustainable Chem. Eng., 2015, 3, 1321–1329 CrossRef CAS.
- X. Wei, C. Shao, X. Li, N. Lu, K. Wang, Z. Zhang and Y. Liu, Nanoscale, 2016, 8, 11034–11043 RSC.
- S. Zhou, Y. Liu, J. Li, Y. Wang, G. Jiang, Z. Zhao, D. Wang, A. Duan, J. Liu and Y. Wei, Appl. Catal., B, 2014, 158–159, 20–29 CrossRef CAS.
- Y. Hong, Y. Jiang, C. Li, W. Fan, X. Yan, M. Yan and W. Shi, Appl. Catal., B, 2016, 180, 663–673 CrossRef CAS.
- X. Bai, L. Wang, R. Zong and Y. Zhu, J. Phys. Chem. C, 2013, 117, 9952–9961 CAS.
- X. Xia, N. Deng, G. Cui, J. Xie, X. Shi, Y. Zhao, Q. Wang, W. Wang and B. Tang, Chem. Commun., 2015, 51, 10899–10902 RSC.
Footnote |
| † Electronic supplementary information (ESI) available. See DOI: 10.1039/c7ra06786k |
| This journal is © The Royal Society of Chemistry 2017 |


