 Open Access Article
Preparation and rheological properties of a stable aqueous foam system
Jiaqiang Jingab,
Jie Sun *a,
Ming Zhangc,
Chunsheng Wangc,
Xiaoqin Xiongd and
Ke Hue
aSchool of Oil & Natural Gas Engineering, Southwest Petroleum University, Chengdu 610500, China. E-mail: sunj101@163.com; jjq@swpu.edu.cn; Fax: +86 28 83032828; Tel: +86 28 83032828
bOil & Gas Fire Protection Key Laboratory of Sichuan Province, Chengdu 611731, China
cChina National Offshore Oil Corporation (CNOOC) Research Institute, Beijing 100027, China
dEngineering Technology Research Institute, Xinjiang Oilfield Company, Karamay 834000, China
eNo. 1 Oil Production Plant, Huabei Oilfield Company, Renqiu 062552, China
First published on 11th August 2017
Abstract
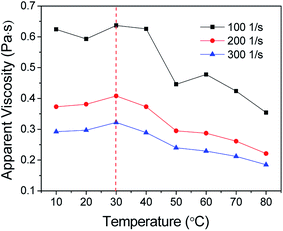
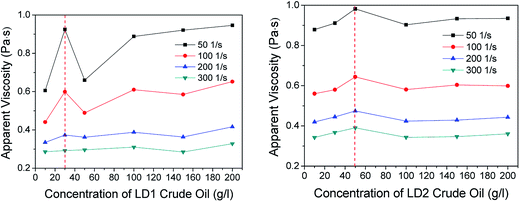
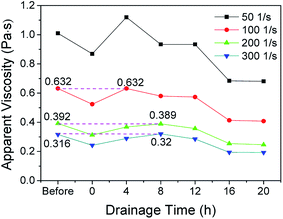
A new stable aqueous foam system was screened out by an orthogonal method and the effects of different factors on the rheological property of the foam were systematically investigated. The prepared aqueous foam has high stability. The foaming volume and half-life of 100 ml foam solution can reach 312 ml and 2274 min, respectively. The foam belongs to fine-celled foam, and the bubbles are wrapped by multilayered liquid films. The foam can maintain good stability even at high concentrations of salts and crude oil. For the foam rheology, with an increase in shear rate and salt concentration, the rheological model of the foam will change from power law model to Bingham model. Moreover, there exists optimum crude oil concentration and temperature to maximize the apparent viscosity of the foam. The apparent viscosity does not change significantly within several hours before and after foam drainage. In addition, a new wall slip correction method in foam rheology measurement is proposed.
1. Introduction
Aqueous foam is a type of gas–liquid mixed porous membrane polydisperse system. Its unique structure determines that it has several excellent characteristics such as low friction, strong carrying capacity, low density and filtration loss, which allow it to be widely used in the field of petroleum drilling,1,2 well cementing,3 profile modification,4 water shutoff,5 oil displacement6–8 and drag reduction for viscous oil pipeline transportation.9 For instance, foam with high stability can effectively prevent cuttings settlement and drilling rig sticking accident caused by accidental stopping of pump from occurring in the process of underbalanced foam drilling.2 Based on the selective plugging characteristic, the foam can also greatly improve the sweep area and displacement efficiency of oil displacement and then dramatically increase the recovery rate of remaining oil after water flooding.3 Furthermore, Jing et al. have verified the effectiveness for drag reduction on heavy oil flow bound layer using aqueous foam in laboratory experiments.9 In a word, foam plays a very important role in oil and gas industry.Stability control is the key to research and application of foam properties.10–12 It is generally believed that the evolution of foam structure involves three mechanisms: foam drainage, film rupture and bubble coarsening.13,14 However, the high temperature and high pressure conditions in the formation of wellbore, as well as the crude oil itself and salts in oil, usually exacerbate foam decay. This requires that the prepared foam should have composite properties such as oil tolerance, salt resistance and temperature resistance in practical applications. It is often difficult for single surfactants to meet the above requirements. On changing the molecular structure of surfactants or surfactants compounding, some scholars have prepared different types of aqueous foams, which have composite properties of temperature and oil tolerance or temperature and salt resistance or acid and oil tolerance.15–19 These foams are mainly applied to oil or natural gas development underground.
As a potential and promising method, aqueous foam is likely to be used for reducing the pipeline drag in heavy oil transportation at normal temperature instead of water annulus technology.9,20 Specifically, aqueous foam is injected into the space between the heavy oil and pipe wall to form foam annulus, and the isolation and lubrication action of the foam annulus or foam drainage complex layer contributes to heavy oil flow drag reduction. First and foremost, a stable oil-tolerant and salt-resistant aqueous foam system needs to be recomposed. Lai synthesized a type of oil-tolerant and salt-resistant surfactant, which contains not only hydrophilic and lipophilic groups, but also hydrophobic and hydrophobic fluorinated side chains.21 However, this system has numerous synthetic steps, complex product structure and high difficulty in separation and purification, which also make it difficult to apply this surfactant practically. There is still limited research on the study of this type of aqueous foam system and its rheological properties at present.
Herein, several oil-tolerant or salt-resistant surfactants were selected through previous studies,17,22–31 and we found that some of them have both oil and salt resistance, such as sodium lauryl polyoxyethylene ether sulfate (AES), sodium alpha-olefin sulfonate (AOS), xanthan gum (XG) and dodecanol (Dod). Based on the synergy of foaming agents and foam stabilizers, a new stable oil-tolerant and salt-resistant aqueous foam system was screened out and evaluated; moreover, the effect of different factors on the rheological properties of the foam was systematically investigated.
2. Experimental
2.1. Materials
The heavy crude oil sample, whose basic compositions and physical properties are listed in Table 1, was collected from Lvda (LD) oilfield in China. Two types of salts, NaCl with high purity (≥99.5%) and CaCl2 with a purity of over 96.0%, were bought from Chengdu Kelong Chemical Reagent Factory. Moreover, the water used in this study is tap water, which was from Chengdu water supply company. According to the company's water analysis report, the pH value and salinity are 7.32 and 132 mg l−1, respectively.| Number | Viscosity at 50 °C (mPa s) | Density at 20 °C (kg m−3) | Asphaltene (wt%) | Wax (wt%) | Resin (wt%) |
|---|---|---|---|---|---|
| LD1 | 5.40 | 847.0 | 2.09 | 20.47 | 10.71 |
| LD2 | 134.90 | 918.40 | 1.12 | 8.45 | 16.40 |
The foaming volume and foam stability of aqueous foam were directly influenced by types and concentrations of foaming agents and foam stabilizers. There are four types of common foaming agents in industrial applications, i.e. the anionic, the cationic, the non-ionic and the amphoteric. Herein, based on the evaluation results of surfactants with oil or salt resistance in previous studies, four types of anionic surfactants, two types of non-ionic and amphoteric surfactants were selected as foaming agents, and two anionic and three non-ionic surfactants were selected as foam stabilizers, which are shown in Tables 2 and 3, respectively.
| Surfactant | Code | HLB value | MW | Ionicity | Provider |
|---|---|---|---|---|---|
| Sodium benzenesulfonate | ABS | 10.6 | 346 | Anionic | Chengdu Kelong Chemical Reagent Factory |
| Sodium dodecyl sulfate | SDS | 40.0 | 288.38 | Anionic | Chengdu Kelong Chemical Reagent Factory |
| Sodium lauryl polyoxyethylene ether sulfate | AES | 16.5 | 404.23 | Anionic | Qingdao Usolf Chemical Co. Ltd. |
| Sodium alpha-olefin sulfonate | AOS | 15.4 | 195.08 | Anionic | Qingdao Usolf Chemical Co. Ltd. |
| Coconut methyl monoethanolamide | CMMEA | 7.6 | 114.57 | Nonionic | Qingdao Usolf Chemical Co. Ltd. |
| Octylphenol ethoxylate | OP-10 | 14.5 | 646 | Nonionic | Chengdu Kelong Chemical Reagent Factory |
| Cocamidopropyl hydroxy sulfobetaine | CHSB | 8.7 | 422.62 | Amphoteric | Qingdao Usolf Chemical Co. Ltd. |
| Disodium lauroamphodiacetate | LAD-40 | 14.4 | 446.49 | Amphoteric | Qingdao Usolf Chemical Co. Ltd. |
| Surfactant | Code | Main composition | MW | Ionicity | Provider |
|---|---|---|---|---|---|
| Polyacrylamide | PAM | Polyacrylamide | 3 × 10⁸ | Anionic | Chengdu Kelong Chemical Reagent Factory |
| Xanthan gum | XG | Polysaccharide polymer | 1 × 10⁷ | Anionic | Qingdao Usolf Chemical Co. Ltd. |
| Hydroxyethyl cellulose | HEC | Hydroxyethyl cellulose | 2.5 × 10⁵ | Nonionic | Chengdu Kelong Chemical Reagent Factory |
| Dodecanol | Dod | 1-Dodecanol | 186 | Nonionic | Chengdu Kelong Chemical Reagent Factory |
| SF-1 suspending agent | SF-1 | Acrylic polymer | — | Nonionic | Guangzhou Feirui Chemical Ltd. |
2.2. Apparatus
The XP-300C image analytical system (Shanghai, China) was used to capture and analyze foam micrographs. The Anton Paar Rheolab QC viscometer (Graz, Austria) and Haake Mars III (Haake, Germany) were adopted to test the rheological behaviors and viscoelasticity of foam solution and aqueous foam. The JJ2000B rotating drop interface tension measuring instrument (Shanghai, China) was used to measure the surface tension of surfactant solutions with different concentrations and the interface tension between oil and water or oil and foaming base solution. The GJ-1 homo-mixer with a maximum stirring rate of 13![[thin space (1/6-em)]](https://www.rsc.org/images/entities/char_2009.gif) 000 rpm (Jiangyin, China) was used to prepare aqueous foam. The Shangping FA2104S electronic balance with an accuracy of 1/10
000 rpm (Jiangyin, China) was used to prepare aqueous foam. The Shangping FA2104S electronic balance with an accuracy of 1/10![[thin space (1/6-em)]](https://www.rsc.org/images/entities/char_2009.gif) 000 g (Shanghai, China) was used to weigh various samples. Some measuring cylinders (500 ml, 100 ml) and pipettes (100 ml) were used to evaluate the foam performance.
000 g (Shanghai, China) was used to weigh various samples. Some measuring cylinders (500 ml, 100 ml) and pipettes (100 ml) were used to evaluate the foam performance.
2.3. Experimental procedure
Based on the Waring Blender method, 100 ml water with the required proportion of surfactants was added to a stirring cup and mixed by a glass rod evenly to obtain the foaming fluid. Then, it was stirred by the GJ-1 homo-mixer for 1 min at room temperature (about 20 °C) under normal atmospheric pressure at a speed of 4500 rpm to prepare the aqueous foam. The foam volume Vo and the foam drainage half-life t1/2 reflect the different performance indicators of the foaming agents. To evaluate the comprehensive influences on the foamability of the foaming fluid, the foam composite index (FCI) is introduced, which can be calculated using the following formula:9| FCI = 0.75Vot1/2 | (1) |
The liquid volume in foam Vl is the original volume of the foaming fluid. The foaming volume Vo is the sum of gas volume Vg and liquid volume Vl. Thus, the gas volume fraction in foam, namely foam quality Γ, can be calculated by eqn (2):
 | (2) |
3. Results and discussion
3.1. Composition of foaming solution
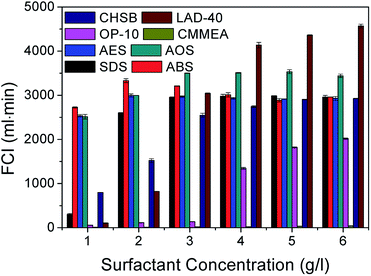
On the contrary, the foaming abilities of both the non-ionic surfactants octylphenol ethoxylate (OP-10) and coconut methyl monoethanolamide (CMMEA) are much lower than those of the above four anionic surfactants. All the FCI values for CMMEA are under 50 in the entire test surfactant concentration range. This may be due to the fact that its hydrophile–lipophile balance (HLB) value 7.6 is lower than the critical value (8) for surfactant foaming and defoaming. The smaller the HLB value, the stronger the defoaming performance. The foamability of OP-10 is poor when the surfactant concentration increases to 4 g l−1, and the prepared foam rapidly decays in a short time. This may be attributed to its high critical micelle concentration (CMC). In addition, the FCI values of the two amphoteric surfactants cocamidopropyl hydroxy sulfobetaine (CHSB) and disodium lauroamphodiacetate (LAD-40) increase with increasing concentration, but they have better foaming ability only at higher concentrations, and the prices of the amphoteric surfactants are usually much higher than those of other surfactants. To have an integrative consideration of the foaming volume, half-life and dosage of foaming agents, the four types of anionic surfactants were used as the potential foaming agents in the following experiments.
| Test number | Factor | ||||||
|---|---|---|---|---|---|---|---|
| SDS (g l−1) | ABS (g l−1) | AES (g l−1) | AOS (g l−1) | Test results | |||
| Vo (ml) | t1/2 (min) | FCI (ml min) | |||||
| 1 | 0 | 0 | 0.1 | 0.3 | 445 | 10.45 | 3488 |
| 2 | 0.1 | 0 | 0.4 | 0.4 | 452 | 9.62 | 3261 |
| 3 | 0.2 | 0 | 0.3 | 0 | 455 | 9.38 | 3201 |
| 4 | 0.3 | 0 | 0 | 0.2 | 443 | 9.75 | 3239 |
| 5 | 0.4 | 0 | 0.2 | 0.1 | 450 | 9.28 | 3132 |
| 6 | 0 | 0.1 | 0.2 | 0.2 | 455 | 9.32 | 3180 |
| 7 | 0.1 | 0.1 | 0.1 | 0.1 | 467 | 9.32 | 3194 |
| 8 | 0.2 | 0.1 | 0.4 | 0.3 | 465 | 8.90 | 3104 |
| 9 | 0.3 | 0.1 | 0.3 | 0.4 | 450 | 8.78 | 2963 |
| 10 | 0.4 | 0.1 | 0 | 0 | 445 | 8.55 | 2854 |
| 11 | 0 | 0.2 | 0 | 0.4 | 470 | 9.00 | 3173 |
| 12 | 0.1 | 0.2 | 0.2 | 0 | 470 | 8.83 | 3113 |
| 13 | 0.2 | 0.2 | 0.1 | 0.2 | 460 | 8.67 | 2991 |
| 14 | 0.3 | 0.2 | 0.4 | 0.1 | 460 | 8.53 | 2943 |
| 15 | 0.4 | 0.2 | 0.3 | 0.3 | 455 | 8.65 | 2952 |
| 16 | 0 | 0.3 | 0.3 | 0.1 | 460 | 8.60 | 2967 |
| 17 | 0.1 | 0.3 | 0 | 0.3 | 465 | 8.50 | 2964 |
| 18 | 0.2 | 0.3 | 0.2 | 0.4 | 458 | 8.50 | 2920 |
| 19 | 0.3 | 0.3 | 0.1 | 0 | 465 | 8.37 | 2919 |
| 20 | 0.4 | 0.3 | 0.4 | 0.2 | 460 | 8.32 | 2870 |
| 21 | 0 | 0.4 | 0.4 | 0 | 475 | 8.62 | 3071 |
| 22 | 0.1 | 0.4 | 0.3 | 0.2 | 460 | 8.45 | 2915 |
| 23 | 0.2 | 0.4 | 0 | 0.1 | 475 | 8.27 | 2946 |
| 24 | 0.3 | 0.4 | 0.2 | 0.3 | 465 | 8.30 | 2895 |
| 25 | 0.4 | 0.4 | 0.1 | 0.4 | 460 | 8.47 | 2922 |
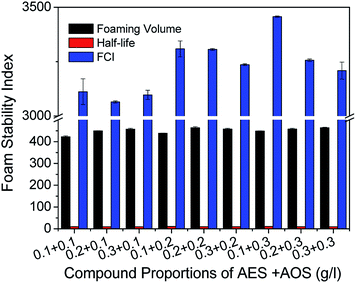
To find the most suitable foaming agent concentration for the foaming system, the foamability and stability of solutions with different compound proportions of AES and AOS were studied. As shown in Fig. 2, there are slight differences in foaming volumes at different compound proportions, but when 1 g l−1 AES and 3 g l−1 AOS were added, the average half-life and the FCI value reached a maximum of 10.28 min and 3456, respectively. Therefore, the compound concentrations of AES and AOS for preparing aqueous foam in the following experiments can be determined as 1 and 3 g l−1 and its binary solution is also called the foaming base solution.
3.2. Basic properties
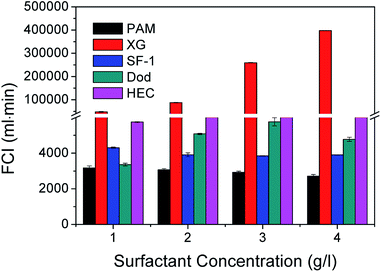
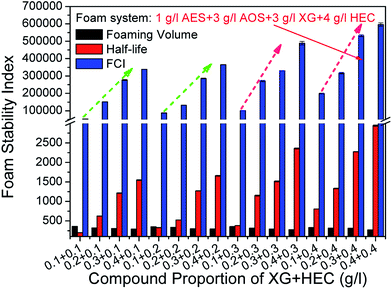
Based on the synergistic effects of foaming agents and foam stabilizers, an orthogonal combination of 1 g l−1 AES + 3 g l−1 AOS + 3 g l−1 XG + 4 g l−1 HEC was screened out as the optimum compound proportion for preparing stable aqueous foam. The molecular structures of the four surfactants are shown in Fig. 5. Their critical micelle concentrations (CMC) measured at 50 °C and 5000 rpm min−1 are 2, 3, 3 and 4 g l−1, and the corresponding surface tensions are 30.651, 28.954, 49.523 and 55.651 mN m−1, respectively. Its density is 0.3205 g cm−3 at 25 °C and normal pressure. Both rheological curves of the foaming solution and aqueous foam were measured by the CC39 test system (38.88 mm i.d., 60 mm long and 1.56 mm gap) of the Rheolab QC rheometer under a shear rate ranging from 0 to 300 s−1, which shows the rheological behavior of a non-Newtonian fluid and can be well described by the power law model. The apparent viscosities of the foaming solution and foam at 300 s−1 are 101.33 and 291.23 mPa s, respectively. The foam quality is 0.679, which is in the Mitchell quality range (between 0.5236 and 0.9999) and shows a homogenous mixture with uniform bubble sizes.32 | ||
Fig. 5 Molecular structures of the surfactants: (a) AES, R = C12–14, n = 2–3, (b) AOS, R = C14–16, (c) XG, n = 10![[thin space (1/6-em)]](https://www.rsc.org/images/entities/char_2009.gif) 718, and (d) HEC, x is the substitution degree. 718, and (d) HEC, x is the substitution degree. | ||
3.3. Salt and oil sensitivity
The prepared foam has strong oil-tolerant and salt-resistant abilities. In this study, the comprehensive performance of the foam will gradually reduce with the increase in salt concentration, but the FCI values can still remain above 50![[thin space (1/6-em)]](https://www.rsc.org/images/entities/char_2009.gif) 000 even if the concentration of sodium chloride (NaCl), sodium calcification (CaCl2) and the mixed salt (NaCl + CaCl2) increases to 100, 20 and 80 + 8 g l−1, respectively. This is because double bonds and hydroxyl groups exist in AES and AOS molecules, and they show a chelating effect on metal ions together with sulfonic acid groups; therefore, the foam system shows good salt resistance. Moreover, as the oil concentration increases, the foam FCI value first increases and then decreases gradually, i.e. the FCI value of the foam can reach a maximum with 30 g l−1 of LD1 crude oil and with 50 g l−1 of LD2 heavy oil, respectively. The corresponding half-lives of both of them can be maintained above 1200 min. This shows that the greater the viscosity of crude oil, the weaker its ability to enter the foam and spread, and the smaller the damage to the foam, which also proves the feasibility of applying the foam to the drag reduction of heavy oil transportation.
000 even if the concentration of sodium chloride (NaCl), sodium calcification (CaCl2) and the mixed salt (NaCl + CaCl2) increases to 100, 20 and 80 + 8 g l−1, respectively. This is because double bonds and hydroxyl groups exist in AES and AOS molecules, and they show a chelating effect on metal ions together with sulfonic acid groups; therefore, the foam system shows good salt resistance. Moreover, as the oil concentration increases, the foam FCI value first increases and then decreases gradually, i.e. the FCI value of the foam can reach a maximum with 30 g l−1 of LD1 crude oil and with 50 g l−1 of LD2 heavy oil, respectively. The corresponding half-lives of both of them can be maintained above 1200 min. This shows that the greater the viscosity of crude oil, the weaker its ability to enter the foam and spread, and the smaller the damage to the foam, which also proves the feasibility of applying the foam to the drag reduction of heavy oil transportation.
3.4. Microstructure
The microstructures of the aqueous foam were captured using the XP-300C image analytical system, and the micrographs under different magnifications are shown in Fig. 6. We can see that the foams are small and uniform and demonstrate dispersive spherical bubbles, which belong to fine-celled foam. Bubbles are formed by multilayered liquid films wrapping air cores. The shells of the bubbles are hard and different types of surfactants are evenly distributed in them. Owing to the existence of repulsion of surfactant molecules and Marangoni effect,33 each bubble is squeezed and repelled by other bubbles around them whether or not the bubbles contact each other. This is also the underlying cause for the stability of this foam system.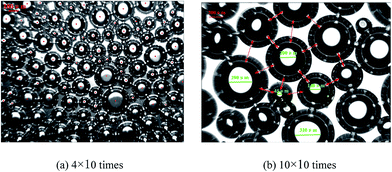 | ||
| Fig. 6 Microstructures of foam under different magnifications at 20 °C: (a) 40 times, (b) 100 times. | ||
3.5. Bubble size distribution
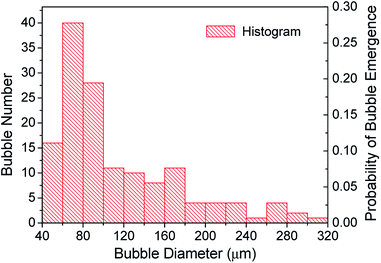
Two-dimensional diameters and areas of the bubbles in pictures were collected using the MiVnt image analysis system (144 sets of data), and then the equivalent three-dimensional average diameter and number of bubbles could be calculated (Fig. 7).34 The bubble size is in accordance with the partial normal distribution and the bubble diameter is basically between 45 and 310 μm. The liquid film thickness is equivalent to the bubble size even more than the bubble diameter. This may also be another internal factor for the good stability of the foam prepared in this study. Most of the bubbles have a diameter of about 70 μm, while the probability of bubble emergence reaches the highest value of 0.275. The total probability of bubble emergence for bubble sizes ranging from 45 to 100 μm exceeds 0.60.3.6. Rheological properties
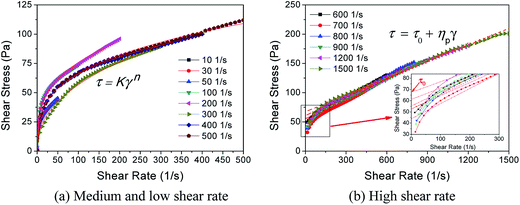 | ||
| Fig. 8 Microstructures of foam under different magnifications at 20 °C: (a) medium and low shear rate, (b) high shear rate. | ||
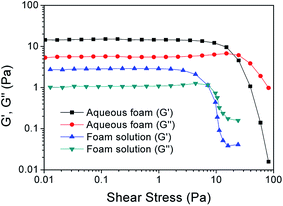
However, when the shear rate increases to 600 s−1 (critical shear rate), the rheological properties of foam change essentially. The foam demonstrates Bingham fluid at a shear rate ranging from 0–600 s−1 to 0–1500 s−1 (Fig. 8(b)). This phenomenon is similar to what Wendorff and Ainley found,35 but the critical shear rate is higher than the value they measured. With the increase in shear rate, the structural viscosity ηp gradually decreases from 125.4 to 95.0 mPa s, but the ultimate shear stress τo shows a slight increase from 55.202 to 67.352 Pa. In general, the rheological curves overlap approximately. This indicates that when the shear rate increases to a certain extent, its effect on foam rheology will reduce, and moreover, the apparent viscosities are very close at a constant shear rate, and the standard deviation is only 0.0055. Based on the constitutive equation of Bingham fluid, the apparent viscosity of the foam is mainly affected by its structural viscosity at high shear rate.
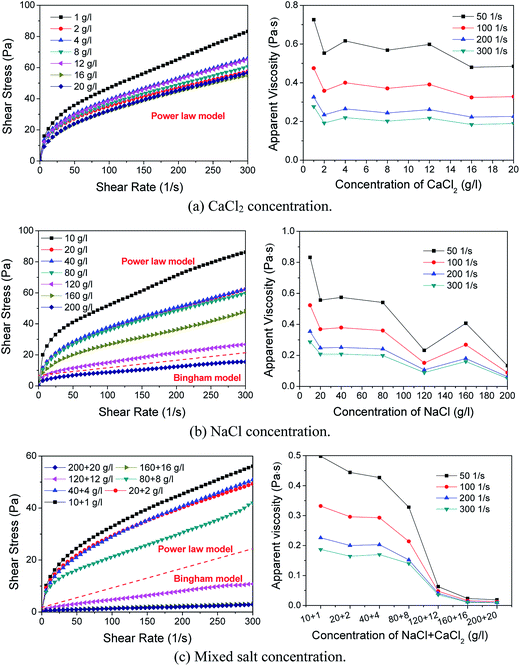 | ||
| Fig. 10 Effect of salt concentration of rheological property of foam: (a) CaCl2 concentration, (b) NaCl concentration. (c) Mixed salt concentration. | ||
Moreover, the addition of mixed salts (salinity) causes a greater impact on the foam rheological property (Fig. 10(c)). The rheological model of foam begins to change to the Bingham model even at a compound concentration of 120 + 12 g l−1 mixed salts. The apparent viscosity rapidly drops from above 140 mPa s to around 50 mPa s. This is because excessive salt content will compress the double adsorption layer of surfactant at the gas–liquid interface, which results in aggregation and precipitation of surfactants and a decrease in bubble surface tension and foam viscosity.
Considering the relationship between slip velocity and shear stress, cylinder radius and width of the annular gap simultaneously, we propose an improved wall slip correction method. The parameters of the rheometer are listed in Table 5.
| Rotor type | Ri (mm) | Ro (mm) | H (mm) | Δ (mm) | κ |
|---|---|---|---|---|---|
| a Where Ri is the outer diameter of the inner rotor, Ro is the inner diameter of outer rotor, H is the height of the inner rotor, Δ is the difference between Ro and Ri, and κ is the ratio of Ro to Ri. | |||||
| CC27 | 13.38 | 14.46 | 40.03 | 1.06 | 1.08 |
| CC39 | 19.44 | 21.00 | 60.00 | 1.56 | 1.08 |
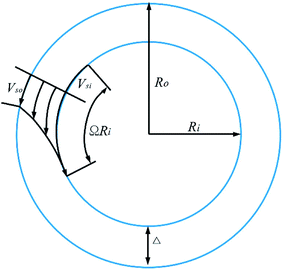
Considering the wall slip phenomenon, the coaxial viscometer geometry to be considered and the velocity profile of the foam flowing in the annular gap are shown in Fig. 14. The inner cylinder is rotated at angular velocity Ω relative to the cup.
In the rheological test system, the shear stress at the radius R of the cylinder is calculated using eqn (3) and the flow of foam in the annular gap using eqn (4).
 | (3) |
 | (4) |
The integral of eqn (4) from the inner wall to the outer wall of the cylinder can be obtained as follows:
 | (5) |
It can also be expressed as follows:
| Ω = Ωs + Ωf | (6) |
 | (7) |
Assume that the slip velocity is directly proportional to the shear stress and inversely proportional to the width of the annular gap and the radius of the rotor, i.e.
 | (8) |
This method involves two measurements taken on a Rheolab QC viscometer of difference radii but with the same ratio of cup and inner cylinder. Thus if the inner cylinders have radii of R1 and R2, the corresponding cups must have radii of κR1 and κR2 respectively, where κ is a constant. Therefore, the torques of the two test systems, T2 and T1 can satisfy the eqn (9),
 | (9) |
The stress that is produced on each cylinder can be written as follows:
 | (10) |
 | (11) |
Combining eqn (8) through (11), the real rotational angular velocity inside the aqueous foam can be derived as:
 | (12) |
According to eqn (12), the rotational angular velocity of slip elimination can be obtained and then the real shear rate can be calculated.
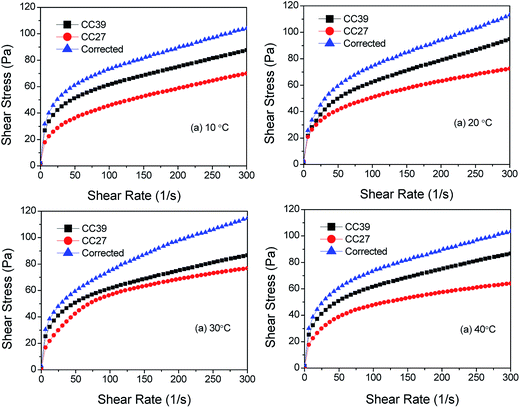
The correction results of wall slip of the foam are shown in Fig. 15. We can find that corrected shear stresses are generally higher than the values tested by the CC27 and CC39 systems, which also verifies the effectiveness of this method. Furthermore, the rheological parameters of the foam before and after wall slip correction are also listed in Table 6. The consistency coefficients increase and the flow pattern indexes decrease, respectively, at the same temperature after correction, which shows much difference from the results tested using the coaxial rotational viscometer. Therefore, much importance should be attached to this characteristic of the foam in laboratory experiments and practical applications.
| Temperature (°C) | Before correction | After correction | ||||
|---|---|---|---|---|---|---|
| CC27 | CC39 | — | ||||
| Consistency coefficient (κ) | Flow pattern index (n) | Consistency coefficient (κ) | Flow pattern index (n) | Consistency coefficient (κ) | Flow pattern index (n) | |
| 10 | 10.238 | 0.3288 | 17.289 | 0.2779 | 20.758 | 0.2758 |
| 20 | 15.485 | 0.2613 | 16.241 | 0.295 | 21.016 | 0.2775 |
| 30 | 11.485 | 0.3358 | 14.665 | 0.3224 | 19.959 | 0.2944 |
| 40 | 12.883 | 0.2806 | 15.546 | 0.2991 | 18.312 | 0.3011 |
4. Conclusions
A stable aqueous foam system was prepared with 1 g l−1 sodium lauryl polyoxyethylene ether sulfate (AES) + 3 g l−1 sodium alpha-olefin sulfonate + 3 g l−1 xanthan gum (XG) + 4 g l−1 hydroxyethyl cellulose (HEC) at 20 °C by the Waring Blender and orthogonal method. The foaming volume and half-life of 100 ml foam solution can reach 312 ml and 2274 min, respectively. The foam quality is 0.679, which is in the Mitchell quality range of foam fluid. Moreover, the prepared foam belongs to fine-celled foam and demonstrates dispersive spherical bubbles. The bubble size is in accordance with the partial normal distribution and it is mainly maintained at about 70 μm. In addition, the foam has strong oil-tolerant and salt-resistant abilities. When the concentrations of sodium chloride, calcium chloride and their mixture increase to 100, 20 and 80 + 8 g l−1, the prepared foam still has high stability. The foam demonstrates the best comprehensive performance when LD1 and LD2 crude oils reach the concentrations of 30 and 50 g l−1, respectively.The rheological property of the foam were also given much importance in this study. The foam demonstrates power law fluid at a shear rate of 500 s−1, and changes to Bingham fluid at a shear rate ranging from 0–600 s−1 to 0–1500 s−1. The apparent viscosity reaches the maximum at 30 °C. Moreover, the increase in salt concentration will essentially change the rheological model of the foam. There also exists optimum crude oil concentration to maximize the apparent viscosity of the foam. Moreover, one interesting phenomenon is that the apparent viscosity of the foam after draining for several hours can be almost equal to that of the foam before drainage. Finally, a new wall slip correction method was proposed.
Acknowledgements
This study was supported by the National Science & Technology Major Project of China (Grant No. 2016ZX05025004-005) and the Science & Technology Project of Sichuan Province (Grant No. 2015JY0099).References
- S. R. Shadizadeh and M. Zaferanieh, The Feasibility Study of Using Underbalanced Drilling in Iranian Oil Fields, 2005 Search PubMed.
- A. Saxema, A. K. Pathak and K. Ojha, Optimization of characteristic properties of foam-based drilling fluids, Braz. J. Petrol. Gas, 2014, 8(2), 57–71 CrossRef.
- D. Glosser, B. Kutchko and G. Benge, et al., Relationship between operational variables, fundamental physics and foamed cement properties in lab and field generated foamed cement slurries, J. Pet. Sci. Eng., 2016, 145, 66–76 CrossRef CAS.
- S. Li, Z. Li and B. Li, Experimental study and application of tannin foam for profile modification in cyclic steam stimulated well, J. Pet. Sci. Eng., 2014, 118(3), 88–98 CrossRef CAS.
- Q. You, Y. Wang and W. Zhang, et al., Study and application of gelled foam for in-depth water shutoff in a fractured oil reservoir, J. Can. Pet. Technol., 2009, 48(12), 51–55 CrossRef.
- Y. Zhang, Y. Wang and F. Xue, et al., CO2 foam flooding for improved oil recovery: reservoir simulation models and influencing factors, J. Pet. Sci. Eng., 2015, 133, 838–850 CrossRef CAS.
- F. Zhao, C. Lv and J. Hou, et al., Formation adaptability of combining modified starch gel and nitrogen foam in profile modification and oil displacement, J. Energy Inst., 2015, 89(4), 536–543 CrossRef.
- W. Pu, P. Wei and L. Sun, et al., Stability, CO2 sensitivity, oil tolerance and displacement efficiency of polymer enhanced foam, RSC Adv., 2017, 7, 6251–6258 RSC.
- J. Jing, N. Duan and K. Dai, et al., Investigation on drag characteristics of heavy oil flowing through horizontal pipe under the action of aqueous foam, J. Pet. Sci. Eng., 2014, 124, 83–93 CrossRef CAS.
- X. Sun, Y. Chen and J. Zhao, Highly stable aqueous foams generated by fumed silica particles hydrophobised in situ with a quaternary ammonium gemini surfactant, RSC Adv., 2016, 6(45), 38913–38918 RSC.
- R. Rafati, A. S. Haddad and H. Hamidi, Experimental study on stability and rheological properties of aqueous foam in the presence of reservoir natural solid particles, Colloids Surf., A, 2016, 509, 19–31 CrossRef CAS.
- X. Du, L. Zhao and X. He, et al., Ultra-stable aqueous foams with multilayer films stabilized by 1-dodecanol, sodium dodecyl sulfonate and polyvinyl alcohol, Chem. Eng. Sci., 2017, 160, 72–79 CrossRef CAS.
- H. Jin, Experimental study and analysis of energy evolution of liquid foam drainage in one dimension, Acta Physica Sinica -Chinese Edition, 2007, 56(10), 6124–6131 CAS.
- R. I. Saye and J. A. Sethian, Multiscale modeling of membrane rearrangement, drainage, and rupture in evolving foams, Science, 2013, 340(6133), 720–723 CrossRef CAS PubMed.
- J. Jeong, T. Kim and W. J. Cho, et al., Synthesis and decomposition performance of a polymeric foaming agent containing a sulfonyl hydrazide moiety, Polym. Int., 2013, 62(7), 1094–1100 CAS.
- L. Sun, W. Pu and J. Xin, et al., High temperature and oil tolerance of surfactant foam/polymer-surfactant foam, RSC Adv., 2015, 5(30), 23410–23418 RSC.
- L. Sun, P. Wei and W. Pu, et al., The oil recovery enhancement by nitrogen foam in high-temperature and high-salinity environments, J. Pet. Sci. Eng., 2016, 147, 485–494 CrossRef CAS.
- N. Lai, X. Zhang and Z. Ye, et al., Laboratory study of an anti-temperature and salt-resistance surfactant-polymer binary combinational flooding as EOR chemical, J. Appl. Polym. Sci., 2014, 131(6), 596–602 CrossRef.
- H. Wang, Experimental study on acid and oil resistant foam profile control agent, Petroleum & Geological Engineering, 2011, 25(1), 131–133 CAS.
- J. Sun, J. Jing and P. Jing, et al., Experimental study on drag reduction of aqueous foam on heavy oil flow boundary layer in an upward vertical pipe, J. Pet. Sci. Eng., 2016, 146, 409–417 CrossRef CAS.
- C. Lai, Research of a new foaming agent system with salt-resistance and oil-resistance, Master thesis, Sichuan University, Chengdu, China, 2007.
- M. Simjoo, T. Rezaeic and A. Andrianov, et al., Foam stability in the presence of oil: effect of surfactant concentration and oil type, Colloids Surf., A, 2013, 438, 148–158 CrossRef CAS.
- J. Sun, J. Jing and C. Wu, et al., Pipeline transport of heavy crudes as stable foamy oil, J. Ind. Eng. Chem., 2016, 44, 126–135 CrossRef CAS.
- X. Duan, J. Hou and T. Cheng, et al., Evaluation of oil-tolerant foam for enhanced oil recovery: laboratory study of a system of oil-tolerant foaming agents, J. Pet. Sci. Eng., 2014, 122, 428–438 CrossRef CAS.
- L. Ezhilarasan, Gas-condensate fields development optimization and production enhancement in the South Caspian Basin, Materials Science, 2014, 15(15), 572–581 Search PubMed.
- E. Gates, L. Hough and T. Futterer, U.S. Pat., no. 8828364, 2008.
- G. Lu, Q. Yan and C. Ge, Preparation of porous polyacrylamide hydrogels by frontal polymerization, Polym. Int., 2010, 56(8), 1016–1020 CrossRef.
- Y. Sheng, S. Lu and M. Xu, et al., Effect of xanthan gum on the performance of aqueous film-forming foam, J. Dispersion Sci. Technol., 2016, 37(11), 1664–1670 CrossRef CAS.
- Z. Chen, R. M. Ahmed and S. Z. Miska, et al., Rheology and hydraulics of polymer (HEC) based drilling foams at ambient temperature conditions, SPE J., 2005, 12(12), 100–107 Search PubMed.
- S. I. Karakashev and A. V. Nguyen, Effect of sodium dodecyl sulphate and dodecanol mixtures on foam film drainage: Examining influence of surface rheology and intermolecular forces, Colloids Surf., A, 2007, 293(1), 229–240 CrossRef CAS.
- F. Jin, S. Wang and W. Pu, et al., Emulsified oil foam for improving the flowability of heavy oil in wellbore under high salinity environments, J. Ind. Eng. Chem., 2016, 39, 153–161 CrossRef CAS.
- R. E. Blauer and C. J. Durborow, U.S. Pat., no. 3937283, 1974.
- P. Stevenson, Foam Eng., 2012, 75–89 Search PubMed.
- J. Sun, J. Jing and P. Jing, et al., Preparation and Performance Evaluation of Stable Foamy Heavy Oil, Pet. Chem., 2017, 57(3), 284–292 CrossRef CAS.
- C. L. Wendorff and B. R. Ainley. Massive hydraulic fracturing of high-temperature wells with stable frac foams, SPE 10257, 1981 Search PubMed.
- A. Yoshimura and H. R. K. Prud, Wall slip and correction for coquette and parallel disk viscometer, J. Rheol., 1988, 32, 53–67 CrossRef CAS.
| This journal is © The Royal Society of Chemistry 2017 |

