 Open Access Article
Polymer-grafted magnetic microspheres for enhanced removal of methylene blue from aqueous solutions†
Bincheng Xu ab,
Chaofan Zhengab,
Huaili Zheng*ab,
Yili Wangc,
Chun Zhaoab,
Chuanliang Zhaoab and
Shixin Zhangab
aKey Laboratory of the Three Gorges Reservoir Region's Eco-Environment, State Ministry of Education, Chongqing University, Chongqing 400045, China. E-mail: zhl@cqu.edu.cn; Fax: +86 23 65120827; Tel: +86 23 65120827
bNational Centre for International Research of Low-Carbon and Green Buildings, Chongqing University, Chongqing 400045, China
cCollege of Environmental Science and Engineering, Research Center for Water Pollution Source Control and Eco-remediation, Beijing Forestry University, Beijing 100083, China
First published on 5th October 2017
Abstract
Novel polymer-grafted magnetic microspheres (GMMs) were prepared by graft polymerization of 2-acrylamido-2-methylpropane sulfonic acid (AMPS) and acrylic acid (AA) onto the surface of chitosan/magnetite composite microspheres (MMs). The magnetic microspheres were fully characterized and then applied to the adsorption of a cationic dye (methylene blue, MB) from aqueous solutions. Results show that the adsorption capacity of GMMs was notably enhanced compared with MMs. Furthermore, the effects of initial solution pH, contact time and initial concentration on MB adsorption by GMMs were systematically investigated. The adsorption kinetics and adsorption isotherms are well described by pseudo-second-order kinetic model and Langmuir isotherm model respectively, suggesting the adsorption is a homogeneous monolayer adsorption. The maximum MB adsorption capacity by GMMs is found to be 925.9 mg g−1 at 298.15 K and initial solution pH 9.0, as determined from the Langmuir isotherm. The MB-loaded GMMs can be rapidly separated and effectively regenerated at pH 2.0.
1. Introduction
Dyes are widely used in a variety of industries, such as in textiles, foodstuffs, artificial fibers, and in the pharmaceutical and leathers industries, which poses a threat to the environment.1 Dyes in waterbodies can reduce the photosynthetic activity, thus affecting symbiotic processes.2 Moreover, most dyes have toxic effects on aquatic ecosystems and human life by creating mutagenic, carcinogenic effects and dysfunction of the organs.3 However, wastewater containing dyes is usually very difficult to treat, because most dyes are resistant to aerobic digestion and stable to light heat and oxidizing agents due to their stable and complex chemical structures, and low biodegradability.4,5 Therefore, it is urgently necessary to develop efficient techniques for the removal of dyes from wastewater before discharge.Numerous techniques are available for dye removal from wastewater, such as coagulation,6 advanced oxidation processes (AOPs),7 membrane separation8 and adsorption9 etc. Among the above techniques, adsorption is considered as a promising technique due to its comparably ease of operation, low cost, insensitivity to toxic substances and effectiveness even in dilute solutions.10 As an adsorbent for the removal of dyes from wastewater, activated carbon has been widely used due to its high adsorption capacity.11 However, its application is restricted for its high cost and difficulty of regeneration. Therefore, low-cost adsorbents such as biosorbents have been widely developed.12
Chitosan (CS) is an appealing bioadsorbent due to its biodegradability, biocompatibility, bioadhesivity, polyfunctionality, hydrophilicity and remarkable adsorption capacity.13 However, its application as adsorbent is limited by some shortcomings such as low acid stability and low mechanical strength.14 Furthermore, the adsorption performance of raw chitosan without appropriate modification is usually unsatisfactory because functional groups with large adsorption capacity for target dyes are insufficient. Therefore, various modifications such as cross-linking and grafting have been employed to improve the mechanical characteristics and adsorption properties of chitosan.15
Moreover, it is inefficient to separate chitosan-based adsorbents from treated water using traditional separation methods such as filtration and sedimentation due to the loss of adsorbents and secondary pollutions.16 To overcome these problems, chitosan-based magnetic adsorbents, which can be separated from the aqueous solutions through a simple magnetic process, have been widely developed.17 The most available method of chitosan-based magnetic adsorbents preparation is to embed Fe3O4 nanoparticles into cross-linked chitosan microspheres, namely chitosan/magnetite composite microspheres (MMs).18 In addition, to introduce more desired functional groups to MMs, low molecular weight compounds are widely grafted onto chitosan backbone.19 However, only one layer of functional groups at most are grafted onto the surface of MMs by the above methods. In order for more grafted functional groups, polymer grafting is a better choice.20 Dolatkhah A. et al. reported the fabrication of magnetic nanocomposites consisting of polymer-grafted chitosan and Fe3O4 nanoparticles for removal of methylene blue (MB) from aqueous solutions effectively, illustrating that polymer grafting makes a great contribution to the adsorption capacity of magnetic adsorbents.21
In this work, polymer-grafted magnetic microspheres (GMMs) were prepared by graft polymerization of 2-acrylamido-2-methylpropane sulfonic acid (AMPS) and acrylic acid (AA) onto the surface of MMs and then applied for the adsorption of MB from aqueous solutions. The adsorption performance including the effects of the initial solution pH, adsorption kinetics, isothermal adsorption equilibrium and reusability was investigated. Furthermore, adsorption mechanism is discussed in detail.
2. Materials and methods
2.1. Materials
Chitosan (CS, ≥95.0% deacetylation, 100–200 mPa s viscosity) was obtained from Cheng Du Micxy Chemical Co. Ltd. Ferrous chloride tetrahydrate (FeCl2·4H2O), ferric chloride hexahydrate (FeCl3·6H2O), hydrochloric acid (HCl) and sodium hydroxide (NaOH) were purchased from Chongqing Chuandong Chemical Co., Ltd. All other chemicals were purchased from Chengdu Kelong Chemical Reagent Co. Ltd. All reagents were used without further purification and Milli-Q ultrapure water (18.2 MΩ cm) was used for the preparation of aqueous solutions.2.2. Synthesis of magnetic adsorbents
2.3. Characterization
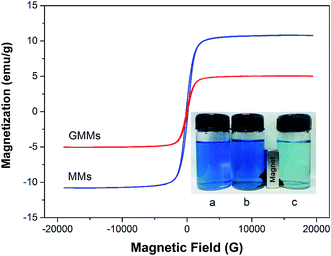
The morphology analysis was carried out on a scanning electron microscope (SEM) (S-3400N II, Hitachi, Japan). Size distribution of the microspheres was tested via a particle size analyzer (BT-9300HT, Bettersize, China). Fourier transform infrared (FTIR) spectra were recorded by a FTIR spectrometer (Nicolet iS5, Nicolet, USA) using KBr pellets. Solid-state 13C nuclear magnetic resonance (NMR) spectra with cross polarization/magic angle spinning (CP/MAS) of the samples were carried out on a Bruker AVANCE III 400 WB spectrometer equipped with a 9.39 T magnet at 297 K as described in ESI Text S2.† X-ray photoelectron spectroscopy (XPS) spectra were obtained by using a XPS spectrometer (ESCALAB250Xi, Thermo Fisher Scientific, USA). The thermal decomposition property analysis was conducted by a thermogravimetric analyzer (TGA) (STA-449F3, Netzsch, Germany). X-Ray diffraction (XRD) patterns were obtained by an X-ray diffractometer (DMAX/2C, Japan) with the CuKα radiation (k = 1.54056 Å). Magnetic property analysis was determined by a vibrating sample magnetometer (VSM) (VSM 7410, Lake Shore, USA). Zeta potential measurement was carried out on a Zetasizer Nano ZS90 (Malvern Instruments Ltd., Malvern, UK).2.4. Leaching test
Leaching of Fe from magnetic microspheres at different pHs was investigated. 0.05 g magnetic microspheres were dispersed in 50 mL water at predetermined pH. After 24 h of shaking, the concentration of Fe in water was determined by an inductively coupled plasma-optical emission spectroscopy (ICP-OES, Optima 2100 DV, Perkin-Elmer Instruments, USA).2.5. Adsorption experiments
Batch experiments were carried out using a 50 mL MB solution with a fixed mass of the adsorbent (50 mg) in a 100 mL vial. The vials were shaken at 150 rpm at predetermined temperature in a shaking incubator. Sample solutions were taken at predetermined time intervals and filtered with a 0.45 μm polytetrafluoroethylene (PTFE) syringe filter (Millipore, USA). The concentration of MB was measured using an UV-visible spectrophotometer (TU-1901, Beijing Purkinje General Instrument Co., Ltd., China) at 665 nm (wavelength absorption maximum of MB). All experiments were run in triplicate.The effects of initial solution pH on the adsorption capacity were investigated from pH 2.0 to 11.0. The initial solution pH was adjusted using 0.1 mol L−1 HCl and/or 0.1 mol L−1 NaOH solution. The initial concentration of MB solution and contact time were 1000 mg L−1 and 24 h, respectively. The equilibrium adsorption amount of MB, qe (mg g−1), was calculated according to the following equation:
 | (1) |
The adsorption kinetics experiments were performed using 1000 mg L−1 as initial concentration of MB and the initial solution pH was adjusted to 9.0. 1 mL of sample solutions were collected at desired time intervals to analyze MB concentration. The adsorption amount of dye at time ti, q(ti) (mg g−1) was calculated using the following equation:
 | (2) |
The isothermal adsorption equilibrium experiments were conducted with solutions of different initial concentrations of MB in a range of 100–1200 mg L−1. The initial solution pH was adjusted to 9.0 and the contact time was 24 h. The equilibrium adsorption amount of MB was calculated based on eqn (1).
2.6. Desorption and regeneration experiments
First, 50 mg GMMs were immersed into a 100 mL vial containing 50 mL MB solution with the initial concentration of 1000 mg L−1 and initial solution pH of 9.0. The vial was shaken for 24 h at 150 rpm at 25 °C in a shaking incubator for MB adsorption after which sample solutions were taken and measured by the same method described in Section 2.5. The MB-loaded microspheres were magnetically separated and then added into a 100 mL vial containing 50 mL of 0.01 mol L−1 HCl solution. The vial was shaken for 24 h at 150 rpm at 25 °C in a shaking incubator for MB desorption. Finally, the desorbed microspheres were collected by a magnet, washed with water repeatedly, and then subsequently reused in the next cycle of adsorption. The adsorption–desorption experiments were conducted for five cycles.3. Results and discussion
3.1. Synthesis of the adsorbents
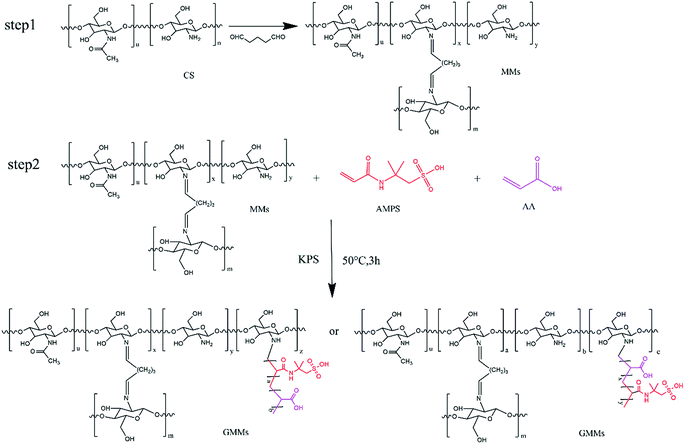
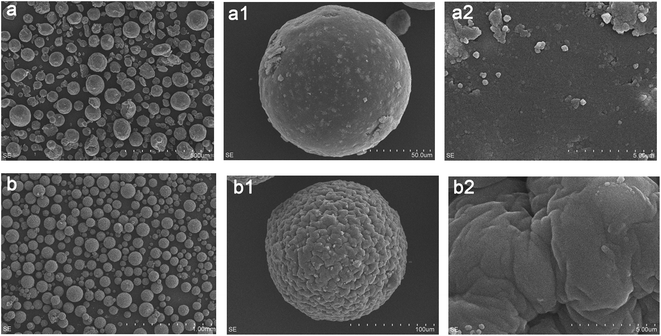
The resulting GMMs were prepared by a two-step method. In the first step, MMs were prepared by a water/oil (W/O) emulsion crosslinking technique. The W/O emulsion was prepared by adding the suspension containing chitosan and Fe3O4 nanoparticles into a dispersion medium composed of cyclohexane. Glutaraldehyde was used as a crosslinking agent. In the second step, poly(AMPS-AA) chains were grafted onto cross-linked chitosan backbone using a grafting from approach. KPS was used as an initiator to generate free sulfate radical (SO4−˙), resulting in polymerization via the amino groups. The chemical reactions of the preparation process are described in Scheme 1.3.2. Characteristics of the adsorbents
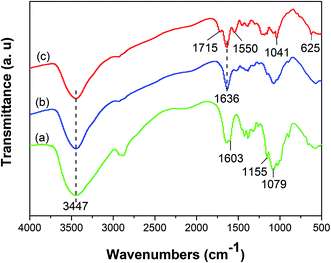
![[double bond, length as m-dash]](https://www.rsc.org/images/entities/char_e001.gif) N) that formed between amine groups of chitosan and aldehyde groups of glutaraldehyde.26 The peaks at 1715, 1550 cm−1 in the spectrum of GMMs are assigned to residual free carboxylic groups (–COOH) and carboxylate ions (–COO−) respectively, indicating the successful grafting of AA.23 Furthermore, the peaks at 1041 and 625 cm−1 in the spectrum of GMMs are attributed to the stretching vibration of S
N) that formed between amine groups of chitosan and aldehyde groups of glutaraldehyde.26 The peaks at 1715, 1550 cm−1 in the spectrum of GMMs are assigned to residual free carboxylic groups (–COOH) and carboxylate ions (–COO−) respectively, indicating the successful grafting of AA.23 Furthermore, the peaks at 1041 and 625 cm−1 in the spectrum of GMMs are attributed to the stretching vibration of S![[double bond, length as m-dash]](https://www.rsc.org/images/entities/char_e001.gif) O and S–O respectively, confirming the successful grafting of AMPS.27
O and S–O respectively, confirming the successful grafting of AMPS.27
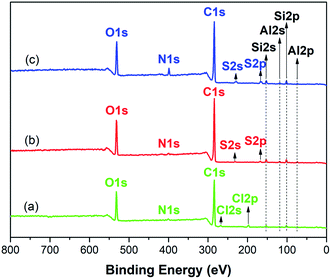
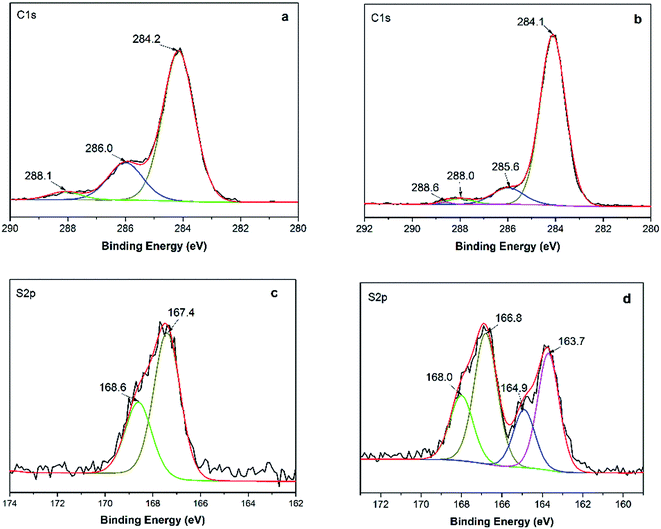
![[double bond, length as m-dash]](https://www.rsc.org/images/entities/char_e001.gif) N, C–O or C–O–C, the peak at 288.1 eV corresponding to C
N, C–O or C–O–C, the peak at 288.1 eV corresponding to C![[double bond, length as m-dash]](https://www.rsc.org/images/entities/char_e001.gif) O or O–C–O.32 For GMMs, a new peak appears at 288.6 eV attributing to O–C
O or O–C–O.32 For GMMs, a new peak appears at 288.6 eV attributing to O–C![[double bond, length as m-dash]](https://www.rsc.org/images/entities/char_e001.gif) O, indicating the successful grafting of AA.33
O, indicating the successful grafting of AA.33
3.3. Effects of initial solution pH
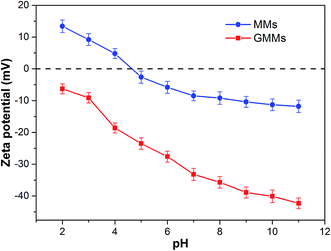
The pH value of the solution is an important factor in the adsorption process as it influences not only the conversion of the adsorbates but also the surface properties of the adsorbent and ionization/dissociation of the functional groups.39 The effects of initial solution pH on the adsorption of MB onto MMs and GMMs are illustrated in Fig. S6.† The adsorption capacity of GMMs is notably greater than that of MMs and increases with increasing solution pH. As displayed in Fig. 6, zeta potential of GMMs is less than zero due to the deprotonation of sulfonic (–SO3H) groups at pH of 2.0 (above the pKa value of AMPS = 1.5). Therefore, the noticeable adsorption capacity at pH 2.0 can be attributed to electrostatic interactions between the deprotonated sulfonic (–SO3H) groups and positively charged MB molecules. When pH is larger than the pKa of AA which is 4.2, both the carboxyl (–COOH) and sulfonic (–SO3H) groups of the grafted polymer are ionized, which significantly enhance the electrostatic interactions between MB cation and negatively charged grafted polymer. Therefore, it is suggested that electrostatic interaction is one of adsorption mechanisms for the removal of MB by GMMs.Interestingly, there is a sharp increase of adsorption capacity at the initial solution pH range from 7.0 to 10.0 where grafted polymer is completely deprotonated. Similar adsorption performance of chitosan–AMPS hydrogel toward MB was reported in previous literature.40 As seen in Fig. S7,† MB has a heteroatomic structure and it tends to form face-to-face dimers through stacking interactions to minimize their hydrophobic interactions with water.41 At high pH, MB cations start to loose positive charges, which increases their aggregation. Furthermore, the self-organization of MB aggregates is promoted by forces such as dispersion forces due to the interaction between π-systems of the MB and hydrophobic forces of the polyanion.42 The grafted polymer containing AMPS exhibit hydrophobic character due to the aliphatic branches on its pendant groups. Consequently, the hydrophobic interactions between the hydrophobic moieties of AMPS and MB aggregates are involved in MB adsorption by GMMs.
From the above, both electrostatic and hydrophobic interactions contribute to the adsorption of MB onto GMMs. Furthermore, the successful adsorption is confirmed by XPS spectra in Fig. 3. In the S 2p spectrum for GMMs (Fig. 3c), sub-bands at 167.4 and 168.6 eV correspond to 2p3/2 and 2p1/2 peaks of –SO3− groups, respectively. For the S 2p spectrum for MB-loaded GMMs (Fig. 3d), new sub-bands at 163.7 and 164.9 eV are assigned to 2p3/2 and 2p1/2 peaks of the MB adsorbed on GMMs, respectively.43
3.4. Adsorption kinetics
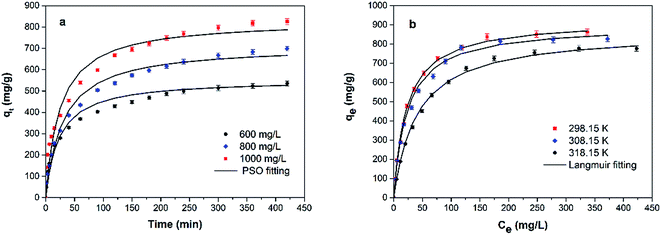
The results of the adsorption kinetics of MB adsorption onto GMMs are shown in Fig. 7a. The adsorption capacity of MB increases rapidly over the first 50 min and slows down thereafter. The initial rapid adsorption is attributed to the accessibility of the negatively charged adsorption sites on the grafted polymer. The slower adsorption is attributed to the occupancy of the adsorption sites and reduced osmotic pressure.21Three kinetic models, pseudo-first order (PFO), pseudo-second order (PSO), and intraparticle diffusion models are used to investigate the kinetics involved in the adsorption of MB by GMMs.
The PFO model assumes that the sorption rate linearly declines with the increase of adsorption capacity. The PSO model, which is usually used to describe a chemical adsorption, assumes that the rate-limiting step is the chemical interaction between the adsorbent and adsorbate.
The PFO and PSO models are expressed in nonlinear forms as eqn (3) and (4),44 respectively:
| qt = qe(1 − e−k1t) | (3) |
 | (4) |
The intraparticle diffusion, which suggests that intraparticle diffusion is the rate-limiting step in the adsorption, is described as follows:45
| qt = kpt0.5 + C | (5) |
All the experimental data were fitted by aforementioned kinetics models, and the resultant parameters were all listed in Table 1. The correlation coefficients of PSO model are much closer to 1.0 compared to those of other two models and q values calculated from PSO model are closer to those from the experiments. It confirms that chemical adsorption is the rate-controlling step and the adsorption rate depends on the concentration of MB at the surface of the adsorbent.46
| Initial concentration (mg L−1) | qmax,exp (mg g−1) | Pseudo first-order model | Pseudo second-order model | Intraparticle diffusion model | ||||||
|---|---|---|---|---|---|---|---|---|---|---|
| qe1,cal (mg g−1) | k1 × 103 (g mg−1 min−1) | R2 | qe2,cal (mg g−1) | k2 × 105 (g mg−1 min−1) | R2 | C (mg g−1) | kp | R2 | ||
| 600 | 552.3 | 353.9 | 7.81 | 0.977 | 549.7 | 8.05 | 0.996 | 132.7 | 23.19 | 0.905 |
| 800 | 730.5 | 535.4 | 8.71 | 0.988 | 727.8 | 4.53 | 0.995 | 119.8 | 32.86 | 0.934 |
| 1000 | 836.6 | 590.9 | 5.44 | 0.947 | 856.9 | 4.62 | 0.994 | 193.2 | 36.21 | 0.944 |
3.5. Adsorption isotherms
Fig. 7b depicts the isotherm results for the adsorption of MB onto GMMs at different temperatures. The obtained experimental data are analyzed based on Langmuir, Freundlich and Dubinin–Radushkevich (D–R) isotherm models, respectively.The Langmuir isotherm model is based on the assumption that the surface of the adsorbent is homogeneous and all adsorption sites are equivalent, resulting in a monolayer adsorption on a homogeneous surface. In contrast, the Freundlich isotherm model is based on the assumption that different types of adsorption sites are available on the surface, resulting in multilayer heterogeneous adsorptions.47
The Langmuir and Freundlich isotherm models can be expressed as eqn (6) and (7),48 respectively:
 | (6) |
 | (7) |
The D–R isothermal model is employed to determine the nature of the biosorption processes and can be described as follows:49
ln![[thin space (1/6-em)]](https://www.rsc.org/images/entities/char_2009.gif) qe = ln qe = ln![[thin space (1/6-em)]](https://www.rsc.org/images/entities/char_2009.gif) QD − KDε2 QD − KDε2
| (8) |
 .
.
The final simulated parameters are all listed in Table 2. The correlation coefficients of the Langmuir model are much closer to 1.0 and higher than those of other two models, suggesting that a monolayer adsorption of MB occurs onto the grafted polymer of GMMs.
| T (K) | Langmuir model | Freundlich model | D–R model | |||||||
|---|---|---|---|---|---|---|---|---|---|---|
| KL (L mg−1) | qmax (mg g−1) | RLa | R2 | KF | n | R2 | qd (mg g−1) | Kd × 107 (mol2 kJ−2) | R2 | |
| a Calculated at the MB concentration of 1000 mg L−1. | ||||||||||
| 298.15 | 0.045 | 925.9 | 0.022 | 0.999 | 99.23 | 2.35 | 0.911 | 643.6 | 2.68 | 0.676 |
| 308.15 | 0.043 | 888.9 | 0.023 | 0.997 | 96.11 | 2.41 | 0.919 | 597.3 | 2.89 | 0.698 |
| 318.15 | 0.025 | 866.6 | 0.039 | 0.998 | 64.37 | 2.18 | 0.926 | 581.8 | 9.42 | 0.678 |
Furthermore, the separation factor (RL) related to Langmuir model was applied to evaluate the feasibility of adsorption process. It can be calculated by the following equation:50
 | (9) |
The RL values of MB adsorption onto GMMs are much smaller than 1.0, indicating the favorable adsorption for MB.
Moreover, from the Langmuir isotherm model, the maximum adsorption capacity of GMMs for MB at 298.15 K and initial solution pH 9.0 is found to be 925.9 mg g−1 (shown in Table 2), which is notably higher than many other reported values for other adsorbents (shown in Table S2†).
3.6. Desorption and reusability
Reuse of adsorbents is of great importance in practical applications. Based on pH effects on the MB adsorption as discussed in section 3.3, MB-loaded GMMs would be regenerated under acidic conditions. However, Fe3O4 can dissolve out from GMMs at pH < 2.0 as illustrated in Fig. S8.† Therefore, MB-loaded GMMs were regenerated at pH 2.0 and the regenerated microspheres were reused in the next adsorption cycle. As shown in Fig. S9,† high adsorption capacity maintains over five cycles and 86.1% of the original adsorption capacity is preserved after the fifth cycle, indicating the ease of regeneration and moderate reusability of GMMs. The adsorption capacity decreases due to the fact that MB adsorbed at the bottom (near the MMs) of the grafted polymer chains are difficult to desorbed.4. Conclusions
2-Acrylamido-2-methylpropane sulfonic acid (AMPS) and acrylic acid (AA) were successfully grafted onto the surface of chitosan/magnetite composite microspheres (MMs) by surface-initiated radical polymerization. The polymer-grafted magnetic microspheres (GMMs) show notably enhanced MB adsorption capacity compared with MMs. The excellent MB adsorption is attributed to the hydrophobic and electrostatic interactions between MB cation and negatively charged polymer chains. Adsorption isotherms results suggest that a monolayer adsorption of MB occurs onto the grafted polymer of GMMs. Besides, the MB-loaded GMMs were separated from aqueous solutions quickly under an applied external field and efficiently regenerated and reused over five recycles, indicating that GMMs could be a promising adsorbent for MB removal in practical applications. Future developments would require a more detailed cost analysis of the materials and the chemical stability as part of the recycle process for these GMMs materials.Conflicts of interest
There are no conflicts of interest to declare.Acknowledgements
The authors gratefully acknowledge the financial support of the National Natural Science Foundation of China (Project No. 21677020).References
- W. Song, B. Gao, X. Xu, L. Xing, S. Han, P. Duan, W. Song and R. Jia, Bioresour. Technol., 2016, 210, 123–130 CrossRef CAS PubMed.
- A. S. Patra, S. Ghorai, S. Ghosh, B. Mandal and S. Pal, J. Hazard. Mater., 2016, 301, 127–136 CrossRef CAS PubMed.
- Markandeya, N. Dhiman, S. P. Shukla and G. C. Kisku, J. Cleaner Prod., 2017, 149, 597–606 CrossRef CAS.
- S. P. D. Monte Blanco, F. B. Scheufele, A. N. Módenes, F. R. Espinoza-Quiñones, P. Marin, A. D. Kroumov and C. E. Borba, Chem. Eng. J., 2017, 307, 466–475 CrossRef CAS.
- M.-T. Nguyen-Le and B.-K. Lee, Chem. Eng. J., 2015, 281, 20–33 CrossRef CAS.
- A. K. Verma, R. R. Dash and P. Bhunia, J. Environ. Manage., 2012, 93, 154–168 CrossRef CAS PubMed.
- S. Chakma, L. Das and V. S. Moholkar, Sep. Purif. Technol., 2015, 156, 596–607 CrossRef CAS.
- J. Guo, Q. Zhang, Z. Cai and K. Zhao, Sep. Purif. Technol., 2016, 161, 69–79 CrossRef CAS.
- M. T. Yagub, T. K. Sen, S. Afroze and H. M. Ang, Adv. Colloid Interface Sci., 2014, 209, 172–184 CrossRef CAS PubMed.
- M. Abbasi, J. Cleaner Prod., 2017, 145, 105–113 CrossRef CAS.
- H. Sayğılı and F. Güzel, J. Cleaner Prod., 2016, 113, 995–1004 CrossRef.
- V. K. Gupta and Suhas, J. Environ. Manage., 2009, 90, 2313–2342 CrossRef CAS PubMed.
- G. Crini and P.-M. Badot, Prog. Polym. Sci., 2008, 33, 399–447 CrossRef CAS.
- L. Cui, Z. Xiong, Y. Guo, Y. Liu, J. Zhao, C. Zhang and P. Zhu, Carbohydr. Polym., 2015, 132, 330–337 CrossRef CAS PubMed.
- M. Vakili, M. Rafatullah, B. Salamatinia, A. Z. Abdullah, M. H. Ibrahim, K. B. Tan, Z. Gholami and P. Amouzgar, Carbohydr. Polym., 2014, 113, 115–130 CrossRef CAS PubMed.
- Y. Ren, H. A. Abbood, F. He, H. Peng and K. Huang, Chem. Eng. J., 2013, 226, 300–311 CrossRef CAS.
- D. H. K. Reddy and S.-M. Lee, Adv. Colloid Interface Sci., 2013, 201–202, 68–93 CrossRef CAS PubMed.
- L. Zhou, Z. Liu, J. Liu and Q. Huang, Desalination, 2010, 258, 41–47 CrossRef CAS.
- K. Li, P. Li, J. Cai, S. Xiao, H. Yang and A. Li, Chemosphere, 2016, 154, 310–318 CrossRef CAS PubMed.
- K. Li, Y. Wang, M. Huang, H. Yan, H. Yang, S. Xiao and A. Li, J. Colloid Interface Sci., 2015, 455, 261–270 CrossRef CAS PubMed.
- A. Dolatkhah and L. D. Wilson, ACS Appl. Mater. Interfaces, 2016, 8, 5595–5607 CAS.
- X. Tao, K. Li, H. Yan, H. Yang and A. Li, Environ. Pollut., 2016, 209, 21–29 CrossRef CAS PubMed.
- H. Yan, H. Li, H. Yang, A. Li and R. Cheng, Chem. Eng. J., 2013, 223, 402–411 CrossRef CAS.
- S. Zhang, Y. Dong, Z. Yang, W. Yang, J. Wu and C. Dong, Chem. Eng. J., 2016, 304, 325–334 CrossRef CAS.
- X. Li, H. Zheng, Y. Wang, Y. Sun, B. Xu and C. Zhao, Chem. Eng. J., 2017, 319, 119–130 CrossRef CAS.
- Z. A. Sutirman, M. M. Sanagi, K. J. Abd Karim and W. A. Wan Ibrahim, Carbohydr. Polym., 2016, 151, 1091–1099 CrossRef CAS PubMed.
- L. Song, J. Zhao, H. Yang, J. Jin, X. Li, P. Stagnaro and J. Yin, Appl. Surf. Sci., 2011, 258, 425–430 CrossRef CAS.
- O. A. Monteiro Jr and C. Airoldi, Int. J. Biol. Macromol., 1999, 26, 119–128 CrossRef CAS.
- I. A. Udoetok, L. D. Wilson and J. V. Headley, ACS Appl. Mater. Interfaces, 2016, 8, 33197–33209 CAS.
- C. Zhang and A. J. Easteal, J. Appl. Polym. Sci., 2010, 88, 2563–2569 CrossRef.
- W. Guo, C. Gao, Q. Li, Z. Cheng and X. Qi, Environ. Prog. Sustainable Energy, 2016, 35, 833–839 CrossRef CAS.
- R. S. Vieira, M. L. M. Oliveira, E. Guibal, E. Rodríguez-Castellón and M. M. Beppu, Colloids Surf., A, 2011, 374, 108–114 CrossRef CAS.
- M. Vandenbossche, M. Jimenez, M. Casetta, S. Bellayer, A. Beaurain, S. Bourbigot and M. Traisnel, React. Funct. Polym., 2013, 73, 53–59 CrossRef CAS.
- Y. Zhao, J. Li, L. Zhao, S. Zhang, Y. Huang, X. Wu and X. Wang, Chem. Eng. J., 2014, 235, 275–283 CrossRef CAS.
- X. Liang, J. Duan, Q. Xu, X. Wei, A. Lu and L. Zhang, Chem. Eng. J., 2017, 317, 766–776 CrossRef CAS.
- L. Huang, S. Yuan, L. Lv, G. Tan, B. Liang and S. O. Pehkonen, J. Colloid Interface Sci., 2013, 405, 171–182 CrossRef CAS PubMed.
- A. Debrassi, A. F. Corrêa, T. Baccarin, N. Nedelko, A. Ślawska-Waniewska, K. Sobczak, P. Dłużewski, J.-M. Greneche and C. A. Rodrigues, Chem. Eng. J., 2012, 183, 284–293 CrossRef CAS.
- S. Zhang, Y. Zhang, J. Liu, Q. Xu, H. Xiao, X. Wang, H. Xu and J. Zhou, Chem. Eng. J., 2013, 226, 30–38 CrossRef CAS.
- X. Sun, L. Yang, Q. Li, J. Zhao, X. Li, X. Wang and H. Liu, Chem. Eng. J., 2014, 241, 175–183 CrossRef CAS.
- Y. H. Gad, Radiat. Phys. Chem., 2008, 77, 1101–1107 CrossRef CAS.
- U. Chakraborty, T. Singha, R. R. Chianelli, C. Hansda and P. Kumar Paul, J. Lumin., 2017, 187, 322–332 CrossRef CAS.
- I. Moreno-Villoslada, C. Torres, F. González, T. Shibue and H. Nishide, Macromol. Chem. Phys., 2009, 210, 1167–1175 CrossRef CAS.
- Z.-y. Zhang and X.-c. Xu, Chem. Eng. J., 2014, 256, 85–92 CrossRef CAS.
- R.-L. Tseng, P.-H. Wu, F.-C. Wu and R.-S. Juang, Chem. Eng. J., 2014, 237, 153–161 CrossRef CAS.
- S. Chatterjee, M. W. Lee and S. H. Woo, Bioresour. Technol., 2010, 101, 1800–1806 CrossRef CAS PubMed.
- S. Saber-Samandari, S. Saber-Samandari, H. Joneidi-Yekta and M. Mohseni, Chem. Eng. J., 2017, 308, 1133–1144 CrossRef CAS.
- H. Yan, H. Yang, A. Li and R. Cheng, Chem. Eng. J., 2016, 284, 1397–1405 CrossRef CAS.
- G. Z. Kyzas, D. N. Bikiaris, M. Seredych, T. J. Bandosz and E. A. Deliyanni, Bioresour. Technol., 2014, 152, 399–406 CrossRef CAS PubMed.
- J.-S. Cao, J.-X. Lin, F. Fang, M.-T. Zhang and Z.-R. Hu, Bioresour. Technol., 2014, 163, 199–205 CrossRef CAS PubMed.
- J. Fu, Z. Chen, M. Wang, S. Liu, J. Zhang, J. Zhang, R. Han and Q. Xu, Chem. Eng. J., 2015, 259, 53–61 CrossRef CAS.
Footnote |
| † Electronic supplementary information (ESI) available. See DOI: 10.1039/c7ra06810g |
| This journal is © The Royal Society of Chemistry 2017 |

