 Open Access Article
Synthesis and characterization of a biodegradable polyaspartic acid/2-amino-2-methyl-1-propanol graft copolymer and evaluation of its scale and corrosion inhibition performance
Shuchen Shia,
Yufeng Wuab,
Yueyan Wanga,
Jing Yua and
Ying Xu *ac
*ac
aCollege of Chemistry and Chemical Engineering, Henan University, Kaifeng 475004, China
bHenan Engineering Research Center of Industrial Circulating Water Treatment, Kaifeng 475004, China
cSchool of Pharmaceutical Sciences, Zhengzhou University of Industrial Technology, Zhengzhou 451150, China
First published on 25th July 2017
Abstract
Herein, a novel polyaspartic acid derivative, polyaspartic acid/2-amino-2-methyl-1-propanol graft copolymer (PASP/AMP), was synthesized via a ring-opening reaction using polysuccinimide (PSI) and 2-amino-2-methyl-1-propanol (AMP). The structure of PASP/AMP was characterized via 1H NMR and FTIR. Its scale and corrosion inhibition performances were investigated via static and weight loss tests, respectively. Additionally, its biodegradability was assessed by measuring its chemical oxygen demand. The influence of PASP/AMP on scale deposition was observed via scanning electron microscopy (SEM) and X-ray powder diffraction (XRD). The maximum scale inhibition efficiency of 100% for PASP/AMP against CaCO3, CaSO4, and Ca3(PO4)2 was achieved at the concentrations of 1, 4, and 14 mg L−1, respectively. Its corrosion inhibition efficiency for carbon steel is close to 28% at 24 mg L−1. The degradation rate of PASP/AMP could reach up to 65% within 28 days. According to the SEM images and XRD spectra, the scale deposits become irregular and distorted in shape, which can easily be dispersed by flowing water. This study demonstrates that PASP/AMP as a biodegradable inhibitor exhibits better scale and corrosion inhibition performances as compared to PASP and shows promising prospect for application.
1. Introduction
Nowadays, the consumption and pollution of water is dramatically increasing due to the rapid development of industry, which have intensified the crisis of water sources. Cooling water takes a large part of industrial water;1,2 thus, recirculating cooling water systems have been widely utilized in industrial processes to alleviate the stress of limited water supply.3,4 However, scale deposition and metal corrosion have become two major problems in the recirculation processes. Scaling and corrosion, which lead to many problems such as high maintenance costs and catastrophic accidents, occur widely in the recirculation systems.5–7 Thus, increasing attention has been focused on the utilization of water treatment agents to control scaling and corrosion.8,9 A wide variety of inhibitors such as natural polymer inhibitors, organic phosphates, polyacrylic acid, and polymethacrylic acid have been extensively explored in the past few decades.10–13 However, although they show good performances against the formation of calcium deposit or corrosion, they are unstable and easily result in water pollution, which restrict their applications.14–16 Since the permissible limits for inhibitors are decreasing due to environmental concerns, the development of non-phosphorus, efficient, green degradable inhibitors has been a current research topic.17–19Polyaspartic acid (PASP), which contains carboxyl groups, tends to combine with metal ions at different pH values, possesses good chelating ability, and has been proven to be a representative scale inhibitor.20–22 Moreover, PASP is easily degraded by microorganisms and fungi into environmentally friendly products.23 Thus, as a nontoxic and degradable green inhibitor, PASP possesses good scale inhibition ability for CaCO3 and CaSO4. However, since it only contains one functional group, carboxyl, its scale inhibition ability against Ca3(PO4)2 and corrosion inhibition properties are not prominent. For further improvement of its scale and corrosion inhibition performance, several methods have been conducted for the modification of PASP. A polyaspartic derivative, Ser-PASP, was obtained by Chen et al., which showed better scale inhibition and dispersion performance than PASP. Gao et al. synthesized PASP-SEA-ASP and found that the copolymer exhibited an outstanding corrosion inhibition performance for seawater. A PASP/urea graft copolymer was prepared by Zhang et al., and its scale inhibition performance against Ca3(PO4)2 was improved.24–26 Although these studies have improved the scale and corrosion inhibition performance of PASP to some extent, there still remains many problems such as the degradation behavior of the copolymer. To obtain a biodegradable inhibitor with outstanding comprehensive properties, it is necessary to introduce new functional groups into the side chain of PASP.27
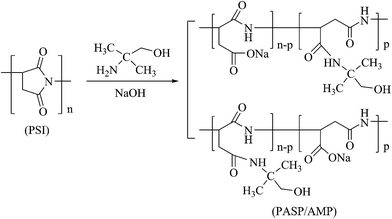
2-Amino-2-methyl-1-propanol (AMP) is a low-cost compound with an uncomplicated structure. Moreover, it contains one main functional group, hydroxy, which would contribute to improving the scale inhibition performance of PASP. In this research, a novel hydroxylation PASP derivative, polyaspartic acid/2-amino-2-methyl-1-propanol graft copolymer (PASP/AMP), was obtained via a ring-opening reaction using polysuccinimide (PSI) and AMP as raw materials. The structure of PASP/AMP was characterized via 1H NMR and FTIR. Thermogravimetric analysis was conducted to examine the stability of PASP/AMP. Static and weight loss tests were carried out to simultaneously investigate the scale and corrosion inhibition performance of PASP/AMP. Moreover, a biodegradation experiment on PASP/AMP was conducted. The structures of the scale in the absence and presence of PASP/AMP were observed via scanning electron microscopy (SEM) and X-ray powder diffraction (XRD).
2. Experimental
2.1 Reagents and instruments
Maleic anhydride, ammonium ferrous sulfate, ammonium molybdate, and antimony potassium tartrate were purchased from Kemiou Chemical Reagent Co., Ltd (China). Urea, ascorbic acid, 1,10-phenanthroline monohydrate, and ethylenediaminetetraacetic acid disodium salt were supplied by Tianjin No. 1 Chemical Reagent Factory (China). 2-Amino-2-methyl-1-propanol and Eriochrome Black T were obtained from Aladdin Chemical Reagent Co., Ltd (China).The instruments used include an AVANCE 400 nuclear magnetic resonance spectrometer (Switzerland), a VERTEX 70 Fourier transform infrared spectrometer (Germany), a 723N grating spectrophotometer (China), an RCC-III rotary coupon corrosion tester (China), an SDTA851e thermal gravimetric analyzer (Switzerland), a KDB-III COD microwave digestion instrument (China), a JSM-7610F scanning electron microscope (Japan), and a D8 Advance X-ray powder diffractometer (Germany).
2.2 Synthesis of polysuccinimide (PSI) and polyaspartic acid (PASP)
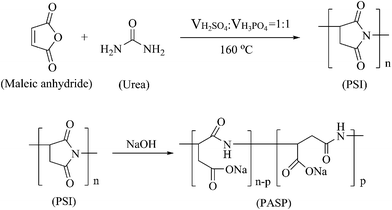
PSI and PASP were synthesized according to a previous method.28 In brief, PSI was obtained via the polycondensation of maleic anhydride and urea, which underwent a dehydration process for 3 h at 160 °C after the addition of a mixture of acids (H3PO4![[thin space (1/6-em)]](https://www.rsc.org/images/entities/char_2009.gif) :
:![[thin space (1/6-em)]](https://www.rsc.org/images/entities/char_2009.gif) H2SO4 = 1
H2SO4 = 1![[thin space (1/6-em)]](https://www.rsc.org/images/entities/char_2009.gif) :
:![[thin space (1/6-em)]](https://www.rsc.org/images/entities/char_2009.gif) 1). Then, 10% NaOH solution was added to the PSI suspension, and the reaction was carried out at 60 °C under magnetic stirring for 24 h. Subsequently, the mixture was added to absolute ethanol to generate a precipitate. Finally, after drying, PASP was obtained. The relevant synthesis reactions are illustrated in Scheme 1.
1). Then, 10% NaOH solution was added to the PSI suspension, and the reaction was carried out at 60 °C under magnetic stirring for 24 h. Subsequently, the mixture was added to absolute ethanol to generate a precipitate. Finally, after drying, PASP was obtained. The relevant synthesis reactions are illustrated in Scheme 1.
2.3 Synthesis of modified polyaspartic acid (PASP/AMP)
Herein, 0.8 g of PSI, 0.58 g AMP, 8 mL of distilled water, and 2 mL of 10% NaOH solution were mixed in a round-bottom flask. After heating at 60 °C under magnetic stirring for 24 h, the pH of the solution was adjusted to 7–8 using HCl solution. Then, the solution was poured into a beaker containing 50 mL ethanol and left standing to allow precipitation. After the supernatant was removed, 10 mL of distilled water was added. The product was dried at 80 °C in a drying oven for 12 h to yield PASP/AMP as a brown solid. The relevant synthetic reaction is shown in Scheme 2.2.4 Static test for scale inhibition efficiency
The static test, which was previously described elsewhere,29 was performed according to the Chinese National Standard (GB/T 16632-2008). The remaining Ca2+ in the supernatant was detected using an EDTA standard solution in the inhibition experiment against CaCO3 and CaSO4, whereas in the inhibition experiment against Ca3(PO4)2, the content of PO43− was determined via a 723N grating spectrophotometer at 710 nm using the phosphomolybdic blue spectrophotometric method.2.5 Weight loss test for corrosion inhibition efficiency
The weight loss test was carried out as previously described,30 which was conducted to determine the corrosion inhibition efficiency of PASP/AMP using a rotary coupon corrosion tester according to the Chinese National Standard (GB/T 18175-2014).2.6 Test for biodegradability
Herein, 100 g plant growth soil was added to 1 L distilled water and mixed. After standing for 3 h, the supernatant was obtained as the inoculation fluid. Subsequently, 1 L distilled water was subjected to an aeration process using an oil-free air pump until the dissolved oxygen content reached a value of 8 mg L−1. After this, 8.5 mg of KH2PO4, 21.8 mg of K2HPO4·3H2O, 44.6 mg of Na2HPO4·12H2O, 1.7 mg of NH4Cl, 11.0 mg of MgSO4, 27.6 mg of CaCl2, and 0.3 mg of FeCl3·6H2O were added to the aerated liquid to obtain dilution water. A certain amount of PASP/AMP, 30 mL of inoculation fluid, and 270 mL of dilution water were successively added to a 500 mL serum bottle. Then, the serum bottle was placed in a constant temperature incubator at 25 °C, and a blank experiment was carried out at the same time. Then, the COD value of the solution was determined on day 1, 7, 14, 21, and 28. The biodegradation rate (η) was calculated using the following formula:where Ct stands for the COD value in the solution containing PASP/AMP on day t and Cbt is that of the blank experiment; C0 is the original COD value of the solution containing PASP/AMP, and Cb0 is that of the blank experiment.
3. Results and discussion
3.1 1H NMR characterization of PASP/AMP
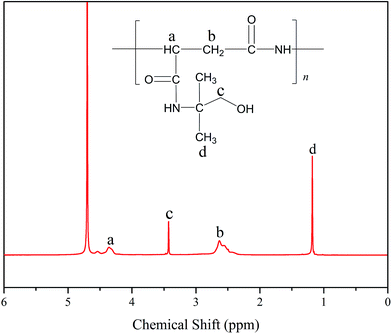
Fig. 1 displays the 1H NMR spectrum of PASP/AMP in D2O. The signals at δH = 4.36 (a) and δH = 2.63 (b) are assigned to –CH– and –CH2– on the main chain, respectively. In addition, the signals at δH = 3.47 (c) and δH = 1.18 (d) are ascribed to –CH2– and –CH3 on the side chain, respectively, which indicate the successful synthesis of the PASP/AMP graft copolymer.3.2 FTIR characterization of PASP/AMP
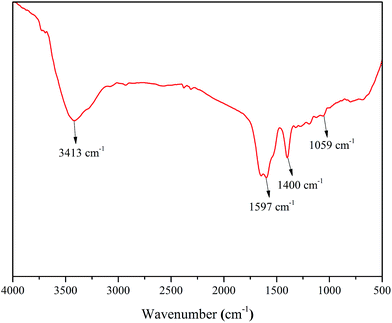
The FTIR spectrum of PASP/AMP is shown in Fig. 2. It can be seen that the characteristic absorption peak of the N–H bond stretching vibration appears at 3413 cm−1, and 1597 cm−1 is the stretching vibration absorption peak of the C![[double bond, length as m-dash]](https://www.rsc.org/images/entities/char_e001.gif) O bond of the amide; the absorption peak at 1400 cm−1 is attributed to the vibration of N–H bond bending and C–N bond stretching in –CONH, and the absorption peak at 1059 cm−1 is the characteristic absorption peak of –OH. Thus, it can be inferred that the PASP/AMP graft copolymer has been successfully synthesized.
O bond of the amide; the absorption peak at 1400 cm−1 is attributed to the vibration of N–H bond bending and C–N bond stretching in –CONH, and the absorption peak at 1059 cm−1 is the characteristic absorption peak of –OH. Thus, it can be inferred that the PASP/AMP graft copolymer has been successfully synthesized.
3.3 Thermogravimetric analysis (TGA)
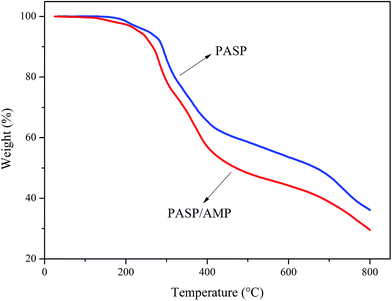
Thermogravimetric analysis was employed to examine the thermal stability of the samples in a nitrogen atmosphere. The test was conducted at 25–800 °C at a heating rate of 10 °C min−1. According to Fig. 3, PASP and PASP/AMP showed similar thermal weight loss behaviors with little mass loss below 100 °C. In the TGA thermogram of PASP/AMP, no significant reduction is observed as compared to that of PASP; this indicates that its thermal stability is as good as that of PASP. Furthermore, the thermal degradation of PASP/AMP occurred above 200 °C, indicating that it is well suited for cooling water systems.3.4 Inhibition performance against CaCO3
3.5 Inhibition performance against CaSO4
Fig. 7 displays the inhibition efficiency of PASP and PASP/AMP against CaSO4. The inhibition performance of PASP/AMP was superior to that of PASP at a concentration of 4 mg L−1. The maximum inhibition efficiency of 100% was obtained at 4 mg L−1 for PASP/AMP and 5 mg L−1 for PASP. The inhibition efficiency of PASP/AMP remained unchanged when the concentration was greater than 4 mg L−1. This may be because hydroxyl on the side chain helped PASP/AMP absorb on the nuclei surface of CaSO4, and then, the scale was wrapped, which delayed the growth of the scale.33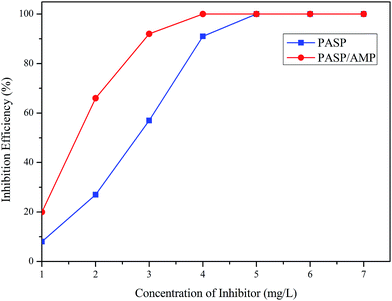 | ||
| Fig. 7 Inhibition efficiency against CaSO4 (Ca2+: 6800 mg L−1, SO42−: 7100 mg L−1, T: 70 °C, and t: 6 h). | ||
3.6 Inhibition performance against Ca3(PO4)2
The inhibition performance of PASP and PASP/AMP against Ca3(PO4)2 was investigated, as shown in Fig. 8. The inhibition efficiency of PASP/AMP gradually increased with an increase in concentration. The inhibition efficiency of PASP/AMP achieved was as high as 74% at 10 mg L−1, whereas that of PASP was only 19%. Furthermore, the inhibition efficiency of PASP/AMP reached up to 100% at 14 mg L−1, which was far greater than that of PASP. Consequently, the introduction of functional groups promoted the inhibition performance of PASP against Ca3(PO4)2.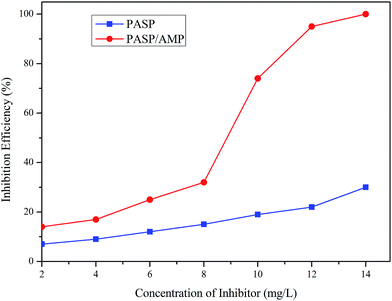 | ||
| Fig. 8 Inhibition efficiency against Ca3(PO4)2 (Ca2+: 250 mg L−1, PO43−: 10 mg L−1, T: 80 °C, and t: 10 h). | ||
3.7 Corrosion inhibition performance
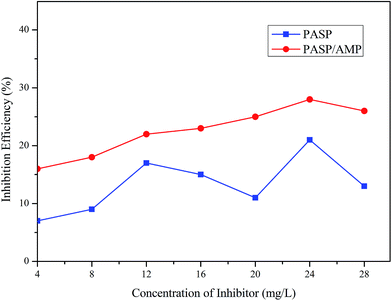
Fig. 9 demonstrates the influence of the concentration of PASP and PASP/AMP on the corrosion inhibition efficiency. It is worthy to point out that the corrosion inhibition efficiency of PASP/AMP reaches up to 28% at 24 mg L−1, whereas for PASP, the corrosion inhibition efficiency only reaches 21% at the same concentration. This was because the introduction of polar groups into the copolymer facilitated adsorption of the copolymer onto the surface of the metal, and then, the non-polar part facilitated the formation of a hydrophobic membrane, which blocked charge transfer and altered the interfacial properties.34 Furthermore, contact between the metal and corrosive substance was prevented; therefore, corrosion was effectively suppressed.3.8 Biodegradation performance
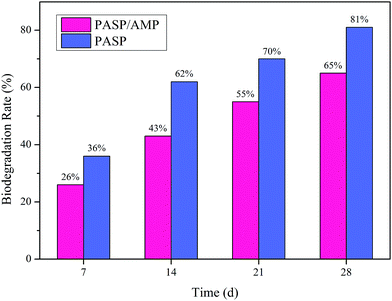
As is shown in Fig. 10, the biodegradation rate of PASP and PASP/AMP increased with time. On the 28th day, the biodegradation rate of PASP was 81%, whereas that of PASP/AMP was 65%. According to the Convention for the Protection of the Marine Environment of the North-East Atlantic, a polymer is considered readily biodegradable if its biodegradation rate is greater than 60% within 28 days.35 Therefore, PASP/AMP is eligible to be listed as a biodegradable copolymer of PASP despite the existence of functional groups on its side chain. The biodegradation behavior of PASP/AMP is lower than that of PASP. This decrease can be attributed to the presence of β-amide units or d-aspartic acid units that blocked further biodegradation, and the more irregular end group may also affect the rate.363.9 SEM analysis of CaCO3, CaSO4, and Ca3(PO4)2
The morphologies of CaCO3, CaSO4, and Ca3(PO4)2 were surveyed via SEM (Fig. 11). The CaCO3 deposit had a compact structure with a regular arrangement, and the CaSO4 crystals displayed a needle-like shape with a glossy surface in the absence of PASP/AMP. However, the structure of CaCO3 and CaSO4 became fragmented and tended to be irregular in the presence of PASP/AMP. With the addition of PASP/AMP, the structure of the Ca3(PO4)2 scale changed from dense layered to agglomerated and became looser. In other words, PASP/AMP can adsorb on the surface of the crystal and block the growth of the crystal, thus destroying the morphology of the deposit.37 As a result, the scale showed poor adhesion to the inner wall of the pipe and was easily dispersed by flowing water.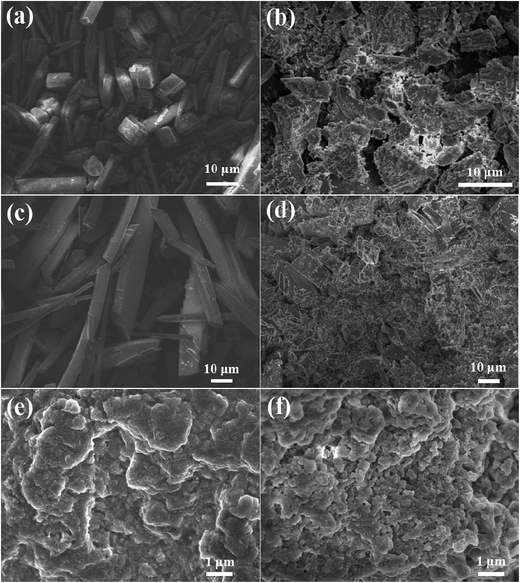 | ||
| Fig. 11 SEM images of CaCO3 (a), CaSO4 (c), and Ca3(PO4)2 (e) in the absence of PASP/AMP, and CaCO3 (b), CaSO4 (d), and Ca3(PO4)2 (f) in the presence of PASP/AMP. | ||
3.10 XRD analysis of CaCO3, CaSO4, and Ca3(PO4)2
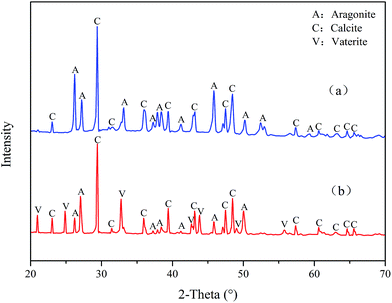
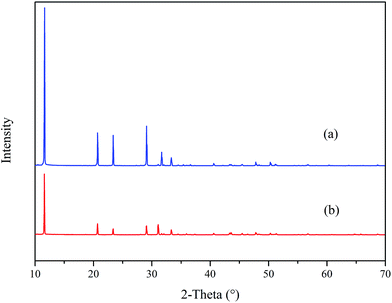
Fig. 12 reveals the XRD spectra of CaCO3 with and without PASP/AMP. In the absence of PASP/AMP, diffraction peaks at 23.07°, 29.42°, 31.47°, 36.00°, 39.42°, 43.17°, 47.51°, 48.51°, 57.42°, 60.67°, 63.09°, 64.69°, and 65.65°, belonging to calcite (PDF = 47-1743), and diffraction peaks at 26.22°, 27.22°, 33.16°, 37.28°, 37.91°, 38.42°, 41.20°, 45.86°, 50.25°, 52.49°, 53.04°, and 59.25° corresponding to aragonite (PDF = 41-1475) were obtained. However, when PASP/AMP was added, the diffraction peaks at 20.95°, 24.86°, 32.75°, 42.73°, 43.81°, 49.07°, and 55.77° for vaterite (PDF = 33-0268) were also observed in addition to those for calcite and aragonite, demonstrating that PASP/AMP affected the crystal orientation and structure of CaCO3.The XRD spectra of CaSO4 with and without PASP/AMP are shown in Fig. 13. The strong diffraction peaks at 11.54°, 20.69°, 23.36°, 29.07°, 31.08°, and 33.32° are characteristic peaks of CaSO4·2H2O (PDF = 33-0311). The diffraction peaks obviously became weaker with the addition of PASP/AMP, which indicated that the introduction of PASP/AMP contributed to the distortion of the CaSO4 precipitate morphology.
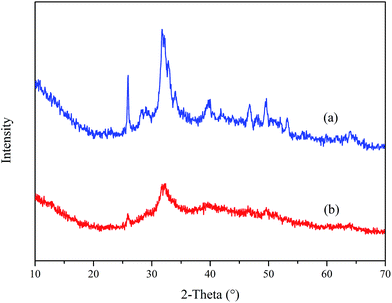
Fig. 14 displays the XRD spectra of Ca3(PO4)2 in the absence and presence of PASP/AMP. The comparison of (a) and (b) shows that they have similar characteristic peaks, but the intensity of the peaks in (a) is significantly stronger than that in (b). This phenomenon illustrates that the Ca3(PO4)2 crystal changed after the addition of PASP/AMP, and the crystallization degree of the Ca3(PO4)2 crystals was reduced. According to the XRD analysis, the addition of PASP/AMP destroyed the growth tendency and caused the scale structure to become loose, resulting in the easy removal of the precipitate.38
4. Conclusion
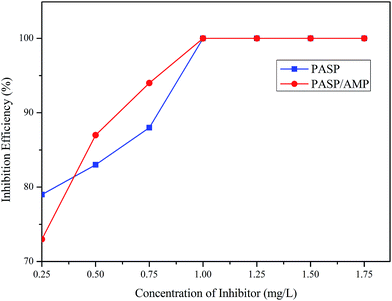
A novel PASP/AMP graft copolymer has been successfully prepared via a ring-opening reaction using PSI and AMP. The scale and corrosion inhibition performance of the PASP/AMP graft copolymer is enhanced as compared to that of PASP. PASP/AMP exhibits the maximum inhibition efficiency of 100% against CaCO3 and CaSO4 at 1 and 4 mg L−1, respectively. It is worth noting that the inhibition efficiency of PASP/AMP against Ca3(PO4)2 reaches 100% at 14 mg L−1, which compensates the limitations of PASP. The maximum corrosion inhibition efficiency of PASP/AMP reached 28% at 24 mg L−1. Moreover, the biodegradation experiment proves that PASP/AMP possesses excellent biodegradability with a biodegradation rate of 65% in 28 days, which is environmentally acceptable. Subsequently, the SEM and XRD analyses reveal that with the addition of PASP/AMP, the hard scale deposits are destroyed and transformed into loose dirt that can be removed easily. The introduction of AMP into the side chain drastically strengthened the comprehensive properties of PASP without significantly affecting its biodegradability. Thus, for further modification of PASP, the grafting of uncomplicated structures containing inhibitive functional groups will be instructive.Acknowledgements
This work was supported by the funds received from the Henan Province Science & Technology Bureau (142107000015 and 162102410086).Notes and references
- M. A. Migahed, A. A. Attia and R. E. Habib, RSC Adv., 2015, 5, 57254 RSC.
- A. Antony, J. H. Low, S. Gray, A. E. Childress and P. Le-Clech, J. Membr. Sci., 2012, 383, 1 CrossRef.
- I. Drela, P. Falewicz and S. Kuczkowska, Water Res., 1998, 32, 3188 CrossRef CAS.
- R. Touir, N. Dkhireche, M. E. Touhami, M. Sfaira and O. Senhaji, Mater. Chem. Phys., 2010, 122, 1 CrossRef CAS.
- I. Nishida, Y. Okaue and T. Yokoyama, J. Colloid Interface Sci., 2011, 360, 110 CrossRef CAS PubMed.
- P. B. Raja and M. G. Sethuraman, Mater. Lett., 2008, 62, 113 CrossRef CAS.
- V. Annibaldi, A. D. Rooney and C. B. Breslin, Corros. Sci., 2012, 59, 179 CrossRef CAS.
- H. Cheap-Charpentier, D. Gelus, N. Pécoul, H. Perrot and J. Lédion, J. Cryst. Growth, 2016, 443, 43 CrossRef CAS.
- H. H. Huang, Q. Yao, H. L. Chen and B. L. Liu, RSC Adv., 2015, 5, 92943 Search PubMed.
- D. E. Abd-El-Khalek and B. A. Abd-El-Nabey, Desalination, 2013, 311, 227 CrossRef CAS.
- M. A. Deyab, Desalination, 2016, 384, 60 CrossRef CAS.
- H. X. Zhang, F. Wang, X. H. Jin and Y. C. Zhu, Desalination, 2013, 326, 55 CrossRef CAS.
- X. H. Qiang, Z. H. Sheng and H. Zhang, Desalination, 2013, 309, 237 CrossRef CAS.
- I. Sekine, T. Shimode, M. Yuasa and K. Takaoka, Ind. Eng. Chem. Res., 1990, 29, 1460 CrossRef CAS.
- O. Horner, H. Cheap-Charpentier, X. Cachet, H. Perrot and J. Lédion, Desalination, 2017, 409, 157 CrossRef CAS.
- A. A. Younes, H. H. El-Maghrabi and H. R. Ali, J. Hazard. Mater., 2017, 334, 1 CrossRef CAS PubMed.
- Y. M. Al-Roomi, K. F. Hussain and M. Al-Rifaie, Desalination, 2015, 375, 138 CrossRef CAS.
- M. A. Deyab, J. Ind. Eng. Chem., 2015, 22, 384 CrossRef CAS.
- F. S. de Souza and A. Spinelli, Corros. Sci., 2009, 51, 642 CrossRef CAS.
- A. Ketsetzi, A. Stathoulopoulou and K. D. Demadis, Desalination, 2008, 223, 487 CrossRef CAS.
- A. Martinod, A. Neville, M. Euvrad and K. Sorbie, Chem. Eng. Sci., 2009, 64, 2413 CrossRef CAS.
- C. J. He, Z. P. Tian, B. R. Zhang, Y. Lin and X. Chen, Ind. Eng. Chem. Res., 2015, 54, 1971 CrossRef CAS.
- R. B. Fu, D. D. Wen, X. Q. Xia, W. Zhang and Y. Y. Gu, Chem. Eng. J., 2017, 316, 601 CrossRef CAS.
- J. X. Chen, L. H. Xu, J. Han, M. Su and Q. Wu, Desalination, 2015, 358, 42 CrossRef CAS.
- Y. H. Gao, L. H. Fan, L. Ward and Z. F. Liu, Desalination, 2015, 365, 220 CrossRef CAS.
- Y. Zhang, H. Q. Yin, Q. S. Zhang, Y. Z. Li and P. J. Yao, Desalination, 2016, 395, 92 CrossRef CAS.
- J. Y. Feng, L. J. Gao, R. Z. Wen, Y. Y. Deng and X. J. Wu, Desalination, 2014, 345, 72 CrossRef CAS.
- Y. Xu, L. L. Zhao, L. N. Wang, S. Y. Xu and Y. C. Cui, Desalination, 2012, 286, 285 CrossRef CAS.
- B. Zhang, D. P. Zhou, X. G. Lv, Y. Xu and Y. C. Cui, Desalination, 2013, 327, 32 CrossRef CAS.
- B. Zhang, J. Li, X. G. Lv, Y. C. Cui and Y. Xu, Desalin. Water Treat., 2015, 54, 1998 CrossRef CAS.
- B. K. Pramanik, Y. H. Gao, L. H. Fan, F. A. Roddick and Z. F. Liu, Desalination, 2017, 404, 224 CrossRef CAS.
- Y. Xu, B. Zhang, L. L. Zhao and Y. C. Cui, Desalination, 2013, 311, 156 CrossRef CAS.
- S. C. Shi, X. W. Zhao, Q. Wang, H. T. Shan and Y. Xu, RSC Adv., 2016, 6, 102406 RSC.
- M. A. Migahed, S. M. Rashwan, M. M. Kamel and R. E. Habib, J. Mol. Liq., 2016, 224, 849 CrossRef CAS.
- D. Hasson, H. Shemer and A. Sher, Ind. Eng. Chem. Res., 2011, 50, 7601 CrossRef CAS.
- T. Nakato, M. Yoshitake, K. Matsubara, M. Tomida and T. Kakuchi, Macromolecules, 1998, 31, 2107 CrossRef CAS.
- D. Liu, W. B. Dong, F. T. Li, F. Hui and J. Lédion, Desalination, 2012, 304, 1 CrossRef CAS.
- H. F. Wang, M. D. Gao, Y. Guo, Y. F. Yang and R. B. Hu, Desalination, 2016, 398, 198 CrossRef CAS.
| This journal is © The Royal Society of Chemistry 2017 |

