 Open Access Article
Creative Commons Attribution 3.0 Unported Licence
Dual-phase phosphor-in-glass based on a Sn–P–F–O ultralow-melting glass for warm white light-emitting diodes
Daqin Chen *,
Shuo Yuan,
Xinyue Li and
Wei Xu
College of Materials & Environmental Engineering, Hangzhou Dianzi University, Hangzhou, 310018, P. R. China. E-mail: dqchen@hdu.edu.cn
First published on 20th July 2017
Abstract
Herein, a novel alkaline metal fluoride-modified Sn–P–F–O ultralow-melting glass was designed to find a possible application of it as a host matrix for dispersing commercial phosphors. X-ray diffraction, differential scanning calorimetry, X-ray photoelectron spectroscopy, and Fourier transform infrared (FTIR) spectroscopy were adopted to study the related glass structure. Importantly, a dual-phase phosphor-in-glass (PiG) inorganic color converter was successfully prepared by directly co-sintering the mixture of Sn–P–F–O-based glass components, Ce3+:Y3Al5O12 yellow phosphors, and Eu2+:CaAlSiN3 red phosphors at a temperature as low as 350 °C; moreover, the yellow to red tunable luminescence was easily realized via modifying the content of the red phosphor in the glass matrix. As a consequence, warm white light-emitting devices with improved optical performances were easily achieved by combining the fabricated dual-phase PiG with an InGaN blue chip.
Introduction
Currently, phosphor-in-glass color converters, as alternatives to the traditional phosphor-in-silicone (PiS), have gained significant attention for their promising application in high-power white light-emitting diodes (WLEDs).1–14 These composites exhibit the host properties like amorphous glass and retain the optical performance of luminescent phosphors. The obtained PiG-based WLEDs show the advantage of less degradation, such as reduced lumen loss and chromaticity shift against high heat-radiation from the LED chips, than the PiS-based WLEDs. In general, a two-step procedure was adopted to fabricate PiG, including the synthesis of a low-melting precursor glass (PG) and the co-sintering of a mixture of commercial phosphors and PG powders.15 To date, SiO2-based and TeO2-based PGs have been successfully applied to disperse Ce3+:Y3Al5O12 (Ce:YAG) yellow phosphors.9,10 However, the added commercialized red phosphors, such as Eu2+:CaAlSiN3 (Eu:CASN), in these PGs usually suffer from thermal corrosion after glass-melting owing to the chemical decomposition of Eu:CASN at high co-sintering temperatures (550–600 °C).16,17 Therefore, it is highly desirable to develop a more suitable glass matrix with low-melting temperatures enabling both yellow and red commercial phosphors to disperse among the glass matrix.Sn–P–F–O glasses, showing ultralow glass transition temperatures, are widely used as sealing materials to prohibit the penetration of oxygen and moisture into electronic components.18–21 In the present study, it was found that these Sn–P–F–O glasses could be used to disperse commercial phosphors through a facile one-step low-melting method. Importantly, we investigated the influence of alkali metal flourides (MF, M = Li+, Na+, K+, and Cs+) on the Sn–P–F–O glass structure; moreover, we demonstrated the suitability of the alkali metal fluoride-modified Sn–P–F–O glass for the dispersion of both the commercial YAG:Ce3+ and CASN:Eu2+ phosphors without significantly damaging their original luminescent behaviors. In addition, the related performance of the PiG-based devices was studied.
Experimental
Preparation of Sn–P–F–O–MF-based PiG
Taking Ce:YAG PiG as a typical example, the PiG composites based on glasses with the compositions 40SnF2–30SnO–30P2O5–xMF (in mol%; M = Li, Na, K, and Cs; x = 0, 5, 10, 20, 30, 40, 50, and 60) were prepared via a facile one-step melt-quenching route. The raw materials SnF2 (99.9%), SnO (99.9%), NH4H2PO4 (99.9%), and MF (99%) were directly used without further refinement. Based on the chemical compositions, stoichiometric amounts of raw materials, mixed with 3 wt% Ce:YAG (XinLi Illuminant Co. Ltd.) and 0–2 wt% Eu:CASN commercial phosphors (XinLi Illuminant Co. Ltd.), were ground for 60 min and then put in corundum crucibles and sintered at 350–420 °C for 20 min under an ambient atmosphere. For comparison, blank glasses without the addition of commercial phosphors were also prepared via a similar procedure.Fabrication of the PiG-based WLED
As a proof-of-concept experiment, WLED devices were constructed by coupling the as-fabricated PiG with the InGaN blue chip. Opaque silica gels were filled around the edges of the WLED to avoid the leakage of blue light.Characterizations
X-ray diffraction (XRD) analysis was carried out to identify the phase structure of the as-prepared samples using a powder diffractometer (MiniFlex600 RIGAKU) with Cu Kα radiation (λ = 0.154 nm) operating at 40 kV. Differential scanning calorimetry (DSC) experiments of the samples were conducted in air at a heating rate of 10 K min−1 to understand the thermal behavior of the samples. The actual composition of the glass was detected by X-ray photoelectron spectroscopy (XPS) using a VG Scientific ESCA Lab Mark II spectrometer equipped with two ultra-high vacuum 6 (UHV) chambers. All the binding energies were referenced to the C 1s peak of the surface adventitious carbon at 284.8 eV. Fourier transform infrared (FTIR) spectra were obtained via a Perkin-Elmer IR spectrometer using the KBr pellet technique. The microstructure of PiG was investigated using a scanning electron microscope (SEM; JSM-6700F, JEOL, Ltd., Tokyo, Japan) equipped with an energy dispersive X-ray spectroscopy (EDS) system. Photoluminescence (PL) and PL excitation (PLE) spectra were obtained using an Edinburgh Instruments (Edinburgh, UK) FS5 spectrofluorometer equipped with a continuous (150 W) lamp. Time-resolved fluorospectroscopies of Ce3+ and Eu2+ emitting centers were detected using a fluorescent lifetime spectrometer (Edinburgh Instruments, LifeSpec-II) based on a time correlated single photon counting (TCSPC) technique under the excitation of 465 nm picosecond laser. Quantum yield (QY), defined as the ratio of the emitted photons to the absorbed photons, was determined by the equation , where η represents QY, Lsample represents the emission intensity, and Ereference and Esample represent the intensities of the excitation light not absorbed by the reference and the sample, respectively. The measurements were carried out using a spectrofluorometer (FS5) equipped with an integrating sphere. Photoelectric parameters, including spectral power and photon distribution of the total radiant flux of the emission spectra, color rendering index (CRI), correlated color temperature (CCT), luminous efficiency (LE), and Commission Internationale de L'Eclairage (CIE) chromaticity coordinates, were measured using a HAAS-2000 spectroradiometer (Everfine) equipped with an integrating sphere of 50 cm diameter under the forward bias of 350 mA.
Results and discussion
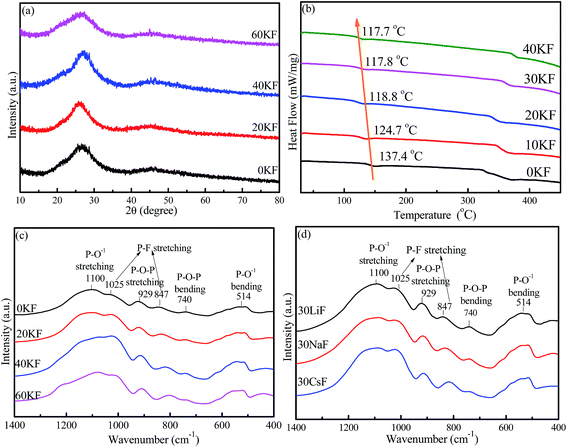
XRD patterns of the as-synthesized 40SnF2–30SnO–30P2O5–xKF (x = 0, 20, 40, and 60) glasses are depicted in Fig. 1a. There was no crystalline phase detected from XRD, indicating that all the as-prepared samples were amorphous glasses regardless of the compositions. Importantly, with the increase of the KF content, glass transition temperature (Tg) decreased from 137.4 °C to 117.7 °C, as evidenced in the DSC curves (Fig. 1b). Similar results can be found when other alkaline metal fluorides, such as LiF, NaF, and CsF, are introduced into the Sn–P–F–O glasses. FTIR spectra were obtained to study the modification of the glass structure upon the addition of alkaline metal fluorides, as shown in Fig. 1c and d. The bands at 740 cm−1 and 929 cm−1 were assigned to P–O–P (bridging oxygen) bending and stretching vibrations, respectively.18 The bands at 847 cm−1 and 1025 cm−1 were attributed to the P–F stretching vibrations of the [PO4−xFx] tetrahedral structures.21 The enhanced P–F vibrations relative to the P–O–P vibrations with the increase of MF content indicates that more F− ions enter into [PO4] to form the [PO4−xFx] tetrahedron (Fig. 1c and d). The bands at 514 cm−1 and 1100 cm−1 originated from P–O1− (non-bridging oxygen) bending and stretching vibrations, respectively.21 Notably, the signal of P–O1− is far stronger than that of P–O–P; this suggests the existence of large amounts of non-bridging oxygen in the Sn–P–F–O–MF glasses.Furthermore, XPS measurements were performed to identify glass components as well as analyze their chemical valence/environment. Intense Sn, P, F, K, and O signals are clearly observed in the XPS full survey spectrum (Fig. 2a). Notably, the C impurity peak is originated from the backing material (i.e., adhesive tap) for the investigated sample. The high-resolution XPS spectrum of P 2p3/2 shows a peak with a binding energy of 135.5 eV, assigned to the glass network P within the [PO4] and [PO4−xFx] groups.22 The peak at 531.2 eV for the O 1s XPS spectrum can originate from both bridging oxygen (P–O–P) and non-bridging oxygen (P–O–Sn).22 The F 1s XPS spectrum exhibits two peaks, assigned to the covalent F–P bond and the ionic F–Sn/F–K bonds.23 Notably, the intensity of the F–P peak is far higher than that of the F–Sn/F–K peak; this indicates a low glass transition temperature for the Sn–P–F–O glasses. The Sn 3d XPS spectrum shows two peaks located at 486.7 eV and 495.1 eV, which can be attributed to 3d5/2 and 3d3/2 of Sn2+ in glass, respectively.24 Accordingly, the Sn–P–F–O–MF glass structure can be proposed as follows. The [PO4] and [PO4−xFx] tetrahedron consists of a glass network, and some Sn2+ ions can incorporate into the glass network by replacing P, and other Sn2+ ions act as modifiers. With the addition of MF, M will locate in the interstices of the glass framework to ensure electroneutrality, and F will substitute O to form more [PO4−xFx] groups. This structural modification will eventually induce more non-bridging oxygen atoms and thus lower the glass tightness and glass transition temperature, being beneficial to dispersing commercial phosphors in the designed glasses.
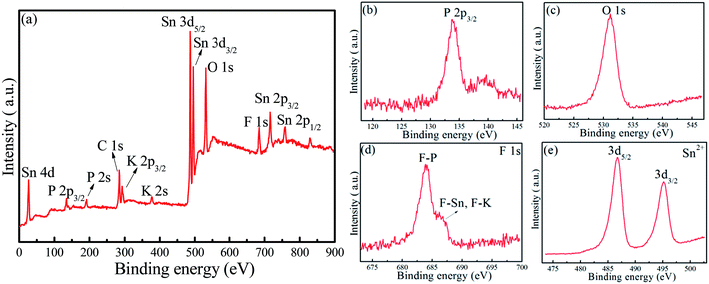 | ||
| Fig. 2 (a) XPS full survey, high-resolution XPS spectra of (b) P 2p, (c) O 1s, (d) F 1s, and (e) Sn 3d in a representative glass with the composition of 40SnF2–30SnO–30P2O5–30KF. | ||
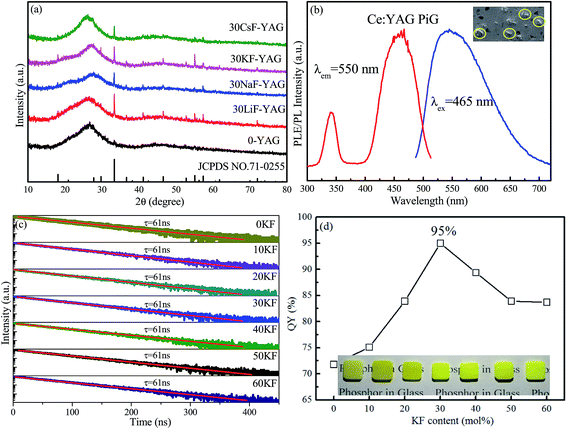
Traditionally, two steps are involved in the fabrication of PiG: synthesis of a low-melting-temperature precursor glass and co-sintering of the mixture of phosphors and mother glass frits at a temperature as low as possible.25,26 Herein, due to the ultralow melting temperature of the alkaline metal fluoride-modified Sn–P–F–O based glass, PiG can actually be prepared via a facile one-step route, i.e., via directly co-sintering the mixture of Sn–P–F–O-based glass components and Ce:YAG phosphors to form the designed PiG at a temperature as low as 350 °C. As revealed in the XRD patterns (Fig. 3a), YAG diffraction peaks are observable for all the products, suggesting the successful preparation of Ce:YAG-embedded PiGs. Importantly, the diffraction signals of YAG crystals in the PiG prepared from MF-modified Sn–P–F–O glasses are far stronger than of those in PiG-based on Sn–P–F–O glass since the addition of MF can obviously lower the glass tightness and lower glass transition temperature and thus reduce the erosion of Ce:YAG against glass melting. PL and PLE spectra of a representative PiG sample are shown in Fig. 3b. The PL spectrum shows a typical Ce3+: 5d → 4f broadband emission centered at 555 nm under 465 nm blue light excitation, similar to the case of the Ce:YAG powder.27 The PLE spectrum exhibits two excitation bands centered at 340 and 465 nm, originating from the 4f → 5d transition of Ce3+. The SEM image evidences the homogeneous distribution of Ce:YAG particles among the glass matrix for the as-prepared PiG (inset of Fig. 3b).
Furthermore, the influence of the KF content on the optical performance of PiGs was investigated, as shown in Fig. 3c and d. As expected, Ce:YAG PiG shows a single-exponential decay and the fitting yields a decay time of ∼60 ns. The lifetime of the order of a nanosecond is one of the characteristics of Ce3+ electric-dipole allowed 5d–4f transition. With the increase of the KF content, the lifetime is not obviously affected (Fig. 3c) since it is an intrinsic feature of the Ce:YAG phosphor in PiG. However, the QY of PiG was found to be highly dependent on the KF content. As demonstrated in Fig. 3d, the PL QY for the investigated Ce:YAG PiG is monotonously enhanced with the increase of KF content and reaches a maximum as high as 95% at 30 mol% KF, approaching the value of the Ce:YAG commercial phosphor (97%). Further increase in the KF content will result in the decline of PL QY of the PiG samples. Generally, the degradation of commercial phosphors in glass is due to thermal corrosion via glass-melting during high-temperature co-sintering. The retained high QY of Ce:YAG PiG is believed to benefit from the low co-sintering temperature (as low as 350–420 °C) for the designed Sn–P–F–O glass. Images of the PiG samples, fabricated with the addition of increased KF content, with a thickness of 1.0 mm are provided in the inset of Fig. 3d. All the samples exhibit a yellow color, and increase in the KF content will make the apparent color lighter. Notably, when the KF content exceeds 30%, the obtained PiG is highly hydrophilic and deliquescent, inducing an obvious decrease of PL QY (Fig. 3d). In fact, similar results can be found when LiF, NaF, and CsF are used to replace KF in PiGs. On comprehensively evaluating the measured QY and stability of the PiG samples, 40SnF2–30SnO–30P2O5–30KF glass was regarded as the most appropriate host for dispersing commercial phosphors and thus was adopted in the following experiments.
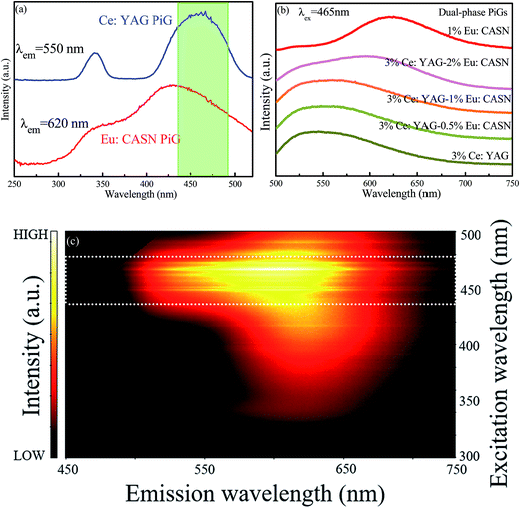
In a further experiment, Ce:YAG single-phase-embedded PiG, Eu:CASN single-phase-embedded PiG, and Ce:YAG/Eu:CASN dual-phase-embedded PiGs were successfully prepared, and their optical performance was investigated. PLE spectra of Ce:YAG PiG and Eu:CASN PiG are shown in Fig. 4a. Evidently, the excitation spectra of Ce:YAG PiG and Eu:CASN PiG have a wide overlap in the blue wavelength range; this indicates that the as-prepared Ce:YAG and Eu:CASN dual-phase PiG should be a promising inorganic color converter to be applied in blue-light-excitable WLEDs. PL spectra of Ce:YAG PiG, Eu:CASN PiG, and the related dual-phase PiGs are presented in Fig. 4b. The typical yellow broadband emission assigned to the Ce3+ d → f transition and the red emission originating from the Eu2+ d → f transition are observed for the Ce:YAG single-phase PiG and Eu:CASN single-phase PiG, respectively, similar to the cases of Ce:YAG and Eu:CASN commercial phosphors, respectively. These results confirm the successful incorporation of Ce:YAG and Eu:CASN phosphors into the alkaline metal fluoride-modified Sn–P–F–O glass. As demonstrated in Fig. 4b, all the dual-phase PiGs show bright yellow-orange luminescence, and the red component of Eu2+ is superimposed on the Ce3+ emission band. Impressively, the red to yellow emission ratio is gradually enhanced with the increase of red phosphor content from 0 to 2 wt%. Additionally, emission–excitation mapping of dual-phase PiG was obtained to find out the suitable input light wavelength to simultaneously excite yellow and red phosphors, as shown in Fig. 4c. As expected, both intense Ce3+ yellow emission and bright Eu2+ red emission can be realized in the excitation spectral range from 440 to 480 nm; this confirms that the present dual-phase PiG color converter is suitable to be encapsulated in an InGaN-based blue chip to achieve warm white-light emitting diodes.
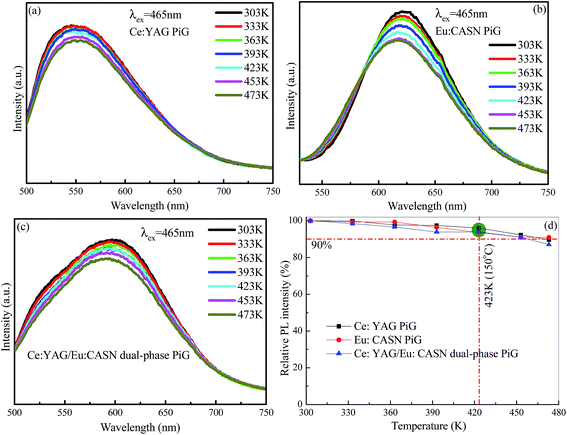
Generally, heat radiation from the blue chip can increase the temperature of high-power WLED as high as 423 K (150 °C). Therefore, it is necessary that the color converters used in the device should exhibit excellent thermal stability. Herein, the luminescent thermal-quenching behaviors of the Ce:YAG PiG, Eu:CASN PiG, and Ce:YAG/Eu:CASN PiG samples were investigated. When temperature increased from 303 K to 473 K, the emission profiles were not obviously changed, and the emission intensities slightly decreased owing to thermal-induced non-radiative relaxation (Fig. 5a–c). Importantly, the emission intensities remained above 90% of the original intensities for all three samples when the temperature was set to 423 K (Fig. 5d), verifying their promising application as color converters in high-power WLEDs.
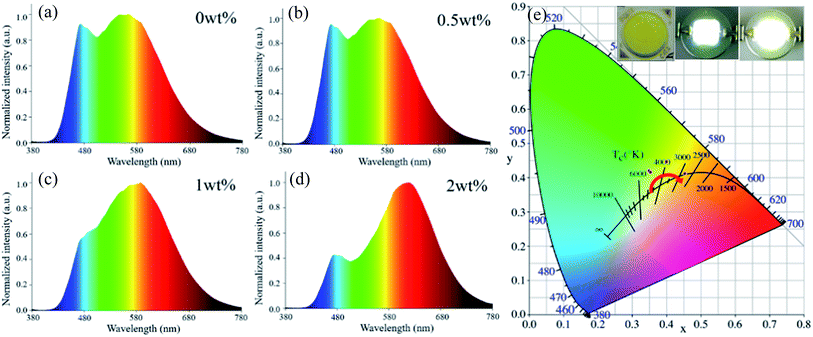
As a proof-of-concept experiment, the WLED device was fabricated by coating the prepared PiG color converter directly on the InGaN blue chip (inset of Fig. 6). Under an operating current of 20 mA, the devices can produce bright white light (inset of Fig. 6). As shown in Fig. 6a–d, the electroluminescence (EL) spectra of dual-phase PiG-based WLEDs clearly exhibit a blue emission band originating from the InGaN-based chip, a broad yellow emission band ascribed to the Ce3+: d → f transition of the Ce:YAG phosphor, and an extra red emission band corresponding to the Eu2+: d → f transition of the Eu:CASN phosphor. As the Eu:CASN phosphor content increases from 0 to 2 wt%, the red emission component related to the yellow one is significantly enhanced, the color coordinate of WLED gradually shifts from white to orange (Fig. 6e and Table 1), the CCT monotonously decreases from 5062 K to 2808 K (Table 1), the CRI is improved to 88.7 (Table 1), and the LE is in the range of 65–80 lm W−1. Evidently, the emission of the LED device changes from cold white light to warm white light with the addition of Eu:CASN into PiG (inset of Fig. 6c). All these results verify the suitability of the present dual-phase PiGs as color converters to improve the optical performance of WLEDs.
| Eu:CASN (wt%) | CCT (K) | CRI | Chromaticity coordinates |
|---|---|---|---|
| 0 | 5062 | 73.6 | (0.3489, 0.4202) |
| 0.5 | 4940 | 75.3 | (0.3531, 0.4164) |
| 1 | 4000 | 76.5 | (0.3994, 0.4468) |
| 2 | 2808 | 87.7 | (0.4529, 0.4116) |
Conclusions
In summary, Ce:YAG and Eu:CASN dual-phase phosphor-in-glass color converter based on alkaline metal fluoride-modified Sn–P–F–O ultralow-melting glass was successfully fabricated by a facile one-step route. The introduction of alkaline metal fluoride into Sn–P–F–O glass will induce more non-bridging oxygen and thus lower the glass tightness and glass transition temperature, being beneficial to reduce the erosion of commercial phosphors against glass melting. Under blue light (440–480 nm) excitation, the obtained dual-phase PiGs exhibited yellow-red tunable luminescence via simple control of the red to yellow phosphor ratio. Finally, the dual-phase PiG-based WLED was constructed to verify its suitability for improving the correlated color temperature and the color rendering index of the device.Acknowledgements
This research was supported by the Zhejiang Provincial Natural Science Foundation of China (LR15E020001), National Natural Science Foundation of China (51572065 and 61372025), and 151 talent's projects in the second level of Zhejiang Province.References
- H. Segawa, S. Ogata, N. Hirosak, T. Shimizu, M. Tansho, S. Ohki and K. Deguchi, Opt. Mater., 2010, 32, 170 CrossRef.
- Y. K. Lee, J. S. Lee, J. Heo, W. B. Im and W. J. Chung, Opt. Lett., 2012, 37, 3276 CrossRef CAS PubMed.
- J. K. Lee, S. Unithrattil, S. Kim, J. J. Lee, H. Lee and W. B. Im, Opt. Lett., 2013, 38, 3298 CrossRef CAS PubMed.
- L. Yang, M. Chen, Z. Lv, S. Wang, X. Liu and S. Liu, Opt. Lett., 2013, 38, 2240 CrossRef CAS PubMed.
- J. K. Lee, P. Arunkumar, S. Kim, I. J. Lee, H. Lee and W. B. Im, Opt. Lett., 2014, 39, 762 CrossRef CAS PubMed.
- J. Wang, C. C. Tsai, W. C. Cheng, M. H. Chen, C. H. Chung and W. H. Cheng, IEEE J. Sel. Top. Quantum Electron., 2011, 17, 741 CrossRef CAS.
- C. Tsai, W. C. Cheng, J. K. Chang, L. Y. Chen, J. H. Chen, Y. C. Hsu and W. H. Cheng, J. Disp. Technol., 2013, 9, 427 CrossRef CAS.
- L. Y. Chen, W. C. Cheng, C. C. Tsai, Y. C. Huang, Y. S. Lin and W. H. Cheng, Opt. Mater. Express, 2014, 4, 121 CrossRef.
- L. Y. Chen, W. C. Cheng, C. C. Tsai, J. K. Chang, Y. C. Huang, J. C. Huang and W. H. Cheng, Opt. Express, 2014, 22, A671 CrossRef CAS PubMed.
- R. Zhang, H. Lin, Y. L. Yu, D. Q. Chen, J. Xu and Y. S. Wang, Laser Photonics Rev., 2014, 8, 158 CrossRef CAS.
- X. J. Zhang, J. B. Yu, J. Wang, B. F. Lei, Y. L. Liu, Y. J. Cho, R. J. Xie, H. W. Zhang, Y. R. Li, Z. F. Tian, Y. Li and Q. Su, ACS Photonics, 2017, 4, 986 CrossRef CAS.
- H. Lin, B. Wang, J. Xu, R. Zhang, H. Chen, Y. L. Yu and Y. S. Wang, ACS Appl. Mater. Interfaces, 2014, 6, 21264 CAS.
- J. Huang, X. L. Hu, J. J. Shen, D. L. Wu, C. F. Yin, R. Xiang, C. Yang, X. J. Liang and W. D. Xiang, CrystEngComm, 2015, 17, 7079 RSC.
- H. Yoo, Y. Kouhara, H. C. Yoon, S. J. Park, J. H. Oh and Y. R. Do, RSC Adv., 2016, 6, 111640 RSC.
- D. Q. Chen, W. D. Xiang, X. J. Liang, J. S. Zhong, H. Yu, M. Y. Ding, H. W. Lu and Z. G. Ji, J. Eur. Ceram. Soc., 2015, 35, 859 CrossRef CAS.
- Y. K. Lee, Y. H. Kim, J. Heo, W. B. Im and W. J. Chung, Opt. Lett., 2014, 39, 4084 CrossRef CAS PubMed.
- Y. Peng, R. X. Li, H. Cheng, Z. Chen, H. Li and M. X. Chen, J. Alloys Compd., 2017, 693, 279 CrossRef CAS.
- Y. C. Fang, M. Herbert, D. A. Schiraldi and C. J. Ellison, J. Mater. Sci., 2014, 49, 8252 CrossRef CAS.
- H. Liu, J. Ma, J. Gong and J. Xu, J. Non-Cryst. Solids, 2015, 419, 92 CrossRef CAS.
- J. Trimble, R. Golovchak, J. Oelgoetz, C. Brennan and A. Kovalskiy, Phys. Chem. Glasses, 2016, 57, 27 Search PubMed.
- M. Anma, T. Yano, A. Yasumori, H. Kawazoe, M. Yamane, H. Yamanaka and M. Katada, J. Non-Cryst. Solids, 1991, 135, 79 CrossRef CAS.
- Y. W. James, H. Tristan, B. Carrie, O. Justin and K. Andriy, Phys. Procedia, 2013, 44, 159 CrossRef.
- A. Osaka and Y. Miura, J. Non-Cryst. Solids, 1990, 125, 87 CrossRef CAS.
- J. Grigas, E. Talik, V. Lazauskas, Y. M. Vysochanskii, R. Yevych, M. Adamiec and V. Nelkinas, Condens. Matter Phys., 2008, 11, 473 CrossRef.
- D. Q. Chen, W. Xu, Y. Zhou, J. S. Zhong and S. C. Li, J. Mater. Chem. C, 2017, 5, 738 RSC.
- J. K. Deng, W. Li, H. R. Zhang, Y. L. Liu, B. F. Lei, H. M. Zhang, L. S. Liu, X. Bai and H. Luo, Adv. Opt. Mater., 2017, 5, 1600910 CrossRef.
- D. Q. Chen and Y. Chen, Ceram. Int., 2014, 40, 15325 CrossRef CAS.
| This journal is © The Royal Society of Chemistry 2017 |

