 Open Access Article
Fabrication of poly(ε-caprolactone) tissue engineering scaffolds with fibrillated and interconnected pores utilizing microcellular injection molding and polymer leaching†
An Huangabc,
Yongchao Jiangbcd,
Brett Napiwockice,
Haoyang Miabc,
Xiangfang Peng*a and
Lih-Sheng Turng *bc
*bc
aNational Engineering Research Center of Novel Equipment for Polymer Processing, South China University of Technology, Guangzhou, China. E-mail: pmxfpengscut@scut.edu.cn
bDepartment of Mechanical Engineering, University of Wisconsin-Madison, Madison, Wisconsin, USA
cWisconsin Institute for Discovery, University of Wisconsin-Madison, Madison, Wisconsin, USA. E-mail: turng@engr.wisc.edu
dSchool of Materials Science and Engineering, Zhengzhou University, Zhengzhou, China
eDepartment of Biomedical Engineering, University of Wisconsin-Madison, Madison, Wisconsin, USA
First published on 8th September 2017
Abstract
Three-dimensional (3D) fibrillated interconnected porous poly(ε-caprolactone) (PCL) scaffolds with desirable pore sizes and porosities were prepared by blending PCL with water-soluble poly(ethylene oxide) (PEO) as a sacrificial material, followed by microcellular injection molding and polymer leaching techniques. Immiscibility, morphology, mechanical properties, hydrophilicity, and biocompatibility of the scaffolds were investigated. Differential scanning calorimetry (DSC) and phase morphology indicated that PCL and PEO were immiscible. The incorporation of PEO not only facilitated the processing of PCL by decreasing its viscosity, it also improved the porosity and interconnectivity of the post-leached PCL scaffolds. It was found that the variety of pore diameters improved and the porosity increased up to 89.5% for the 50% PCL/50% PEO blend by volume (50% PCL). The compression modulus of the porous PCL scaffold decreased from 68.2 MPa for neat PCL to 46.7 MPa for 50% PCL due to an increase in porosity. 3T3 fibroblast cell culture was performed to confirm the biocompatibility and cell viability of the scaffolds. Cells were found to proliferate the best on the 50% PCL scaffolds, as compared to the other three scaffolds. In light of the resulting elongated and spindle-shaped pore structures as well as the biocompatibility and cell viability, this method offers an alternative means for the scalable fabrication of tissue engineering scaffolds.
1. Introduction
Tissue engineering is aimed at developing biological substitutes that restore, maintain, or improve tissue function.1 So far, tissue engineering has already been used to improve the recovery of different types of tissues such as skin, bones, blood vessels, and nerve conduits.2 Tissue engineering scaffolds are the biological constructs on which healthy human cells can grow in vitro or in vivo in a controlled environment. Currently, the main challenge for tissue engineered scaffolds is the need to mass produce three-dimensional (3D) highly porous and interconnected scaffolds with suitable surface properties that promote the biological activities of both seeded and native cells. These biological activities—such as cell adhesion, proliferation, migration, and differentiation—are greatly affected by the surrounding extracellular matrix (ECM), and these responses must be tuned to fulfill the requirements of the targeted tissue.3 Ideally, the scaffold should have pores that are open, interconnected, and hierarchical in size, and have a uniform distribution throughout the scaffold, all while maintaining the required mechanical properties.4 A highly porous and interconnected 3D structure with suitable surface properties is necessary to attain proper integration between cells and the scaffold for synthesizing new tissues.5 However, it is difficult to produce such high porosity scaffolds with specific shapes and suitable mechanical properties. Open interconnected pores allow cells to infiltrate the scaffold and also allow for the mass transport of cell nutrients and waste. Hierarchical in size refers to variable pore sizes on different scales; for example, meso-sized pores (>50 μm) influence tissue shape, micro-sized pores (1–50 μm) influence cell function, and nano-sized pores (1–1000 nm) influence nutrient diffusion.6 However, the porosity and mechanical properties, which are both important traits of tissue engineering scaffolds, are closely interrelated.7 The mechanical properties need to closely match those of the host tissue in order to provide support during the initial stages of tissue growth. The mechanical properties of several tissues are listed in Table S1 (ESI†), indicating a large mechanical property range among a variety of human tissues.5,8,9 Table S2 (ESI†) summarizes some of the pore size requirements generally proposed for various tissue engineering applications.10 However, these results are strongly dependent on the design of the scaffolds.Several different techniques have been established to create open pore structures using biodegradable polymers. The most common 3D biodegradable polymer scaffolding fabrication techniques include solvent extraction,11 particulate leaching,12 electrospinning,13,14 gel casting,15 phase separation,16–18 3D printing,19,20 and gas foaming.2
Microcellular injection molding (MIM) is attracting increased attention from researchers because it does not require an organic solvent and is environmentally friendly.21 Additionally, it is a foaming method that is able to mass produce biobased polymeric foams. During the MIM process, the supercritical fluid (SCF) is first mixed with the polymer melt inside the injection molding barrel at high temperature and pressure to form a single-phase polymer/gas solution. Next, bubbles are nucleated from a sudden decrease of pressure during the injection molding stage and continue to grow inside the mold cavity to compensate for material shrinkage. MIM has high productivity and it is easy to injection mold scaffolds with required geometries and shapes. However, this process is limited to a certain pore size, pore variety (size and shape), and porosity and, most of the time, it generates a closed cellular structure within the molded component. A closed cellular structure precludes the MIM parts from tissue engineering scaffold applications that require an interconnected pore structure.
To improve the interconnectivity between pores, a scaffold preparation method combining multiple processing methods is becoming popular for tissue engineering scaffold fabrication. It can sometimes result in products with either diverse properties or properties better than those of a given individual method.22,23 In this study, a scalable scaffold fabrication method combining MIM and the polymer leaching (PL) process were specifically studied.24–27
PL is a cost-effective technique for producing porous scaffolds that can yield fully interconnected porous networks where interconnections are characterized by cylinders, instead of small pores, that connect larger pores. This method mainly focuses on blending a water-soluble polymer with the scaffold matrix material; a porous structure can then be created after leaching the sacrificial phase, such as poly(vinyl alcohol) (PVA) or poly(ethylene oxide) (PEO).8,26 Combining PL and MIM can yield better pore size control, thus enabling the fabrication of scaffolds with multimodal pore size distributions.
A biodegradable matrix can act as a temporary scaffold within which tissue can develop. Ultimately, the biodegradable matrix is entirely replaced by cells and natural extracellular matrix (ECM).28 Thermoplastic aliphatic polyesters such as polylactide (PLA), polyglycolide (PGA), polycaprolactone (PCL), and especially the copolymers of lactide and glycolide, such as poly(lactide-co-glycolide) (PLGA), have generated interest because of their excellent biocompatibility, biodegradability, and mechanical strength. They are among the few polymers approved by the United States Food and Drug Administration (FDA) for certain human clinical applications such as surgical sutures, implantable devices,28,29 and drug delivery.30
Poly(ε-caprolactone) (PCL) is one of the most promising synthetic polymers since it is biodegradable in an aqueous medium and biocompatible in biological applications.31 PCL also has good mechanical properties, with very high flexibility and an elongation-at-break greater than 100%.32 PCL degrades by hydrolytic scission with resistance to rapid hydrolysis via its hydrolytic aliphatic-ester linkages.33 Degradation times can extend for up to 24 months. PCL scaffolds alone, without the co-blending of other polymers, yield mechanical properties adequate for craniofacial bone repair and cranial defects.34–36
In this study, PCL was blended with PEO, which is also biodegradable, biocompatible, and readily dissolved in water.37 PEO does not require potentially toxic organic solvents for dissolution. Additionally, PEO itself is non-toxic to cells; therefore, residual polymer should not affect cell viability. Following the melt blending of PCL with PEO using a twin-screw extruder, the MIM technique was applied to create a certain amount of open pores and a highly oriented and elongated pore structure. Subsequently, the water-soluble PEO was dissolved to enhance the overall pore size, porosity, hydrophilicity, and interconnectivity.
Cui et al. studied solid injection molded PCL/sodium chloride (NaCl), PCL/PEO/NaCl, and PCL/PEO/NaCl/hydroxyapatite (HA) composites.26 PEO and NaCl particulates in the composites were leached by deionized water to produce porous and interconnected microstructures. The effect of leaching time on porosity, and the residual content of NaCl and NaCl/HA, as well as the effect of HA addition on the mechanical properties, were all investigated. Jing et al. studied biomimetic porous PCL scaffolds containing chitosan nanofibers (CSNF) by using a hybrid process that combined extrusion foaming, water-soluble phase leaching, and freeze-drying.38 The high porosity and interconnectivity of the scaffolds were achieved by supercritical fluid foaming and the addition of water-soluble PEO and NaCl as porogens. The porosity of the scaffolds after leaching was over 78%. Allaf et al. studied porous PCL scaffolds by combining cryomilling and compression molding/porogen leaching techniques.39 They investigated the effects of processing parameters on scaffold morphology and properties for tissue regeneration. Specifically, the effects of molding temperature, cryomilling time, and porogen mix were examined.
The highlights of the study reported here include the following. First, there are few studies using the microcellular injection molding method to fabricate tissue engineering scaffolds, and no studies that have researched the combination of MIM and PL to fabricate 3D fibrillated interconnected porous PCL scaffolds. Second, by carefully tuning the conditions, we were able to obtain scaffolds with fibrillated pores that showed a significantly better cell affinity than other rounded-pore-structure scaffolds. Thus, this technique of microcellular injection molding for fabricating scaffolds combined with the fibrillated pores make this study unique. Furthermore, being a cost-effective, practical, and ecofriendly technique, combining MIM and PL could be an ideal approach for mass producing scaffolds with desired geometries and shapes. Immiscibility, scaffold morphology, mechanical properties, and biocompatibility were investigated as well.
2. Experimental methods
2.1 Materials
![[thin space (1/6-em)]](https://www.rsc.org/images/entities/char_2009.gif) 000, was purchased in powder form from Sigma-Aldrich. It had a specific gravity of 1.13 and a melting temperature of 65 °C.
000, was purchased in powder form from Sigma-Aldrich. It had a specific gravity of 1.13 and a melting temperature of 65 °C.2.2 Scaffold fabrication
| Solid | Microcellular | |
|---|---|---|
| Nozzle temperature (°C) | 175 | 175 |
| Mold temperature (°C) | 24 | 24 |
| Injection speed (cm3 s−1) | 70 | 70 |
| Injection pressure (bar) | 1500 | 1500 |
| Cooling time (sec) | 80 | 80 |
| Back pressure (bar) | 5 | 55 |
| SCF dosage time (sec) | N/A | 1 |
| Loading of SCF (wt%) | N/A | 0.22 |
| Pack/hold pressure (bar) | 600 | N/A |
| Pack/hold time (sec) | 3 | N/A |
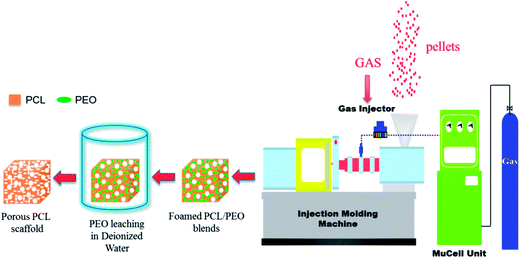
Next, the prepared cube scaffolds were cut from the middle section of the MIM tensile test bars. In this case, the resulting foamed PCL/PEO samples were immersed in deionized water to leach out the PEO. The water was changed every 12 h up to a constant weight and then a wet sample was obtained. The whole process of preparing foamed PCL scaffolds is shown in Fig. 1.
2.3 NIH 3T3 fibroblast cell culture
Microcellular injection foamed samples that were leached of PEO were chosen for cell culture to investigate biocompatibility of, and cell viability on, the four post-leached PCL foams (i.e., PCL, 90% PCL, 70% PCL, and 50% PCL). For the cell culture tests, 3T3 cells were maintained prior to testing on 6-well tissue culture-treated polystyrene plates (BD Falcon). The MIM samples that were leached of PEO were cut into cross-sectional pieces of about 10 mm × 8 mm × 2 mm at the center of the foamed tensile test bar and were placed in 24-well tissue culture-treated polystyrene plates after sterilization with UV light for 1 h (30 min each side). 3T3 cells (NIH/3T3 (ATCC® CRL-1658™)) were treated with ethylenediaminetetraacetic acid (EDTA) for 5 min and washed with phosphate-buffered saline (PBS) prior to seeding. Cells were seeded at a density of 1.25 × 10⁵ cells per cm2 in the high-glucose 3T3 medium. Spent medium was aspirated and replaced with 1 mL of fresh medium daily for screening samples.2.4 Characterizations
The pore size and pore density were measured from SEM micrographs using the Image-Pro Plus software (Image-Pro Plus 6.0). The average pore diameter (D) of all of the pores in the SEM micrograph was calculated with eqn (1):41
 | (1) |
The pore density (Nc) of the foamed samples was calculated by eqn (2):2
 | (2) |
 | (3) |
3. Results and discussion
3.1 Immiscibility of PCL and PEO
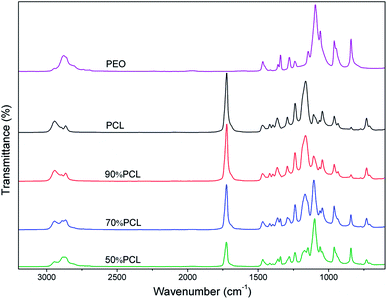
The miscibility of polymers is an important property of blends and may affect their foaming and leaching behaviors. FTIR was used to identify the molecular construction of the blends. As shown in Fig. 2, the peak at 1110 cm−1, which indicated the C–O–C group, was the characteristic peak of PEO. It only existed in PEO and its intensity increased with an increased ratio of PEO. The C![[double bond, length as m-dash]](https://www.rsc.org/images/entities/char_e001.gif) O group peak at 1727 cm−1 also only existed in PCL, and its intensity decreased with an increased ratio of PEO. The FTIR results showed that PCL and PEO were compounded successfully and that no chemical reactions occurred during melt blending since no new chemical bonds were identified.
O group peak at 1727 cm−1 also only existed in PCL, and its intensity decreased with an increased ratio of PEO. The FTIR results showed that PCL and PEO were compounded successfully and that no chemical reactions occurred during melt blending since no new chemical bonds were identified.
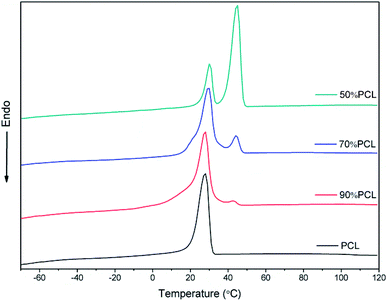
The DSC results shown in Fig. 3 confirmed the immiscibility of PCL and PEO, as can be verified from their completely separate crystallization peaks. All of the blends had two crystallization peaks. As shown in Fig. 3, there were two crystallization peaks after the incorporation of PEO. The crystallization peak of PCL was around 30 °C while the second crystallization peak belonged to PEO. As the PEO content increased, the intensity of the crystallization peak of PEO became sharper while the temperature remained the same, thus also indicating the immiscibility of PCL and PEO.
SEM was used to study the phase morphology of solid PCL and PCL/PEO blends. The images helped to further understand the components' miscibility. The fractured surface morphologies of PCL and PCL/PEO before leaching are shown in Fig. 4, which further proves the immiscibility of PCL and PEO. PCL (Fig. 4(a)) exhibited a relatively smooth fracture surface. As shown in Fig. 4(b), with the addition of 10% PEO, a certain degree of sea-island structures occurred, and the surface became a little rough. As the content of PEO increased to 30%, the fracture surface became rougher and the sea-island structures became clearer. However, when the content of PEO reached 50%, the morphology changed significantly. There was an obvious co-continuous phase due to the immiscibility between PCL and PEO. To further verify the immiscibility and the formation of the co-continuous phase, the morphology of the cryogenic fractured (using liquid nitrogen) cross-sections of injection molded solid PCL and PCL/PEO blends after leaching PEO were studied below.
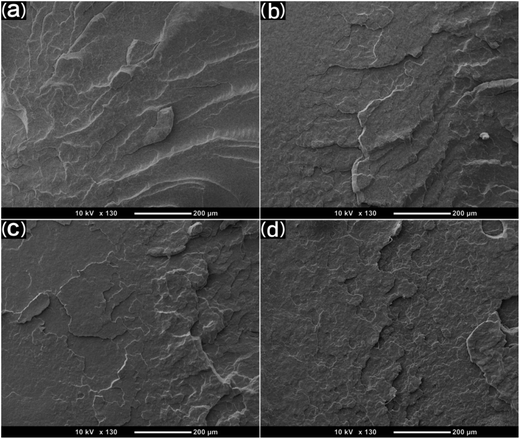 | ||
| Fig. 4 SEM micrographs before leaching PEO of the fractured surface of injection molded solid PCL and PCL/PEO blends: (a) PCL, (b) 90% PCL, (c) 70% PCL, and (d) 50% PCL. | ||
Fig. 5 shows the morphology of leached injection molded solid PCL and PCL/PEO samples. As shown in Fig. 5, the number of voids increased as the amount of PEO increased in the blends. Continuous channels could be seen in the 70% PCL and 50% PCL samples (Fig. 5(c) and (d)); however, the channels in the 50% PCL were longer and more uniformly distributed throughout than in the 70% PCL samples. Moreover, interconnected channels were formed in the 50% PCL sample. Channels on the void walls were visible, thus suggesting the immiscibility and the formation of a co-continuous structure, which corresponded to the above results.
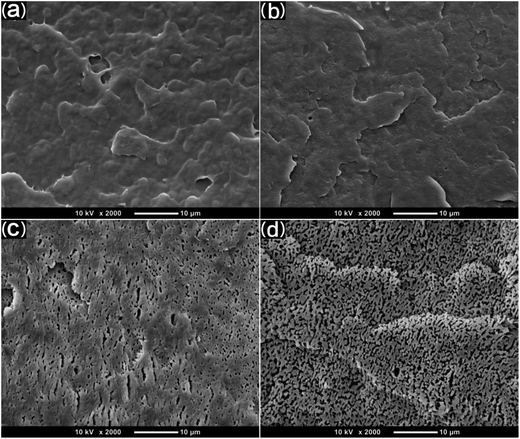 | ||
| Fig. 5 SEM micrographs after leaching PEO of the fractured surface of injection molded solid PCL and PCL/PEO blends: (a) PCL, (b) 90% PCL, (c) 70% PCL, and (d) 50% PCL. | ||
3.2 Rheological properties
The rheological properties of the samples were studied to investigate the effects of PEO on the PCL matrix, which was closely related to the foam behavior.42,43 As shown in Fig. 6, PCL, PEO, and PCL/PEO blends before leaching PEO exhibited strong shear-thinning behavior. PCL had a much higher complex viscosity than PEO, and the complex viscosity of the PCL/PEO blends fell between those of the PCL and PEO as expected. As to the PCL/PEO blends, the complex viscosity decreased with the PEO content. The rheology results indicated that the addition of PEO decreased the melt viscosity of the PCL scaffold, which favored the formation of large open bubbles during MIM.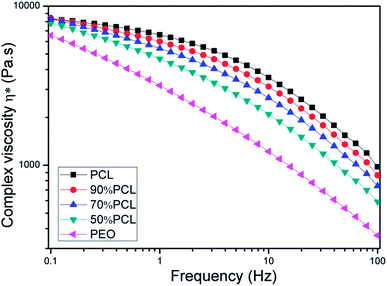 | ||
| Fig. 6 Complex viscosity (η*) versus frequency for PCL and PCL/PEO blends before leaching PEO at 120 °C. | ||
3.3 Detection of residual PEO in the blends after leaching
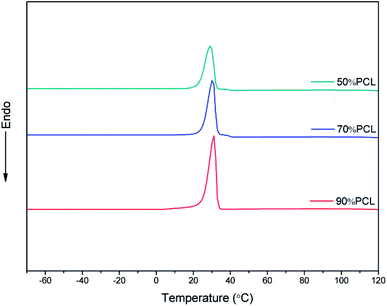
The efficiency of the leaching process has to be taken into consideration with this fabrication method. To further verify the removal of PEO in the blends with different compositions, DSC tests were carried out to detect the residual PEO phase; the results are shown in Fig. 7. As shown in Fig. 7, after leaching PEO from the 90% PCL, 70% PCL, and 50% PCL samples, the second peak of crystallinity associated with PEO disappeared compared to Fig. 3, demonstrating that the PEO in the blend was leached out to an extent not detectable by DSC.3.4 Morphology of the scaffolds before leaching PEO
Fig. 8 shows the morphology on the cross sections of MIM PCL and PCL/PEO samples before leaching PEO. It was found that PCL exhibited an elliptical pore structure, while the pores of the PCL/PEO samples were elongated in the thickness direction of the foamed tensile bar samples with a high length-to-width ratio, especially for the 50% PCL samples. This was likely due to pore expansion along the thickness direction of the tensile bar sample when the mold was opened during MIM. To further specify the elongation of the pores, the pore sizes along the long axis were measured, and the size distributions were shown to the right of the corresponding SEM micrographs. The statistical results showed that PCL had a relatively concentrated pore size distribution, with pore sizes ranging from 54.4 to 232.3 μm. This distribution became wider and shifted to higher values as the PEO content increased in the PCL, indicating that the addition of PEO assisted in the formation of elongated pores. The significance of this effect was further investigated by comparing the mean pore size in the long axis and minor axis (Fig. 9(a)), and the pore aspect ratio (Fig. 9(b)). PCL showed a slightly larger pore size in the long axis than in the minor axis, and the aspect ratio was lower than in the 90% PCL, 70% PCL, and 50% PCL samples. The three PCL/PEO samples had higher pore sizes in both the long axis and the minor axis as compared to the PCL sample, and this difference increased with increasing PEO content. The aspect ratios of PCL/PEO samples with high PEO contents were higher as well. These statistical results further demonstrated the important effect of PEO on the formation of an orientated pore structure in the thickness direction of the tensile bar when the mold opens at the end of the MIM cycle.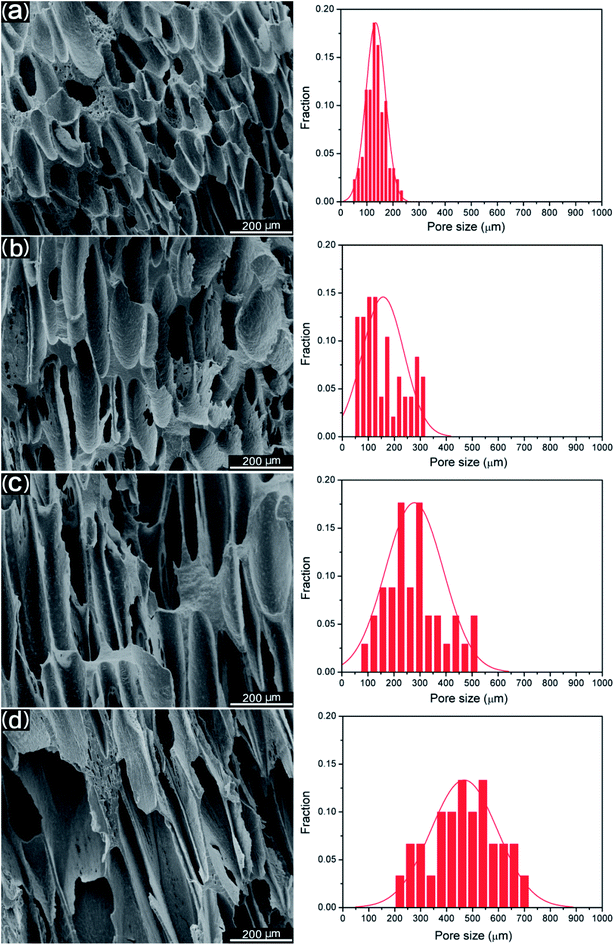 | ||
| Fig. 8 SEM images of foamed PCL samples before leaching PEO and their pore size distributions along the long axis of the orientated pores: (a) PCL, (b) 90% PCL, (c) 70% PCL, and (d) 50% PCL. | ||
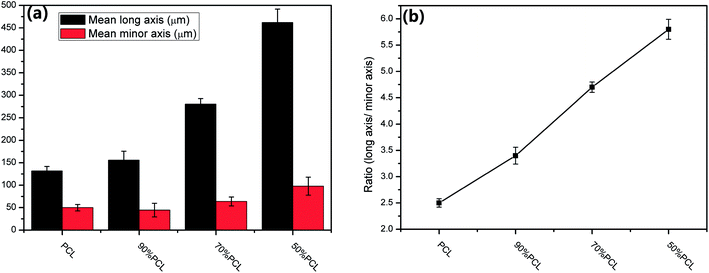 | ||
| Fig. 9 (a) Mean long axis pore size and minor axis pore size and (b) aspect ratio of the pore size of foamed PCL samples before leaching. | ||
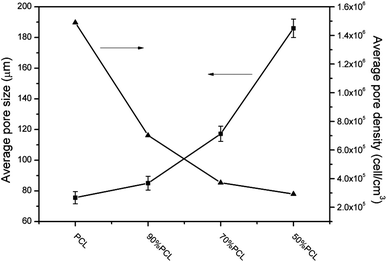
The average pore size and pore density were measured as well to investigate the overall foamed structures as shown in Fig. 10. It can be seen that the average pore size became larger and increased from 75.6 μm to 186.2 μm, while the average pore density decreased from 1.49 × 10⁶ to 2.92 × 10⁵ cell per cm3, as the PEO content increased. The shape of the pore became longer after adding PEO. There was a linear relationship between the sizes of the pores and the PEO content in the blends. This might have been due to the viscosity of the PCL/PEO samples decreasing with higher amounts of PEO (cf. Fig. 6), thus resulting in pores that grew more readily. As the injection foaming conditions were the same for all of the samples, pore expansion mainly depended on the melt strength represented by the complex viscosity of the samples.44,45 Since the melt strength of the matrix was weakened by PEO and the N2-induced plasticization effect, the matrix became too weak to sustain pore expansion, and the pores had a tendency to break at the pore strut wall, which resulted in larger, partially open pores in the high-ratio PCL scaffolds. The highly elongated, anisotropic pore structure that formed may yield some unique properties for the PCL/PEO foamed samples as it would favor cell infiltration and the transportation of nutrients and metabolic waste.
3.5 Morphology of the scaffolds after leaching PEO
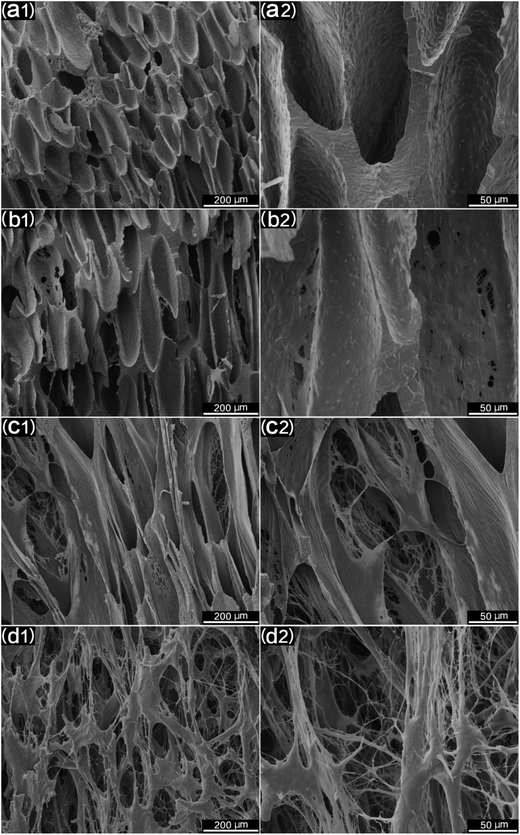
For tissue engineering scaffold applications, the pore structure, interconnectivity, and porosity are important parameters, and they must match the type of tissue being regenerated.46 Another key step to enhancing the porosity and interconnectivity is polymer leaching. Fig. 11 shows the morphology of microcellular injection foamed PCL and PCL/PEO samples after leaching PEO. The images on the right are the magnification of the corresponding images on the left. PCL (Fig. 11(a)) presented an almost closed pore structure. However, 90% PCL, 70% PCL, and 50% PCL scaffolds exhibited an interconnected pore structure through openings (holes) in the pore walls. Furthermore, the connectivity of the pores was enhanced at higher PEO ratios. Another feature that is noteworthy is that the pores were almost fully interconnected and exhibited an interesting fibrillated web structure, especially for the 50% PCL scaffold (Fig. 11(d)). Such an interconnected and fibrillated web structure would enhance cell attachment and adhesion during cell culture experiments.The statistical results of porosity are shown in Fig. 12. It was found that the porosity increased as the leached PEO content increased. Additionally, a maximum porosity of 89.5% was obtained for 50% PCL, thus indicating that the leaching of PEO combined with injection foaming enabled PCL to meet the requirements of tissue engineering scaffolds; that is, a highly porous and interconnected structure.
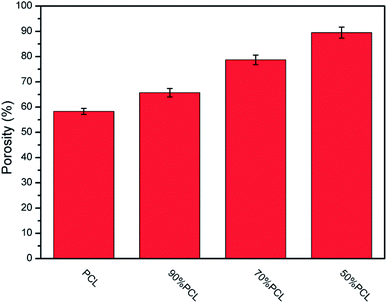 | ||
| Fig. 12 The statistical results for the porosity of microcellular injection foamed PCL scaffolds after leaching PEO. | ||
3.6 Water contact angle (WCA)
The water contact angle directly reflects the surface wettability of the scaffolds, which affect protein absorption and subsequent cell adhesion, as well as infiltration.47,48 Hydrophilicity plays a vital role in the interactions between the cells and the matrix.49 To evaluate the difference of the hydrophilicity of the four prepared PCL scaffolds (the foamed PCL and PCL/PEO samples after leaching), a water contact angle test was carried out. As shown in Fig. 13, the variety of pore sizes and porosities greatly enhanced the hydrophilicity of the scaffolds, as compared with the PCL scaffold, with the contact angle ranging from 86.3° ± 0.9° for PCL to 44.3° ± 1.5° for 50% PCL. These results indicated that the wettability was significantly enhanced with 50% PCL.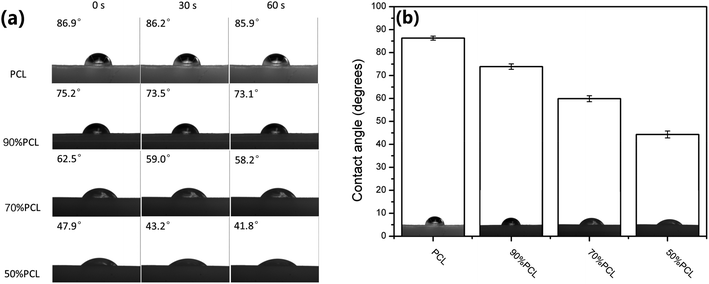 | ||
| Fig. 13 (a) Water contact angle images and (b) water contact angle values of microcellular injection foamed PCL scaffolds after leaching PEO. | ||
3.7 Mechanical properties
The mechanical properties of scaffolds are of crucial importance in tissue engineering applications. Compression tests were used to evaluate the mechanical strength of the tissue engineering scaffolds and the foamed PCL scaffolds after leaching PEO; see Fig. 14. PCL had a high compressive modulus and compressive yield stress. However, the compressive modulus and yield stress decreased as the leached PEO content increased. The compressive modulus ranged from 46.7 to 68.2 MPa, which meets the compressive modulus requirement of cancellous bone as introduced previously. Thus, the PCL scaffolds mass produced by MIM with leaching afterward have great potential in meeting the mechanical property requirements for some human tissues.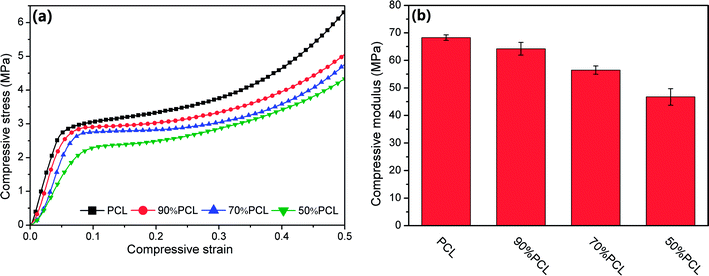 | ||
| Fig. 14 Compressive property tests: (a) stress–strain curves, and (b) statistical histogram of compressive moduli of microcellular injection foamed PCL scaffolds after leaching PEO. | ||
3.8 Cell viability and proliferation
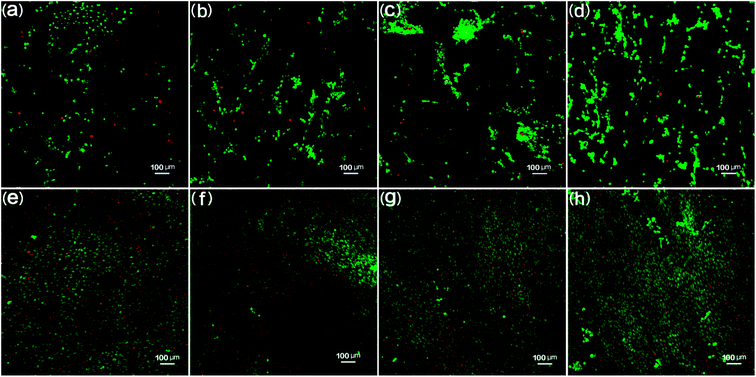
The biocompatibility of the PCL scaffolds was tested by culturing 3T3 fibroblasts for 3 days and 10 days to explore the potential of these samples being used as tissue engineering scaffolds in biomedical applications. The 3T3 fibroblast cell morphology day 3 and day 10 results are shown in Fig. 15. Fig. 15(a) through (d) shows the day 3 results. It is clear that fibroblasts attached and spread out all over the scaffolds. In the florescence images, the green color indicates live cells while the red color represents dead cells.50 The fluorescence images show large quantities of live cells. PCL scaffolds (Fig. 15(a)) show a large amount of live cells as compared to bare dead cells. It was also found that the live cells increased and the dead cells decreased for 90% PCL and 70% PCL scaffolds as compared with PCL samples, thus indicating good biocompatibility between the substrate and the cells. It is worth noting that the 50% PCL sample had almost all live cells and no dead cells, demonstrating that 50% PCL had the best biocompatibility. Moreover, the dispersion of live cells was the most uniform on the 50% PCL sample. This could be due to the maximum porosity and pore size variety of the 50% PCL (cf. Fig. 11 and 12).The day 10 fluorescence images (Fig. 15(e) through (h)) show that very few dead cells were present on all four scaffolds. There were more and denser cells on all scaffolds compared to day 3. Most cells were still alive, indicating that all scaffolds showed good biocompatibility. The trend of the biocompatibility of day 10 was the same as day 3. In addition, the media was relatively clear, suggesting that not many dead cells were washed away during periodic culture media replacement. It was observed that live cells continued to proliferate on the scaffolds, thus indicating that the scaffolds provided a suitable environment for cells to grow.
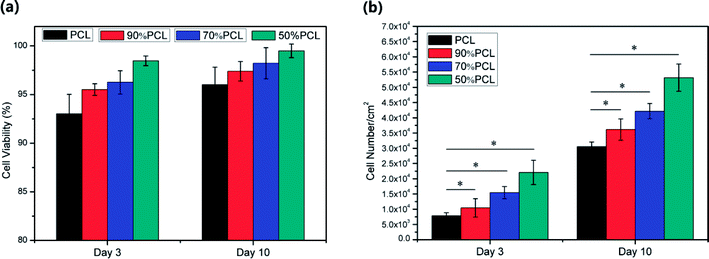
The cell viability results are shown in Fig. 16(a). The cell viability on the 90% PCL, 70% PCL, and 50% PCL scaffolds was enhanced compared to the PCL scaffold, demonstrating a flourishing living state of fibroblast cells. In addition, it was found that the average cell viability of all scaffolds was higher than 90% after 10 days of culture. Moreover, it should be noted that the 50% PCL scaffolds had an average of 95% live cells at day 3 and an average 98% live cells at day 10, thus indicating the best biocompatibility of all of the scaffolds.
The cell number on the scaffolds at day 3 and day 10 from the MTS assay is shown in Fig. 16(b), which demonstrated that cell populations increased from day 3 to day 10 dramatically on all scaffolds. The data were analyzed using an analysis of variance technique. The group with P < 0.01 was recognized as statistically significant. The resulting cell number indicates the number of living and attached cells per cm2 on the scaffold. It was found that the cell count for 50% PCL scaffold was higher than that of the other scaffolds at day 3 and day 10, thus indicating faster cell proliferation. This difference was statistically significant at day 10. This might have been due to the large variability in pore sizes, porosities, and fibrillated webs on the 50% PCL scaffold as well as its high hydrophilicity, which was optimal for cell adhesion and proliferation.
4. Conclusions
PCL porous scaffolds with porosity levels up to 89.5% and a desirable pore structure were obtained by a combination of microcellular injection molding and polymer leaching techniques. Compared to conventional salt particle leaching, this new fabrication technique allows for better control of pore interconnectivity by the creation of a fully interconnected fibrillated porous network. Supercritical N2 was used to generate the micropores inside of the PCL matrix. PEO leaching was used to further enhance the interconnectivity of the scaffolds. The PEO leaching technique also allowed for the porosity range to be widened to 89.5% for 50% PCL while still maintaining good mechanical integrity. 3T3 fibroblast cell culture experiments demonstrated that the method used in this study significantly enhanced the biocompatibility of the PCL scaffolds, and that the 50% PCL scaffold had the highest cell adhesion, cell viability, and cell proliferation of the PCL scaffolds tested. Furthermore, a greater variety of pore sizes and structures became obvious for the 50% PCL scaffolds using this method. As expected, the compression moduli of the porous PCL materials decreased with increased porosity. The values varied from 46.7 MPa to 68.2 MPa, which may render these scaffolds suitable for multiple tissue types in a variety of medical and tissue engineering applications, including load bearing applications. The novel solvent-free approach proposed in this study provides a new tissue engineering scaffold fabrication method that has the potential to mass produce tissue scaffolds and be used for multiple tissue types in a variety of medical and tissue engineering applications.Conflicts of interest
There are no conflicts to declare.Acknowledgements
The authors would like to acknowledge the support of the Wisconsin Institute for Discovery (WID), the Kuo K. and Cindy F. Wang Professorship, the Vilas Distinguished Achievement Professorship, the China Scholarship Council, the financial support of the National Natural Science Foundation of China (No. 51573063 and 21174044), the Guangdong Nature Science Foundation (No. S2013020013855), the Guangdong Science and Technology Planning Project (No. 2014B010104004 and 2013B090600126), the Guangzhou Science and Technology Planning Project (No. 201604010013), and the National Basic Research Development Program 973 in China (No. 2012CB025902).References
- J. Lannutti, D. Reneker, T. Ma, D. Tomasko and D. Farson, Mater. Sci. Eng., C, 2007, 27, 504–509 CrossRef CAS.
- H. Y. Mi, R. M. Salick, X. Jing, R. B. Jacques, C. C. Wendy, X. F. Peng and L. S. Turng, Mater. Sci. Eng., C, 2013, 33, 4767–4776 CrossRef CAS PubMed.
- Y. Z. Zhang, J. Venugopal, Z. M. Huang, C. T. Lim and S. Ramakrishna, Biomacromolecules, 2005, 6, 2583–2589 CrossRef CAS PubMed.
- S. J. Hollister, Nat. Mater., 2005, 4, 518–524 CrossRef CAS PubMed.
- S. F. Yang, K. F. Leong, Z. H. Du and C. K. Chua, Tissue Eng., 2001, 7, 679–689 CrossRef CAS PubMed.
- W. Bonfield, Philos. Trans. R. Soc., A, 2006, 364, 227–232 CrossRef CAS PubMed.
- H. Y. Mi, X. Jing, M. R. Salick, L. S. Turng and X. F. Peng, J. Mater. Res., 2014, 29, 911–922 CrossRef CAS.
- A. Kramschuster and L. S. Turng, J. Biomed. Mater. Res., Part B, 2010, 92, 366–376 Search PubMed.
- A. Baji, S. C. Wong, T. S. Srivatsan, G. O. Njus and G. Mathur, Mater. Manuf. Processes, 2006, 21, 211–218 CrossRef CAS.
- P. Sarazin, X. Roy and B. D. Favis, Biomaterials, 2004, 25, 5965–5978 CrossRef CAS PubMed.
- C. T. Laurencin, M. A. Attawia, H. E. Elgendy and K. M. Herbert, Bone, 1996, 19, S93–S99 CrossRef.
- S. L. Ishaug-Riley, G. M. Crane-Kruger, M. J. Yaszemski and A. G. Mikos, Biomaterials, 1998, 19, 1405–1412 CrossRef CAS PubMed.
- C. Zhang, M. R. Salick, T. M. Cordie, T. Ellingham, Y. Dan and L. S. Turng, Mater. Sci. Eng., C, 2015, 49, 463–471 CrossRef CAS PubMed.
- Y. C. Jiang, L. Jiang, A. Huang, X. F. Wang, Q. Li and L. S. Turng, Mater. Sci. Eng., C, 2017, 71, 901–908 CrossRef CAS PubMed.
- A. D. Coombes and J. D. Heckman, Biomaterials, 1992, 13, 217–224 CrossRef CAS PubMed.
- J. Nakamatsu, F. G. Torres, O. P. Troncoso, M. L. Yuan and A. R. Boccaccini, Biomacromolecules, 2006, 7, 3345–3355 CrossRef CAS PubMed.
- J. Mao, S. Duan, A. Song, Q. Cai, X. Deng and X. Yang, Mater. Sci. Eng., C, 2012, 32, 1407–1414 CrossRef CAS PubMed.
- J. Zhao, W. Han, M. Tu, S. Huan, R. Zeng, H. Wu, Z. Cha and C. Zhou, Mater. Sci. Eng., C, 2012, 32, 1496–1502 CrossRef CAS PubMed.
- C. X. F. Lam, X. M. Mo, S. H. Teoh and D. W. Hutmacher, Mater. Sci. Eng., C, 2002, 20, 49–56 CrossRef.
- D. W. Hutmacher, T. Schantz, I. Zein, K. W. Ng, S. H. Teoh and K. C. Tan, J. Biomed. Mater. Res., Part A, 2001, 55, 203–216 CrossRef CAS.
- H. Y. Mi, X. Jing, J. Peng, M. R. Salick, X. F. Peng and L. S. Turng, Cellulose, 2014, 21, 2727–2741 CrossRef CAS.
- L. B. Wu, D. Y. Jing and J. D. Ding, Biomaterials, 2006, 27, 185–191 CrossRef CAS PubMed.
- S. J. Liu, C. L. Hsueh, S. W. N. Ueng, S. S. Lin and J. K. Chen, Asia-Pac. J. Chem. Eng., 2009, 4, 154–160 CrossRef CAS.
- A. Javadi, Y. Srithep, S. Pilla, J. Lee, S. Gong and L. S. Turng, Mater. Sci. Eng., C, 2010, 30, 749–757 CrossRef CAS.
- S. Pilla, A. Kramschuster, L. Yang, J. Lee, S. Gong and L. S. Turng, Mater. Sci. Eng., C, 2009, 29, 1258–1265 CrossRef CAS.
- Z. X. Cui, B. Nelson, Y. Y. Peng, K. Li, S. Pilla, W. J. Li, L. S. Turng and C. Y. Shen, Mater. Sci. Eng., C, 2012, 32, 1674–1681 CrossRef CAS PubMed.
- D. Sin, X. Miao, G. Liu, F. Wei, G. Chadwick, C. Yan and T. Friis, Mater. Sci. Eng., C, 2010, 30, 78–85 CrossRef CAS.
- M. C. Peters and D. J. Mooney, Mater. Sci. Forum, 1997, 250, 43–52 CrossRef CAS.
- V. Karageorgiou and D. Kaplan, Biomaterials, 2005, 26, 5474–5491 CrossRef CAS PubMed.
- R. Jain, N. H. Shah, A. W. Malick and C. T. Rhodes, Drug Dev. Ind. Pharm., 1998, 24, 703–727 CrossRef CAS PubMed.
- P. S. Donoghue, R. Lamond, S. D. Boomkamp, T. Sun, N. Gadegaard, M. O. Riehle and S. C. Barnett, Tissue Eng., Part A, 2013, 19, 497–507 CrossRef CAS PubMed.
- P. Matzinos, V. Tserki, C. Gianikouris, E. Pavlidou and C. Panayiotou, Eur. Polym. J., 2002, 38, 1713–1720 CrossRef CAS.
- H. Y. Cheung, K. T. Lau, T. P. Lu and D. Hui, Composites, Part B, 2007, 38, 291–300 CrossRef.
- Y. Zhou, D. W. Hutmacher, S. L. Varawan and T. M. Lim, Polym. Int., 2007, 56, 333–342 CrossRef CAS.
- M. Endres, D. W. Hutmacher, A. J. Salgado, C. Kaps, J. Ringe, R. L. Reis, M. Sittinger, A. Brandwood and J. T. Schantz, Tissue Eng., 2003, 9(4), 689–702 CrossRef CAS PubMed.
- J. T. Schantz, D. W. Hutmacher, C. X. F. Lam, M. Brinkmann, K. M. Wong, T. C. Lim, N. Chou, R. E. Guldberg and S. H. Teoh, Tissue Eng., 2003, 9, 127–139 CrossRef PubMed.
- Y. Kodama, L. D. B. Machado, C. Giovedi and K. Nakayama, Nucl. Instrum. Methods Phys. Res., Sect. B, 2007, 265, 294–299 CrossRef CAS.
- X. Jing, H. Y. Mi, T. Cordie, M. R. Salick, X. F. Peng and L. S. Turng, Ind. Eng. Chem. Res., 2014, 53, 17909–17918 CrossRef CAS.
- R. M. Allaf, I. V. Rivero, N. Abidi and I. N. Ivanov, J. Biomed. Mater. Res., Part B, 2013, 101, 1050–1060 CrossRef PubMed.
- E. Di Maio, G. Mensitieri, S. Iannace, L. Nicolais, W. Li and R. W. Flumerfelt, Polym. Eng. Sci., 2005, 45, 432–441 CAS.
- A. Huang, H. Kharbas, T. Ellingham, H. Y. Mi, L. S. Turng and X. F. Peng, Polym. Eng. Sci., 2016, 57, 570–580 Search PubMed.
- X. F. Peng, K. C. Li, H. Y. Mi, X. Jing and B. Y. Cheng, RSC Adv., 2016, 6, 3176–3185 RSC.
- G. Zhang, Y. Wang, H. Xing, J. Qiu, J. Gong, K. Yao, H. Tan, Z. Jiang and T. Tang, RSC Adv., 2015, 5, 27181–27189 RSC.
- T. R. Kuang, H. Y. Mi, D. J. Fu, X. Jing, B. Y. Chen, W. J. Mou and X. F. Peng, Ind. Eng. Chem. Res., 2015, 54, 758–768 CrossRef CAS.
- K. Yao, H. Tan, Y. Lin, G. Zhang, J. Gong, J. Qiu, T. Tang, H. Na and Z. Jiang, RSC Adv., 2014, 4, 64053–64060 RSC.
- A. G. A. Coombes, S. C. Rizzi, M. Williamson, J. E. Barralet, S. Downes and W. A. Wallace, Biomaterials, 2004, 25, 315–325 CrossRef CAS PubMed.
- L. Ghasemi-Mobarakeh, M. P. Prabhakaran, M. Morshed, M. H. Nasr-Esfahani and S. Ramakrishna, Biomaterials, 2008, 29, 4532–4539 CrossRef CAS PubMed.
- X. Jing, H. Y. Mi, M. R. Salick, T. M. Cordie, X. F. Peng and L. S. Trung, Mater. Sci. Eng., C, 2015, 49, 40–50 CrossRef CAS PubMed.
- T. Wu, J. Sha, Y. Peng, X. Chen, L. Xie, Y. Ma and L. S. Trung, RSC Adv., 2016, 6, 101660–101670 RSC.
- J. Sha, Y. Gao, T. Wu, X. Chen, T. Cordie, H. Zhao, L. Xie, Y. Ma and L. S. Turng, RSC Adv., 2016, 6, 35641–35647 RSC.
Footnote |
| † Electronic supplementary information (ESI) available. See DOI: 10.1039/c7ra06987a |
| This journal is © The Royal Society of Chemistry 2017 |

