 Open Access Article
Creative Commons Attribution 3.0 Unported Licence
Non-equilibrium ultrasound-assisted solid–liquid extraction of boron present in different phases within plants by ICP-OES
Aide Sun *ab,
Qingcai Xu*a,
Liying Rena,
Guangjie Caoa and
Dianda Goua
aShandong Provincial Key Laboratory of Water and Soil Conservation and Environmental Protection, College of Resource and Environment, Linyi University, Linyi 276005, China. E-mail: adsun1977@gmail.com; xu_qingcai@163.com; liyingren25@163.com; Caoguangjie@lyu.edu.cn; guodianda0523@163.com
bState Key Laboratory of Isotope Geochemistry, Guangzhou Institute of Geochemistry, Chinese Academy of Sciences, Guangzhou 510640, China
First published on 26th October 2017
Abstract
A non-equilibrium ultrasound-assisted solid–liquid extraction method was developed for the separation of boron (B) in different forms (water-soluble B in the sap and structural B in the cells) in plant and phyto food samples. The factors influencing separation efficiency of the proposed method were investigated. The results showed that the method could be successfully applied to the separation of water-soluble and structural B within plant samples. The linear range of the method was in the range of 5–100 mg kg−1 for different plant and phyto food samples. The limit of detection was 2 mg kg−1 with a correlation coefficient of 0.998, and a relative standard deviation of 2.3%. This method has the advantage of only requiring a single plant sample for combined analysis of water-soluble and structural B. The B mass distribution of the two phases in different tissues obtained by the method is valuable for the elucidation of the molecular mechanisms in uptake of B in plants and phyto foods.
Introduction
It is well known that B is one of the key micronutrients for normal growth and embryo development of plants.1–4 Studies on the biological and physiological functions of B and B-containing compounds have identified their distribution characteristics in different tissues, biochemical behaviour in transportation and uptake, and inhibitory activities in enzyme systems.1,4–6 According to these reports, once B in soil solution is absorbed, and then transported from the roots to other organs, in the plant, there are two forms of B, water-soluble B in the aqueous sap and structural B fixed in the cells.1,4,6 In plant growth, parts of the water-soluble B are converted to another formation of structural B to form tissues, which gradually accumulates in the cell wall and no longer participates in transport, exchange or cycling within the plant. These two forms of B therefore in the same tissue may play different roles in plant growth and development. The ability to distinguish the function of the two forms of B would provide more detail on the mechanisms of transport, uptake and translocation of B within plants. Ishii et al.7 and Hu et al.8 have isolated and characterized dissolved B-cis-polyol complexes from the phloem sap of some plants, while in the cell wall, B in the form of borate cross-linked with hydroxyl groups in pectin to form stable diesters. This suggests that the formation of structural B is essential for the structure and function of cell wall, and contributes significantly to the control of cell wall porosity and tensile strength.6 Nevertheless, B is not easily remobilized from old leaves to new tissues after plant senescence.5There are, however, few reports on the utilization of the two forms of B separately within plants and phyto foods. Generally, in analytical studies of B in plant and phyto food samples,9–12 the two forms of B have always been considered together for tests. In these circumstances, the obtained data from plant samples are the summation of B in water-soluble and structural forms. It is therefore not possible to determine the amount of B that is incorporated into the cell or left in aqueous solution. Consequently, greater concerns have been paid to the separation and analysis of B in different forms within the plant.
Ultrasound-assisted solid–liquid extraction has been found to be a powerful tool in the analysis of bioactive compounds in herbs and phyto foods,13–17 pesticide residues and endocrine disrupting chemicals in soil samples.18–23 By inducing cavitation, the method results in collapse of the material matrix and enhanced recovery of analytes from matrix to the extraction solvent.17,22 On the basis of the foregoing, it was urgent to develop a method to separate B in two forms to investigate the intra- and inter-plant differential mass fractionation of B in between organs. The B mass fraction was determined by inductively coupled plasma optical emission spectrometry (ICP-OES). The factors affecting the separation efficiency of B in two forms were investigated. The method has a good limit of detection that can enable meticulous measurement of B in different forms within plants and phyto foods.
Materials and methods
Reagents
A standard solution of boric acid (1000 μg mL−1) was purchased from the National Research Centre for Certified Reference Materials (Beijing, China). Hydrochloric acid (Guaranteed Reagent) was redistilled to remove exogenous B and was stored in a sealed polypropylene vessel. High purity water with a B blank of less than 8 μg L−1 was redistilled by sub-boiling distillation, passed through a column filled with B-selective resin (Amberlite IRA 743, Sigma Aldrich Co. LLC., Shanghai China), and then used to prepare the standard and working solutions.Apparatus
An ICP-OES (Vista MPX, Varian, USA) coupled with a 40 MHz radio frequency generator and a charge coupled device detector was used for the determination of B.24 The spectrometer was operated in the transient signal acquisition mode. The spectral line for the B determination was set at 249.68 nm.Separation of two forms of B from individual plant samples
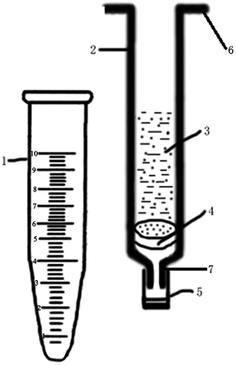
About 0.2–0.3 g of dried plant sample was weighted and placed into a self-manufactured solid–liquid separation apparatus, which was shown in Fig. 1. The apparatus contained a 3 mL disposable syringe, a sieve plate with aperture size of 20 μm at the bottom of the syringe, and a closed end cap to prevent the solution from leaking. Deionized water (2.5 mL) was added to the apparatus, which was then placed into a 10 mL centrifuge tube. The apparatus with sample and extraction solution was settled in an ultrasonic stirrer with a heat-controlled water bath at 35 °C for 20 min. After removal of the end cap, the apparatus and centrifuge tube were then centrifuged at 5000 rpm for 5 min to separate the residual sample and extractant solution. In this process, the aperture of the sieve plate in the column approximately 20 μm, prevented plant powder particles from leaking into the eluate during centrifugation. The process was repeated five times. All collected eluates were combined in a 30 mL Teflon tube, and then the solution was evaporated at 40 °C in an air stream. When reduced to about 1 mL, the solution was transferred to a 10 mL quartz crucible that had been washed with 3 × 0.5 mL high-purity water. The solution in the quartz crucible was evaporated to about 0.1 mL at 40 °C and then transferred to a muffle furnace for dry ashing at 600 °C for 4 h. The plant particle residues was conditioned with dry ashing in a muffle furnace to obtain the contents of B. Subsequently, the solution and the plant residues after ashing were both dissolved by 1 mol L−1 HCl solution and quantified for determination of B by ICP-OES.24Results and discussion
Effect of time on the efficiency of water-soluble B extraction from plant samples
Like other extractions, static solid–liquid extraction is a process that is dependent on equilibrium. The principle of the method is equilibrium partitioning of the analyte between the aqueous extraction solvent and sample particles. Three plant samples (stem (A) and leaf (B) of Weigela florida, and leaf (C) of Swertia mussotii) were chosen at random to examine the extraction efficiency of water-soluble B from plant samples by this method. Extraction time ranging from 5 to 60 min was used for investigation. The results, shown in Fig. 2, indicated that the mass fraction of B increased gradually with time and the equilibrium of the process need not to be reached. Thus, after 20 min the mass fraction of B levelled off, an extraction time of 20 min was used for subsequent tests.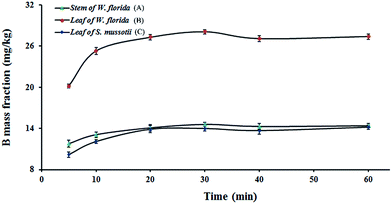 | ||
| Fig. 2 Variation of the mass fraction of B with extraction time. (A) Stem of W. florida; (B) leaf of W. florida; (C) leaf of S. mussotii. | ||
Effect of temperature on the efficiency of water-soluble B extraction from plant samples
To test the separation efficiency between water-soluble B and structural B using the proposed method, the effect of temperature of the extraction solution was investigated. Within the plant, some of the boric acid in the sap will be absorbed in the surface of the solid phase via ligand binding with hydroxyl groups, which may be dependent on temperature. At higher temperature, the distribution coefficient will be increased, which is likely to lead to a decrease of absorbed B with extraction time. The temperature of the extraction solution was set at 25, 35, 45, 55, and 60 °C for trials. The mass fractions of B in the three samples were determined after extraction at each temperature. The results are shown in Fig. 3.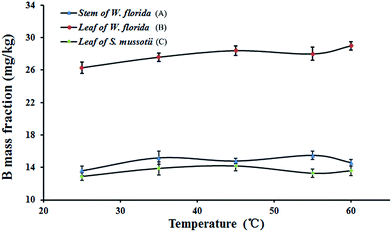 | ||
| Fig. 3 Variation of the mass fraction of B at different temperatures. (A) Stem of W. florida; (B) leaf of W. florida; (C) leaf of S. mussotii. | ||
It is obvious in Fig. 3 that the mass fractions of B extracted from the samples at each temperature fluctuated at a similar level. This indicated that at higher temperatures, the amount of water-soluble B was almost unchanged and not dependent on temperature. Thus, in the following experiments, the temperature of the aqueous solution was set at room temperature.
Effect of pH on the efficiency of water-soluble B extraction from plant samples
The form of B was dependent on pH and the total amount of B in aqueous solution. Variation of pH in the aqueous solution potentially influenced the amount of water-soluble B obtained from the plant. The pH values of the extraction solution were at 3.0, 4.0, 5.0, 6.0, 7.0 and 8.0 for investigation. According to literature reports, the pH in the sap is below 7.0. If the pH of the aqueous solution was >8.5, most of the B in the form of B(OH)3 would be converted to B(OH)4−, which may affect extraction using the proposed method. The results shown in Fig. 4, indicated that the mass fraction of B extracted from the plant did not change obviously when the pH of the extraction solution was altered. Therefore, the pH of the aqueous solution did not significantly influence the extraction coefficient in this method. Since the pH of the aqueous solution did not need to be adjusted, ultra-pure water was used as the extraction solution for the separation of water-soluble B in subsequent experiments.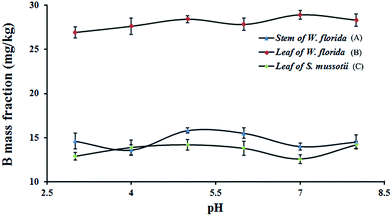 | ||
| Fig. 4 Variation of the mass fraction of B extracted from plant samples at different pH. (A) Stem of W. florida; (B) leaf of W. florida; (C) leaf of S. mussotii. | ||
Effect of soaking times on the efficiency of water-soluble B extraction from plant samples
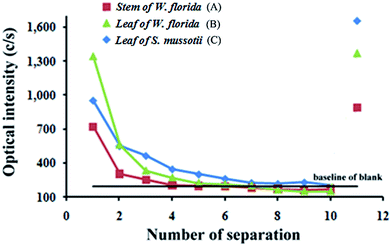
Under the optimum conditions (extraction time at 20 min, with neutral aqueous solution at room temperature), the effect of soaking times on the separation efficiency between water-soluble and structural B was explored. Finally, the plant residues were digested by dry ashing at 600 °C to determine the amount of B after ten extractions.24,25 The residue after ashing was dissolved in 1.0 mol L−1 HCl solution and diluted to 10 mL for determination of structural B by ICP-OES. The results are shown in Fig. 5.It is apparent that the optical intensities for stem and leaf of W. florida and leaf of S. mussotii (724, 1344 and 952 cps, respectively) in the first extraction were decreased to that of the blank (194 cps) after repeated extractions. After five repeats, the optical intensity for B decreased to level off, indicating that all of the water-soluble B had been extracted. The optical intensities in the eleventh extraction (isolated symbols) were the signals for structural B in the residues reserved from the three samples (891, 1372 and 1655 cps, respectively), which were equal to or larger than those in the first extraction of water-soluble B. This means that even after extraction of water-soluble B ten times, the structural form of B is not dissolved but fixed in the tissue. The results demonstrated that the developed method could successfully separate water-soluble B and structural B from plant samples. For the following experiments, therefore, five repeats were sufficient to completely separate water-soluble B from plant samples.
Linear range, limits of detection and repeatability
A calibration curve was obtained under the optimized conditions. The linear range for B was from 5–100 mg kg−1 for different plant tissue samples. The limit of detection, based on a signal-to-noise ratio of three, was 2 mg kg−1 with a correlation coefficient of 0.998 and a relative standard deviation of 2.3%. The reproducibility of the method was investigated in six replicate experiments under the optimized conditions.Real plant sample analysis
Several samples, including root, leaf and stem of W. florida, root, leaf, and stem of S. mussotii, flower and stem of Cynomorium songaricum, stem of Halenia elliptica, Pyrus spp., Citrus maxima, and Malus pumila, were selected to determine the feasibility of the method and to investigate the variation of mass concentration in water-soluble and structural B. After five extractions of water-soluble B from the plant samples, B was determined in the sixth extraction to assess whether the same extraction efficiency could be achieved using the method. The optical intensities in the sixth extractions of these samples are apparent that the optical intensities of the 12 samples were around that of the blank, with an average intensity of 194 cps (n = 12), indicating that five extractions were sufficient for complete separation of water-soluble and structural B from the plant samples.This method was then successfully applied to the separation and analysis of B of the two forms within the plants. The samples were collected from Shandong province and the Qinghai-Tibet Plateau area. The mass fractions of B in the plant samples were determined and confirmed by comparing with the results in a standard addition calibration. To validate the method, the mass fractions of water-soluble and structural B obtained from one sample were compared with those for total B obtained using the dry ashing method (Table 1). The mass concentrations of B in the two forms were in the range of 14.1 ± 2.8 mg kg−1 to 90.9 ± 2.5 mg kg−1 and 27.2 ± 3.2 mg kg−1 to 67.1 ± 1.7 mg kg−1, respectively. In Table 1, it is apparent that the sum variation of B mass fractions in the two phases by the proposed method agreed well with the levels of total B in the corresponding samples. The recoveries of water-soluble and structural B present in real plant samples ranged from 96.1% to 104.7%.
| Plant | Organ | Concentration (mg kg−1) | Added amount (μg) | RSD (%) | Spike recovery (%) | Total B | ||
|---|---|---|---|---|---|---|---|---|
| Concentration (mg kg−1) | RSD (%) | Spike recovery (%) | ||||||
| a Water-soluble B.b Structural B. | ||||||||
| W. florida | Root | 19.8a | 0.1 | 1.8 | 98.7 | 59.1 | 2.7 | 103.9 |
| 38.4b | 0.1 | 2.6 | 103.1 | |||||
| Leaf | 26.7a | 0.1 | 2.2 | 98.8 | 54.7 | 3.6 | 104.2 | |
| 27.2b | 0.1 | 3.2 | 100.9 | |||||
| Stem | 14.1a | 0.1 | 2.8 | 97.7 | 73.3 | 1.9 | 99.2 | |
| 58.2b | 0.1 | 2.4 | 98.1 | |||||
| S. mussotii | Root | 51.2a | 0.1 | 2.1 | 104.7 | 118.9 | 2.8 | 96.4 |
| 67.1b | 0.1 | 1.7 | 104.3 | |||||
| Leaf | 30.4a | 0.1 | 1.9 | 97.7 | 90.7 | 2.6 | 97.8 | |
| 60.9b | 0.1 | 3.2 | 96.1 | |||||
| Stem | 13.7a | 0.1 | 2.8 | 102.4 | 64.4 | 2.8 | 101.7 | |
| 50.4b | 0.1 | 2.3 | 101.4 | |||||
| C. songaricum | Stem | 21.1a | 0.1 | 3.4 | 103.5 | 79.0 | 1.9 | 96.4 |
| 57.3b | 0.1 | 2.3 | 97.6 | |||||
| Flower | 18.7a | 0.1 | 2.7 | 102.9 | 64.9 | 3.1 | 98.8 | |
| 45.6b | 0.1 | 2.1 | 100.1 | |||||
| H. elliptica | Stem | 26.4a | 0.1 | 2.3 | 102.6 | 79.1 | 3.1 | 100.5 |
| 52.4b | 0.1 | 1.8 | 99.3 | |||||
| Pyrus spp. | 90.9a | 0.1 | 2.5 | 103.7 | 133.6 | 2.8 | 104.3 | |
| 43.6b | 0.1 | 3.4 | 102.3 | |||||
| Citrus maxima | 32.6a | 0.1 | 2.3 | 96.5 | 70.3 | 2.2 | 102.6 | |
| 36.4b | 0.1 | 1.9 | 98.4 | |||||
| Malus pumila | 67.0a | 0.1 | 2.3 | 99.4 | 114.8 | 2.6 | 105.2 | |
| 47.6b | 0.1 | 2.7 | 103.2 | |||||
Conclusions
Non-equilibrium ultrasound-assisted solid–liquid phase extraction combined with ICP-OES was successfully used to separate and determine B present in different phases within plant samples. In the method, a self-manufactured apparatus was used to extract water-soluble B from the samples. Extraction conditions, including extraction time, extraction temperature, pH of the aqueous solution, and the soaking times were optimized. Real plant samples were analysed using the proposed method. The results from the developed method showed a good extraction efficiency of water-soluble B from structural B and good agreement with the total B in the same plant sample. The results demonstrate that separation of B in the two forms by this method can provide important insight to enable studies into the molecular mechanisms in the uptake of B in plants and phyto foods.Conflicts of interest
There are no conflicts to declare.Acknowledgements
This work was supported by the Program for Natural Science Foundation of China (Grant No. 41403005 and 41673007), the Program for Natural Science Foundation of Shandong Province, China (Grant No. ZR2014DL007) and the Project of Shandong Province Higher Educational Science and Technology Program (Grant No. J15LC11).Notes and references
- D. G. Blevins and K. M. Lukaszewski, Annu. Rev. Plant Physiol. Plant Mol. Biol., 1998, 49, 481–500 CrossRef CAS PubMed.
- V. M. Dembitsky, R. Smoum, A. A. Al-Quntar, H. A. Ali, I. Pergament and M. Srebnik, Plant Sci., 2002, 163, 931–942 CrossRef CAS.
- L. Dinca and R. Scorei, J. Nutr. Ther., 2013, 2, 22–29 CAS.
- M. M. Shaaban, Am. J. Plant Physiol., 2010, 5, 224–240 CrossRef CAS.
- C. Hunt, J. Trace Elem. Med. Biol., 2012, 26, 157–160 CAS.
- M. A. O'Neill, T. P. Ishii, P. Albersheim and A. G. Darvill, Annu. Rev. Plant Biol., 2004, 55, 109–139 CrossRef PubMed.
- T. Ishii and T. Matsunaga, Carbohydr. Res., 1996, 284, 1–9 CrossRef CAS.
- H. Hu, S. C. Penn, C. B. Lebrilla and P. H. Brown, Plant Physiol., 1997, 113, 649–655 CrossRef CAS PubMed.
- K. Eggert and N. von Wirén, Plant Soil, 2016, 402, 63–76 CrossRef CAS.
- N. Güra, T. C. Onur and H. Böcük, Chemosphere, 2016, 157, 1–9 CrossRef PubMed.
- G. D. Liu, X. C. Dong, L. C. Liu, L. S. Wu, S. A. Peng and C. C. Jiang, Physiol. Plant., 2015, 153, 513–524 CrossRef CAS PubMed.
- P. Roux, D. Lemarchand, H. J. Hughes and M. P. Turpault, Geostand. Geoanal. Res., 2015, 39, 453–466 CrossRef CAS.
- R. Wongkittipong, L. Prat, S. Damronglerd and C. Gourdon, Sep. Purif. Technol., 2004, 40, 147–154 CrossRef CAS.
- Y. P. Teoh and D. M. Mat, Int. J. Solids Struct., 2013, 2, 57–62 Search PubMed.
- D. M. Teixeira, R. F. Patão, A. V. Coelho and C. T. da Costa, J. Chromatogr. A, 2006, 1103, 22–28 CrossRef CAS PubMed.
- I. Valdivielso, M. Á. Bustamante, J. C. R. de Gordoa, A. I. Nájera, M. de Renobales and L. J. R. Barron, Food Chem., 2015, 173, 709–717 CrossRef CAS PubMed.
- I. De La Calle, M. Costas, N. Cabaleiro, I. Lavilla and C. Bendicho, Food Chem., 2013, 138, 234–241 CrossRef CAS PubMed.
- J. L. Capelo, M. M. Galesio, G. M. Felisberto, C. Vaz and P. J. Costa, Talanta, 2005, 66, 1272–1280 CrossRef CAS PubMed.
- J. L. Capelo, C. Maduro and C. Vilhena, Ultrason. Sonochem., 2005, 12, 225–232 CrossRef CAS PubMed.
- N. A. Al-Dhabi, K. Ponmurugan and P. M. Jeganathan, Ultrason. Sonochem., 2017, 34, 206–213 CrossRef CAS PubMed.
- T. Jerman, P. Trebše and M. B. Vodopivec, Food Chem., 2010, 123, 175–182 CrossRef CAS.
- Y. Picó, Trends Anal. Chem., 2013, 43, 84–99 CrossRef.
- I. De La Calle, N. Cabaleiro, I. Lavilla and C. Bendicho, J. Hazard. Mater., 2013, 260, 202–209 CrossRef CAS PubMed.
- A. D. Sun, Q. C. Xu, L. H. Liu, Y. L. Zhang and S. J. Xu, Chin. J. Anal. Chem., 2014, 42, 83–87 CAS.
- M. Rosner, W. Pritzkow, J. Vog and S. Voerkelius, Anal. Chem., 2011, 83, 2562–2568 CrossRef CAS PubMed.
| This journal is © The Royal Society of Chemistry 2017 |

