 Open Access Article
Creative Commons Attribution 3.0 Unported Licence
Structural and ferroelectric properties of perovskite Pb(1−x)(K0.5Sm0.5)xTiO3 ceramics†
Arun Kumar Yadava,
Anitaa,
Sunil Kumar a,
Anjali Panchwaneec,
V. Raghavendra Reddyc,
Parasharam M. Shirage
 ab,
Sajal Biringd and
Somaditya Sen
 *ab
*ab
aDiscipline of Metallurgy Engineering and Materials Science, Indian Institute of Technology, Khandwa Road, Indore-453552, India. E-mail: sens@iiti.ac.in
bDiscipline of Physics, Indian Institute of Technology, Khandwa Road, Indore-453552, India
cUGC-DAE Consortium for Scientific Research, University Campus, Khandwa Road, Indore-452001, India
dElectronic Engg., Ming Chi University of Technology, New Taipei City, Taiwan
First published on 11th August 2017
Abstract
PbTiO3 has the highest tetragonal distortion (c/a ∼ 1.064) and highest spontaneous polarization among perovskite titanates. But, it is hazardous and hence one needs to reduce Pb content by substituting or reducing Pb content for use in practical applications. Pb(1−x)(K0.5Sm0.5)xTiO3 (0 ≤ x ≤ 0.5) perovskite powders were synthesized by sol–gel process, where Pb2+ was replaced by a combination of K0.51+Sm0.53+ (equivalent charge and comparable ionic radius) providing an excellent substitution model to study changes in structural and electrical properties. Vibrational properties and dielectric properties are modified with substitution. A polar tetragonal to a nearly nonpolar cubic phase transition decreases to lower temperatures with substitution due to the reduction of the lattice strain with substitution. Ferroelectricity is retained even for x = 0.5, which has a nearly cubic phase and makes the material technologically important.
1. Introduction
Properties like ferroelectricity, piezoelectricity, and pyroelectricity were discovered in perovskite ABO3 compounds. Ferroelectrics are used in energy conversion devices, ultrasonic medical diagnostic apparatus, ultrasonic non-destructive detectors, pyroelectric infrared sensors and magnetoelectric sensors.1–3 Pb-based ceramics are used in sensors, actuators, capacitors, nonvolatile memories, ultrasonic transducers, high piezoelectric, electromechanical and electro-optic properties etc.4,5 PbTiO3 has a structural phase transition from tetragonal (P4mm) to cubic (Pm3m) at 763 K. It has a highly strained lattice due to strong orbital hybridization and subsequent non-centrosymmetric lattice distortion. Among the perovskites, PbTiO3 has the highest tetragonal distortion (c/a ∼ 1.064) which makes it significantly more ferroelectric with the highest spontaneous polarization.6,7 But, Pb not being an environmental friendly material due to highly toxic nature of Pb, there is a necessity to reduce the Pb content for applications from the point of view of safety and health concerns. Substituted PbTiO3 compounds have been explored to investigate the science and applicability of these materials. A few such ferroelectric ceramics materials are Pb(Mg1/3Nb2/3)O3–xPbTiO3, Ba(Mg1/3Nb2/3)O3–xPbTiO3, Ba(Zn1/3Nb2/3)O3–xPbTiO3, Ba(Yb1/2Nb1/2)O3–xPbTiO3, Ba(Sc1/2Nb1/2)O3–xPbTiO3, BaSnO3–xPbTiO3, (1 − x)PbTiO3–xBi(Zn1/2Ti1/2)O3, (1–x)PbTiO3–xBi(Ni1/2Ti1/2)O3, Pb(In1/2Nb1/2)O3–Pb(Mg1/3Nb2/3)O3–PbTiO3, PbHfO3–Pb(Mg1/3Nb2/3)O3–PbTiO3, Pb(Sn, Ti)O3–Pb(Mg1/3Nb2/3)O3–xPbTiO3, Pb(Ho1/2Nb1/2)O3–Pb(Mg1/3Nb2/3)O3–PbTiO3, Pb(Y1/2Nb1/2)O3–Pb(Mg1/3Nb2/3)O3–PbTiO3 and (1 − x)PbTiO3–xBiFeO3 etc.8–19 By making isovalent or aliovalent substitution on the Pb2+ site, lattice anisotropy is reduced. A polar tetragonal to nonpolar cubic phase transition decreases to lower temperatures mostly decreases with substitution as most substitution reduces the lattice strain. Also the phase transition is diffused due to cumulative structural transition resulting from the different TC for a localized region in given system, resulting in a broad peak with temperature in dielectric response rather than sharp peak in normal ferroelectrics.20–22A combination of K0.51+Sm0.53+ provides the same charge and a comparable ionic radius as compared to Pb2+. Thus this combination may provide an excellent substitution model enabling a detailed study of changes in the physical properties. In this study we report for the first time a new series, Pb(1−x)(K0.5Sm0.5)xTiO3 (0 ≤ x ≤ 0.50). Detailed studies of the structure, vibrational, dielectric and ferroelectric properties are analyzed.
2. Materials and methods
Sol–gel processed polycrystalline Pb(1−x)(K0.5Sm0.5)xTiO3 (0 ≤ x ≤ 0.5) (PKST) ceramics were prepared using hydrated Lead(II) nitrate (Pb(NO3)2), Potassium nitrate (KNO3), Samarium oxide and Titanium(IV) bis(ammonium lactato) dihydroxide (TALH) solution as precursors with purity > 99.999% (Alfa Aesar, Puratronic grade). Sm2O3 was dissolved in dilute HNO3. TALH, Pb(NO3)2 and KNO3 were dissolved in double distilled water. Sm and Ti solutions were mixed together and thereafter the K solution was added to form a mixed solution of Sm, Ti and K and stirred for a while. The Pb solution was added to this combined solution. A solution of citric acid and ethylene glycol of 1![[thin space (1/6-em)]](https://www.rsc.org/images/entities/char_2009.gif) :
:![[thin space (1/6-em)]](https://www.rsc.org/images/entities/char_2009.gif) 1 molar ratio was prepared in a separate beaker as gel former and was thereafter added to the mixture. Appropriate amount of ammonium hydroxide was added to the solution to maintain a pH = 8.5. The resultant sols were vigorously stirred and heated at ∼85 °C on a hot plate to form gels. The gels were burnt to form black powders. To de-carbonate and de-nitrate, these powders were heated at 500 °C for 12 h.
1 molar ratio was prepared in a separate beaker as gel former and was thereafter added to the mixture. Appropriate amount of ammonium hydroxide was added to the solution to maintain a pH = 8.5. The resultant sols were vigorously stirred and heated at ∼85 °C on a hot plate to form gels. The gels were burnt to form black powders. To de-carbonate and de-nitrate, these powders were heated at 500 °C for 12 h.
Pellets (diameter ∼ 10 mm; thickness ∼ 1.5 mm) were prepared by uni-axially pressing the carefully grinded powders mixed with a binder PVA solution. The pellets were sintered at 600 °C for 6 h to burn the binder followed by another heating at 1050 °C for 6 h to form mechanically dense pellets. Densities of the samples were estimated from the weights and dimensions of the pellets. The theoretical densities were also estimated using formula weight and volume of unit cells calculated from the refined lattice parameters of the samples. Relative densities range from ∼93%, 94%, 95%, 95%, 95%, 92%, and 91% for compositions with x = 0.06, 0.09, 0.12, 0.18, 0.25, 0.37, and 0.50, respectively.
X-ray diffraction (XRD) was performed using Bruker D2 Phaser X-ray Diffractometer to ensure the phase formation and purity of the sintered samples. Raman spectroscopy was performed using a Czerny–Turner type achromatic spectrograph with spectral resolution of 0.4 cm−1/pixel and excitation of 632.8 nm. Microstructure and the grain size analysis of the sintered pellets were investigated by Supra55 Zeiss field emission scanning electron microscope. Electrodes were prepared using silver paste painted on both sides of the sintered pellet. Silver coated pellets were cured at 550 °C for 10 minutes. Before doing the measurement, we heated the samples at 200 °C for 10 minutes to avoid any moisture content.
A Newtons 4th LTD PSM 1735 LCR meter was used to study the dielectric properties. Ferroelectric (P–E) studies were carried out by ferroelectric loop (P–E) tracer (M/s Radiant Instruments, USA). During the ferroelectric measurements, the samples were immersed in silicone oil to prevent electric arcing, at high applied voltages.
3. Results and discussion
3.1 Structural properties
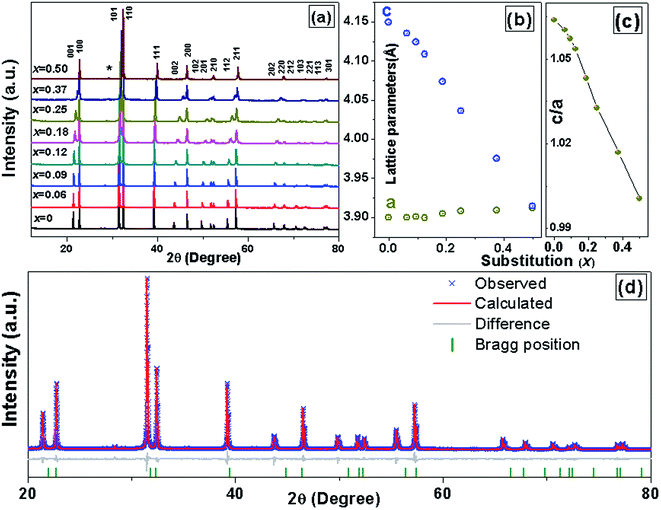
X-ray powder diffraction (XRD) patterns of the PKST powders with 0 ≤ x ≤ 0.5, were analyzed after crushing the pellets sintered at 1050 °C. The XRD patterns are shown in Fig. 1a. With increasing substitution, the separation between the (001) and (100) peaks reduces. All the compositions belong to a tetragonal space group P4mm phase. A very weak XRD peak (indicated with star symbol) belonging to the PbTiO3 related compound Pb2Ti2O6 which has same composition as of PbTiO3 but crystal structure is a pyrochlore (A2B2O7-type) with one vacant oxygen site23 [Fig. 1a]. A Le Bail profile fitting of the XRD data was done with Topas3.2 software to estimate the lattice parameters. The goodness of the fitting for x = 0.06 is shown in Fig. 1d. Lattice parameter ‘c’ decreases with increasing composition x, while ‘a’ is almost constant (Fig. 1b). Hence the c/a ratio decreases to ∼1 for x = 0.5 (Fig. 1c). The variation of lattice parameters with composition is also a signature of proper substitution of Pb by K/Sm.In perovskite ABO3 samples, tolerance factor is a quantitative measure of the mismatch between the bonding requirements of A and B-site cations and subsequently reflects structural distortions such as rotation/tilt of the B-octahedral. Lattice stability and distortion of crystal structures are related to this mismatch24 and hence can be estimated from the tolerance factor (t), given by,
 | (1) |
Room temperature Raman spectroscopy [Fig. 2] was done to qualitatively assess retention of domain structure, defects and structural distortions and thereby understand deformations and lattice strains associated with substitution in PKST. All the observed modes belong to pure PbTiO3 having tetragonal space group symmetry (C14v) with 12 optical modes attributed to three A1-symmetry modes, eight E-symmetry modes (four degenerate pairs) and a B1-symmetry mode.27–29
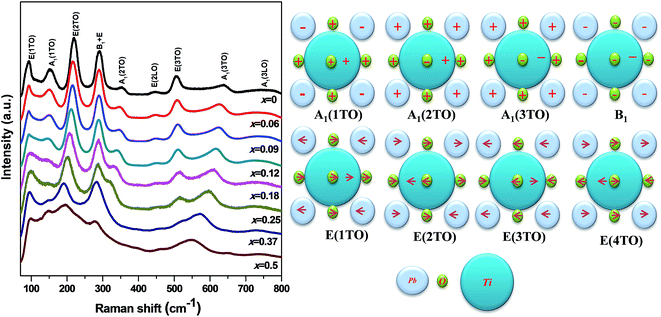 | ||
| Fig. 2 (Left) Raman spectra of Pb(1−x)(K0.5Sm0.5)xTiO3 samples at room temperature. (Right) Cartoon shows different modes and their related vibration type.27 | ||
Intensity of the A1(1TO), A1(2TO) and A1(3TO) reduces with increasing substitution. Among the A1 modes the most intense mode is A1(1TO). This mode merges with the E(1TO) mode to form the T1u mode in the cubic form. The A1(1TO) mode is due to oscillations of the Ti-octahedra (i.e. Ti and O together) relative to Pb ions.30 This mode does not soften much but nearly vanishes after x = 0.09 and reappears again for 0.25 ≤ x ≤ 0.5. The A1(2TO) mode is due to oscillations of the Ti ion relative to O and Pb ions. This mode softens nominally until x = 0.09 but thereafter drastically softens to merge with the E(2TO) mode in x = 0.5. A similar but less drastic trend is observed for the A1(3TO) mode, in which the Ti ions and the apical O ions together form a chain and vibrates along the c-axis with respect to the Pb and the other O atoms. From all these three modes it is understood that relative motion between the Pb, Ti and O ions reduces along the c-axis with substitution. In Fig. 2, we have shown a pictorial representation of all the vibrational modes of PbTiO3. The corner gray ions represent Pb while the central blue ones represent Ti ions. The smaller green spheres represent oxygen ions. All the ions lie on the x–y basal plane. The plus sign represents ions vibrating out of the plane of paper while minus represents the opposite direction. The directions of the in-plane vibrations are shown by the arrows.
The tetragonal PbTiO3 is a strained lattice. The strain originates from a very strong hybridization between Pb(6s2)–O(2p) and also due to a moderate Ti(3d)–O(2p) hybridization.2,31 As a result of substitution of Pb by K/Sm, we expect a reduction of the strong Pb(6s2)–O(2p) bond. This reduction in the strength of the bond reduces energy of vibration which is reflected in the softening of the A1(2TO). Such a reduction in energy in the A1(1TO) mode is not observed as in this mode, the A-site is freely oscillating with respect to the Ti–O octahedron. However the lesser number of oscillators reduce the intensity of A1(1TO) and A1(2TO). Note that the E(3TO) mode gains energy with the substitution. The lower mass of K/Sm compared to Pb may be a reason for the same.
The most noticeable significance of the Raman measurement is that even at x = 0.50 we observe all the modes where from XRD c/a ∼ 1. Such an observation hints at the fact that a remnant strain which may or may not be related to the tetragonal structure is retained in the high x samples. In the cubic mode, pure PbTiO3 does not have any Raman mode, as all the A1(TO) and E(TO) modes merge and vanish gradually at the phase transition.27
FESEM images of PKST ceramic samples are recorded in 0.06 ≤ x ≤ 0.50 range (Fig. 3). Grains are closely packed in all the samples. The average grain size calculated from the FESEM is 1.19 ± 0.53 μm for the composition with x = 0.06 which decreases to 0.98 ± 0.37 μm for x = 0.50. The average grain size seams to decrease nominally with increasing K/Sm substitution. This behavior could be attributed to lower diffusivity of rare earth during sintering. Similar behavior has been observed in other rare earth doped perovskites and layered perovskites.32,33
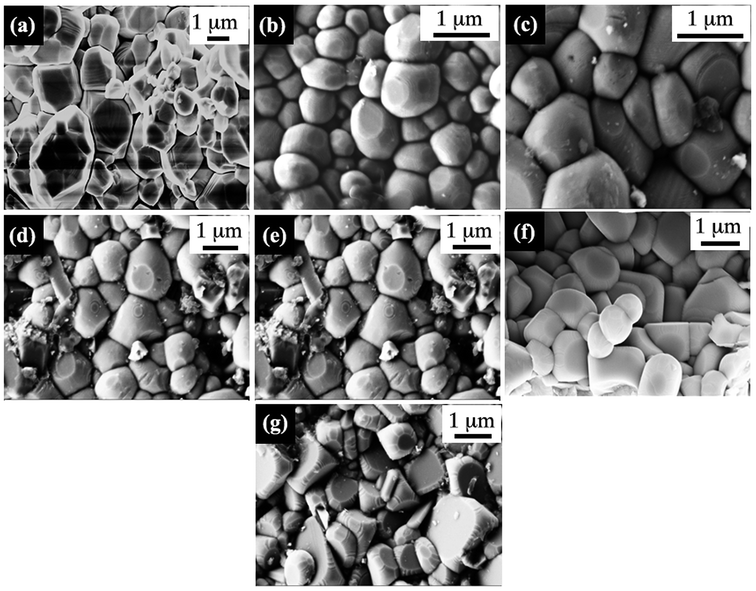 | ||
| Fig. 3 Microstructure analysis of Pb(1−x)(K0.5Sm0.5)xTiO3 samples, (a) x = 0.06, (b) x = 0.09, (c) x = 0.12, (d) x = 0.18, (e) x = 0.25, (f) x = 0.37, and (g) x = 0.50 compositions. | ||
3.2 Dielectric properties
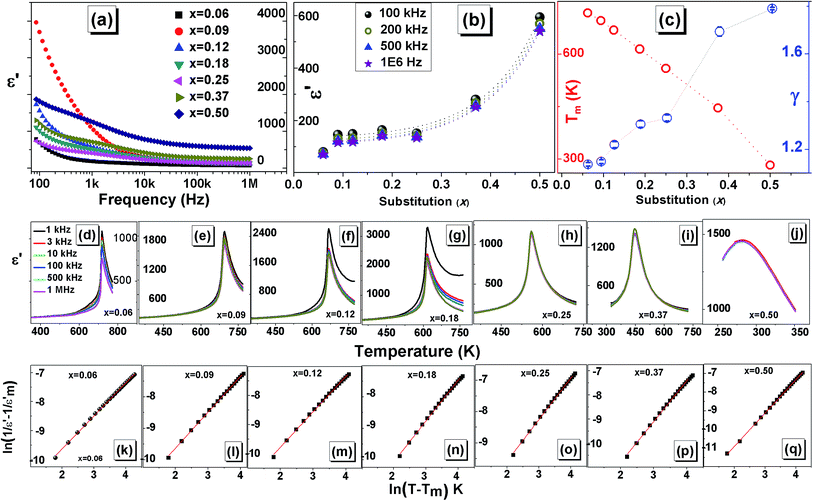
Room temperature (RT) dielectric properties were measured as a function of frequency for PKST (0.06 ≤ x ≤ 0.50). As shown in Fig. 4a and 1S,† with increasing frequency the value of dielectric constant (ε′) and loss (tan![[thin space (1/6-em)]](https://www.rsc.org/images/entities/char_2009.gif) δ) decrease at low frequency range (100 Hz to 10 kHz) and remains almost constant in high frequency region. Space charge polarization may contribute to higher values of dielectric constant. We observe that with increasing substitution, the value of ε′ of PKST ceramics increases exponentially [Fig. 4b]. This behavior of ε′ at room temperature and similar trend in tan
δ) decrease at low frequency range (100 Hz to 10 kHz) and remains almost constant in high frequency region. Space charge polarization may contribute to higher values of dielectric constant. We observe that with increasing substitution, the value of ε′ of PKST ceramics increases exponentially [Fig. 4b]. This behavior of ε′ at room temperature and similar trend in tan![[thin space (1/6-em)]](https://www.rsc.org/images/entities/char_2009.gif) δ can be attributed to the higher dipolar polarizability of K/Sm than Pb.34,35 For x = 0.50, ε′ increases rapidly probably due to its near room temperature phase transition.
δ can be attributed to the higher dipolar polarizability of K/Sm than Pb.34,35 For x = 0.50, ε′ increases rapidly probably due to its near room temperature phase transition.
To study the phase transition in PKST and other dielectric properties, capacitance and dielectric loss factor were measured over the temperature range of 300–773 K at various frequencies in 1 kHz to 1 MHz range. It was quite difficult to fabricate a pure phase, sufficiently dense and mechanically robust PbTiO3 pellet. Hence, dielectric properties of PbTiO3 phase were not investigated.
Pure PbTiO3 undergoes a sharp ferroelectric to paraelectric transition accompanied by a structural transition from polar tetragonal to non-polar cubic phase.36 In such ferroelectrics, we observe maxima in the ε′–T data, associated with this phase transition. For PbTiO3 the reported phase transition temperature is around 763 K (Curie temperature). In the PKST samples this phase transition temperature (Tm) varies from 680 K for x = 0.06 to 341 K as in x = 0.50. Note that the transition temperature is not frequency dependent; thereby the samples are not relaxors.
The phase transition temperature approximately decreases linearly with substitution [Fig. 4c]. The Pb 6s2 lone pair helps in stabilizing the tetragonal strain (∼6%) in PbTiO3.37 We have shown from our XRD and Raman analysis that with increasing substitutions the tetragonal strain is relieved in PKST. The reduction of tetragonal distortion reduces with substitution thereby requiring lesser thermal energy to achieve centrosymmetric cubic structure. Therefore with increasing x, phase transition temperature decreases. Similar trend has been observed in other perovskite related ferroelectrics.38
Another feature in [Fig. 4d to j] is an apparent increase in diffuseness of peak in ε′–T plots. Diffuse phase transition is usually observed in perovskites with random distribution of different types of ions on structurally identical sites in lattice. It must be noted that diffuse phase transition exhibit a broad change of structure and properties at the Curie point compared to a sharp peak in normal ferroelectric materials;39–41 consequently, the phase transition characteristics of such materials are known to diverge from the characteristic of Curie–Weiss behavior and can be described by a modified Curie–Weiss formula.42,43
 | (2) |
 versus ln(T − Tm) curves at a frequency of 1 MHz of PKST ceramics. The slope of linear fit, was found to increase from 1.136 ± 0.007 for x = 0.06 to 1.693 ± 0.019 for x = 0.50 indicating a significant increase in diffuseness of phase transition in doped samples (Fig. 4c). Compositional disorder arising due to the random distribution of K+ and Sm3+ seems to be responsible for observed diffuse phase transition in PKST ceramics.
Impedance spectroscopy enables to determine the various contributions to dielectric constant, such as grain, grain boundaries and electrode effect.44 Impedance of such type of system can be described by the Cole–Cole equation45
 | (3) |
The real (Z′) and imaginary (Z′′) parts of impedance can be written in the following manner:
 | (4) |
 | (5) |
The imaginary, Z′′ (capacitive) and the real, Z′ (resistive) impedances are plotted in Fig. 5. Capacitance due to grain boundary contribution is generally much higher than that of grain.44 This may be due to grains having less resistance than grain boundary. In the Nyquist plot these effects are generally observed as three semicircles; the first smaller one belonging to grain, second grain boundary followed by the electrode contribution. Our results show only one semicircle. This contribution seems to be from the grain as the semicircle starts from origin (high frequency regime) and at high frequency we have observed a steady dielectric constant. Note that, it may possible due to less resistance at grain boundary, its effect suppresses and merge with grain effect. Also note that the resistance of the sample has increased with substitution Fig. 5 (right hand side). The increasing resistance is an indication of better charge retention properties, enhancing the capability of being a polarizable material. Time constant or relaxation time (τ) is multiplication of resistant and capacitance. Accordingly, increase in resistance and capacitance increases the time constant with increase in x. In addition, increase in temperature decreases the relaxation time for all compositions.
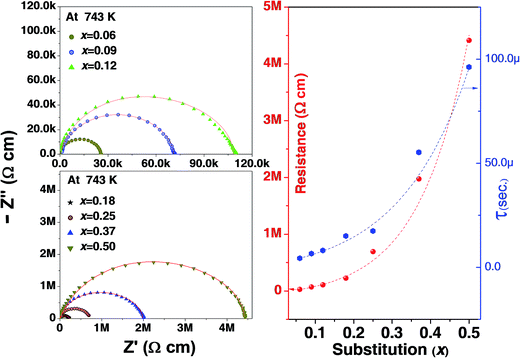 | ||
| Fig. 5 (Left) Nyquist plots of Pb(1−x)(K0.5Sm0.5)xTiO3 samples at 743 K, (Right) resistance and time constant (τ), extracted from fitting of Nyquist-plots by Cole–Cole equation for all the samples. | ||
3.3 Ferroelectric properties
For 0.06 ≤ x ≤ 0.37 the structure is elongated tetragonal type and a strained lattice is expected result in spontaneous polarization. It is to be noted that the tetragonality decreases with substitution until x = 0.5 where the phase is cubic-like. This hints at reducing ferroelectricity with substitution. Also, the Raman modes broaden with increasing x hinting at dispersed vibrational motion of the phonons. The A1(1TO) mode is related to the vibration and distortion of the Ti–O bonds and thereby to ferroelectricity. The mode sustains for all samples although getting diminished with substitution. The dielectric properties show shifting of phase transition towards lower temperatures with increasing x, suggesting existence of ferroelectricity at room temperature.The electric field dependent polarization (P–E hysteresis) and instantaneous current (I–E hysteresis) at 1 Hz frequency have been reported for all the compositions. For 0.06 ≤ x ≤ 0.12, P–E hysteresis loops [Fig. 6] appears to be lossy dielectric type46,47 rather than typical ferroelectric. Also, no signature of domain switching is observed in I–E data for x ≤ 0.12 (Fig. 6). The leaky, lossy nature may be due to comparatively lower resistances of the lesser modified samples (observed from impedance studies). For x > 0.12, the leaky nature decreases and proper hysteresis P–E loops were observed. For x = 0.5, it is expected a non-ferroelectric sample due to its cubic-like structure. However, we find a slim P–E loop with a weak I–E data. This hints at a nearly cubic structure for x = 0.5. A detailed structural work needs to be done on this sample which is beyond the scope of this study. For a maximum applied field of 60 kV cm−1 the sample with x = 0.25 shows highest apparent remnant polarization of 15.9 μC cm−2 and a coercive field of 27.2 kV cm−1. These values reduce with substitution to 2.97 μC cm−2 and 6.91 kV cm−1 in x = 0.5 composition. A comparison of ferroelectric properties and phase transition temperature for a few PbTiO3-based compositions with the compound Pb0.750Na0.125Sm0.125TiO3 (studied in the present investigation) is provided in Table 1.
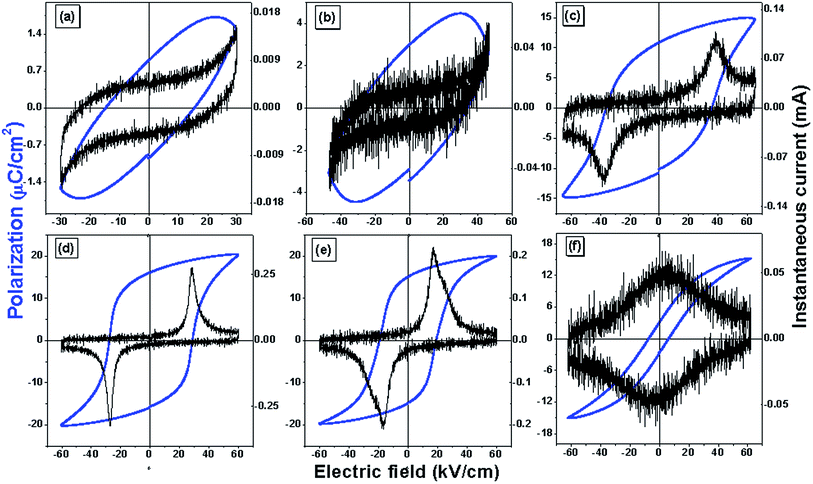 | ||
| Fig. 6 Polarization and instantaneous current versus electric field of Pb(1−x)(K0.5Sm0.5)xTiO3 samples, (a) x = 0.06 (b) x = 0.12 (c) x = 0.18 (d) x = 0.25 (e) x = 0.37 (f) x = 0.50. | ||
| Composition | Remnant polarization (Pr) | Coercive field (Ec) | Applied electric field at room temperature | Tc (phase transition temperature) |
|---|---|---|---|---|
| PbTiO3 single crystal (001) oriented48 | ∼57 μC cm−2 | — | ± 20 kV cm−1 | ∼490 °C |
| Pb(Ho1/2Nb1/2)O3–Pb(Mg1/3Nb2/3)O3–PbTiO3 single crystal (001) oriented18 | ∼24.5 μC cm−2 | ∼3.22 kV cm−1 | ±7.5 kV cm−1 | ∼140 °C |
| Pb(Mg1/3Nb2/3)O3–PbTiO3 (011)-oriented single crystal49 | ∼28.9 μC cm−2 | ∼1.2 kV cm−1 | ±8 kV cm−1 | — |
| PLT8 thin film (Pb1−xLaxTi1−x/4O3 for x = 0.08)50 | ∼18.5 μC cm−2 | ∼144 kV cm−1 | — | ∼330 °C |
| Pb(Zr0.532Ti0.468)O3 ceramics51 | ∼26.2 μC cm−2 | ∼18.4 kV cm−1 | — | ∼359 °C |
| Pb1−xLax(Zr0.52Ti0.48)O3 for x = 0.05 ceramic52 | 8.99 μC cm−2 | 6 kV cm−1 | — | ∼105 °C |
| Pb1−x(K0.5Sm0.5)xTiO3 for x = 0.25 ceramic | 15.9 μC cm−2 | 27.2 μC cm−2 | ±60 kV cm−1 | ∼286 °C |
Improvement of ferroelectric properties at room temperature in PKST samples results from increase of resistive and capacitive properties. In PbTiO3, Pb and O vacancies are a common feature and results in non-stoichiometric samples mostly originating due to high volatility of Pb and subsequent O-vacancies due to missing Pb ions. By K/Sm substitution, Pb content is less, thereby evaporation of volatile matter is reduced. Therefore, Pb vacancies and resultant oxygen vacancies are reduced resulting in more stoichiometric samples. Although K is also volatile, the charge of the K ion is lesser than the Pb ion and hence O vacancies will be lesser. Vacancies play a very important role and enhance the conductivity of materials.53–55 The defect structure can be represented by the Kröger–Vink notation:56
 | (6) |
 | (7) |
Oxygen vacancies in perovskites can contribute to transport by migration from one site to another along the direction of applied high electric field increasing mobility and accumulate in the places with low free energy, such as domain walls and interfaces with electrodes. Accumulation of these oxygen vacancies at the domain boundary causes domain pinning. This restricts polarization switching.57
4. Conclusion
(K0.5Sm0.5) substituted PbTiO3 ceramic samples were synthesized by sol–gel process. X-ray diffraction confirmed a tetragonal P4mm phase. Lattice parameter ‘c’ decreases with increasing composition x, while ‘a’ is almost constant. Raman spectroscopy shows changes in intensity and energy of phonon modes related to tetragonal-cubic phase transformations and lattice strain with ferroelectric property. The lower mass of K/Sm compared to Pb may be a reason for such changes. However, in spite of the tetragonal-near cubic transformation the existence of Raman modes even for x = 0.50 hints at the fact that either some local tetragonality is retained or some other phenomenon apart from a tetragonal structure generates strain which can be attributed to the remnant polarization for x = 0.5 sample. High temperature dielectric study clearly indicates a dielectric phase transition which moves towards lower temperature with increasing substitution. The diffuseness of the phase transition increases with substitution due to compositional disorder arising due to the random distribution of K+/Sm3+. As a result we find changes in ferroelectric property which is for lower substitutions not much of significance due to the leaky nature but with increasing resistance becomes more effective and promising as a ferroelectric. However the remnant polarization decreases with substitution probably due to reduction in tetragonality.Conflicts of interest
There are no conflicts to declare.Acknowledgements
One of the authors Arun Kumar Yadav is thankful to the university Grants Commission to award me fellowship (NFO-2015-17-OBC-UTT-28455). Principle investigator expresses sincere thanks to Indian Institute of Technology, Indore for funding the research and also using the Sophisticated Instrument Centre (SIC) for the research. The authors thank to Mr Rituraj Sharma for providing the Raman facility in IISER Bhopal.References
- H. S. Bhatti, S. T. Hussain, F. A. Khan and S. Hussain, Appl. Surf. Sci., 2016, 367, 291–306 CrossRef CAS.
- H. Zhao, J. Miao, L. Zhang, Y. Rong, J. Chen, J. Deng, R. Yu, J. Cao, H. Wang and X. Xing, Dalton Trans., 2016, 45, 1554–1559 RSC.
- T. F. Zhang, X. G. Tang, Q. X. Liu, Y. P. Jiang, X. X. Huang and Q. F. Zhou, J. Phys. D: Appl. Phys., 2016, 49, 095302 CrossRef.
- E. C. Paris, M. F. C. Gurgel, M. R. Joya, G. P. Casali, C. O. Paiva-Santos, T. M. Boschi, P. S. Pizani, J. A. Varela and E. Longo, J. Phys. Chem. Solids, 2010, 71, 12–17 CrossRef CAS.
- G. Sághi-Szabó, R. E. Cohen and H. Krakauer, Phys. Rev. Lett., 1998, 80, 4321–4324 CrossRef.
- N. Jaouen, A. C. Dhaussy, J. P. Itié, A. Rogalev, S. Marinel and Y. Joly, Phys. Rev. B: Condens. Matter Mater. Phys., 2007, 75, 224115 CrossRef.
- M. Adamiec, E. Talik and K. Wójcik, J. Alloys Compd., 2007, 442, 222–224 CrossRef CAS.
- Q. Wei and J. Cong, Integr. Ferroelectr., 2015, 167, 35–40 CrossRef CAS.
- D. D. Shah, P. K. Mehta, M. S. Desai and C. J. Panchal, J. Alloys Compd., 2011, 509, 1800–1808 CrossRef CAS.
- J. S. Forrester, J. S. Zobec, D. Phelan and E. H. Kisi, J. Solid State Chem., 2004, 177, 3553–3559 CrossRef CAS.
- I. Tomeno, J. A. Fernandez-Baca, K. J. Marty, K. Oka and Y. Tsunoda, Phys. Rev. B: Condens. Matter Mater. Phys., 2012, 86, 134306 CrossRef.
- J. Chen, H. Shi, G. Liu, J. Cheng and S. Dong, J. Alloys Compd., 2012, 537, 280–285 CrossRef CAS.
- M. Algueró, P. Ramos, R. Jiménez, H. Amorín, E. Vila and A. Castro, Acta Mater., 2012, 60, 1174–1183 CrossRef.
- D. Wang, M. Cao and S. Zhang, J. Eur. Ceram. Soc., 2012, 32, 433–439 CrossRef CAS.
- D. Wang, M. Cao and S. Zhang, Phys. Status Solidi RRL, 2012, 6, 135–137 CrossRef CAS.
- D. Wang, M. Cao and S. Zhang, J. Eur. Ceram. Soc., 2012, 32, 441–448 CrossRef CAS.
- X. Li, Z. Wang, C. He, Y. Liu, X. Long, S. Han and S. Pan, Mater. Lett., 2015, 143, 88–90 CrossRef CAS.
- X. Li, Z. Wang, Y. Liu, C. He and X. Long, CrystEngComm, 2014, 16, 7552–7557 RSC.
- A. K. Yadav, V. Anita, S. Kumar, V. R. Reddy, P. M. Shirage, S. Biring and S. Sen, J. Mater. Sci.: Mater. Electron., 2017, 28, 10730–10738 CrossRef CAS.
- Y. Jia, H. Luo, S. W. Or, Y. Wang and H. L. W. Chan, J. Appl. Phys., 2009, 105, 124109 CrossRef.
- X. P. Jiang, J. W. Fang, H. R. Zeng, B. J. Chu, G. R. Li, D. R. Chen and Q. R. Yin, Mater. Lett., 2000, 44, 219–222 CrossRef CAS.
- R. N. P. Choudhary and J. Mal, Mater. Sci. Eng., B, 2002, 90, 1–6 CrossRef.
- G. Xu, W. He, Y. Zhao, Y. Liu, Z. Ren, G. Shen and G. Han, CrystEngComm, 2011, 13, 1498–1503 RSC.
- D. I. Woodward and I. M. Reaney, Acta Crystallogr., Sect. B: Struct. Sci., 2005, 61, 387–399 CrossRef PubMed.
- I. Grinberg, M. R. Suchomel, P. K. Davies and A. M. Rappe, J. Appl. Phys., 2005, 98, 094111 CrossRef.
- N. Raengthon, C. McCue and D. P. Cann, J. Adv. Dielectr., 2006, 06, 1650002 CrossRef.
- J. D. Freire and R. S. Katiyar, Phys. Rev. B: Condens. Matter Mater. Phys., 1988, 37, 2074–2085 CrossRef CAS.
- J. Frantti, V. Lantto, S. Nishio and M. Kakihana, Phys. Rev. B: Condens. Matter Mater. Phys., 1999, 59, 12–15 CrossRef CAS.
- G. Burns and B. A. Scott, Phys. Rev. Lett., 1970, 25, 167–170 CrossRef CAS.
- C. Sun, J. Wang, P. Hu, M. J. Kim and X. Xing, Dalton Trans., 2010, 39, 5183–5186 RSC.
- V. R. Mastelaro, P. P. Neves, S. R. d. Lazaro, E. Longo, A. Michalowicz and J. A. Eiras, J. Appl. Phys., 2006, 99, 044104 CrossRef.
- X. Chou, J. Zhai, H. Jiang and X. Yao, J. Appl. Phys., 2007, 102, 084106 CrossRef.
- K. Sunil and K. B. R. Varma, J. Phys. D: Appl. Phys., 2009, 42, 075405 CrossRef.
- J. Cheng, S. Yu, J. Chen, Z. Meng and L. E. Cross, Appl. Phys. Lett., 2006, 89, 122911 CrossRef.
- http://ctcp.massey.ac.nz/Tablepol2014.pdf.
- A. Sani, M. Hanfland and D. Levy, J. Solid State Chem., 2002, 167, 446–452 CrossRef CAS.
- H. Sharma, J. Kreisel and P. Ghosez, Phys. Rev. B: Condens. Matter Mater. Phys., 2014, 90, 214102 CrossRef.
- S. Bhaskar, S. B. Majumder and R. S. Katiyar, Appl. Phys. Lett., 2002, 80, 3997–3999 CrossRef CAS.
- J. Chen, Y. Qi, G. Shi, X. Yan, S. Yu and J. Cheng, J. Appl. Phys., 2008, 104, 064124 CrossRef.
- A. A. Bokov, L. A. Shpak and I. P. Rayevsky, J. Phys. Chem. Solids, 1993, 54, 495–498 CrossRef CAS.
- G. Deng, G. Li, A. Ding and Q. Yin, Appl. Phys. Lett., 2005, 87, 192905 CrossRef.
- W. Ji, X. He, W. Cheng, P. Qiu, X. Zeng, B. Xia and D. Wang, Ceram. Int., 2015, 41, 1950–1956 CrossRef CAS.
- L. Liu, D. Shi, Y. Huang, S. Wu, X. Chen, L. Fang and C. Hu, Ferroelectrics, 2012, 432, 65–72 CrossRef CAS.
- J. T. S. Irvine, D. C. Sinclair and A. R. West, Adv. Mater., 1990, 2, 132–138 CrossRef CAS.
- S. Kumar and K. B. R. Varma, Curr. Appl. Phys., 2011, 11, 203–210 CrossRef.
- J. F. Scott, J. Phys.: Condens. Matter, 2008, 20, 021001 CrossRef.
- A. K. Yadav, P. Rajput, O. Alshammari, M. Khan, V. Anita, G. Kumar, S. Kumar, P. M. Shirage, S. Biring and S. Sen, J. Alloys Compd., 2017, 701, 619–625 CrossRef CAS.
- J. P. Remeika and A. M. Glass, Mater. Res. Bull., 1970, 5, 37–45 CrossRef CAS.
- L. Yang, Y. Zhao, S. Zhang, P. Li, Y. Gao, Y. Yang, H. Huang, P. Miao, Y. Liu, A. Chen, C. W. Nan and C. Gao, Sci. Rep., 2014, 4, 4591 CrossRef PubMed.
- S. Chopra, S. Sharma, T. C. Goel and R. G. Mendiratta, Ferroelectrics, 2005, 327, 97–101 CrossRef CAS.
- R. Koduri and L. Marta, J. Phys. D: Appl. Phys., 2006, 39, 4466 CrossRef.
- M. Prabu, I. B. Shameem Banu, S. Gobalakrishnan and M. Chavali, J. Alloys Compd., 2013, 551, 200–207 CrossRef CAS.
- H. Beltrán, E. Cordoncillo, P. Escribano, D. C. Sinclair and A. R. West, J. Appl. Phys., 2005, 98, 094102 CrossRef.
- M. Li, J. Li, L.-Q. Chen, B.-L. Gu and W. Duan, Phys. Rev. B: Condens. Matter Mater. Phys., 2015, 92, 115435 CrossRef.
- L. Liu, H. Fan, L. Fang, X. Chen, H. Dammak and M. P. Thi, Mater. Chem. Phys., 2009, 117, 138–141 CrossRef CAS.
- F. A. Kröger and H. J. Vink, Solid State Phys., 1956, 3, 307–435 Search PubMed.
- N. Yuji, M. Ichiro, G. Yu and M. Masaru, Jpn. J. Appl. Phys., Part 2, 2000, 39, L1259 Search PubMed.
Footnote |
| † Electronic supplementary information (ESI) available. See DOI: 10.1039/c7ra07130b |
| This journal is © The Royal Society of Chemistry 2017 |

