DOI:
10.1039/C7RA07202C
(Paper)
RSC Adv., 2017,
7, 40673-40681
The fabrication of CdS/CoFe2O4/rGO photocatalysts to improve the photocatalytic degradation performance under visible light
Received
29th June 2017
, Accepted 6th August 2017
First published on 18th August 2017
Abstract
A magnetic photocatalyst, CdS/CoFe2O4/rGO, has been successfully prepared via a simple hydrothermal method. The photocatalytic activity of the as-obtained composite photocatalyst was evaluated using the degradation of tetracycline. When compared with single CdS and CoFe2O4, the hybrid material (CdS/CoFe2O4/rGO) can enhance the photocatalytic activity. The photocurrent responses and PL spectra indicate that the composite photocatalyst can effectively separate the electron–hole pairs and restrain their recombination. This was attributed to the high charge carrier mobility of rGO and the heterostructured photocatalytic system, which promotes the separation of charge carriers. In all, the CdS/CoFe2O4/rGO photocatalyst, as a strong magnetic photocatalyst, is promising for further practical application in wastewater treatment.
1. Introduction
Within the background of rapid economic development, environmental governance is gradually being focused upon. Semiconductor mediated photocatalysis has attracted considerable attention because it provides highly efficient and energy saving pathway for disposing wastewater and water purification.
Cadmium sulphide (CdS) is an essential II–VI group semiconductor, which has been studied extensively due to its narrow band gap (Eg = 2.42 eV) at 300 K, high absorption coefficient > 104 and size dependent electronic and optical properties. Therefore, CdS is an attractive candidate as a photocatalyst, which can efficiently absorb visible light.1–4 However, its activity and stability far from satisfying the demand of researchers because of rapid charge recombination and photo-corrosion, which limit its large scale applications.5,6 Also, it is desirable that the photocatalyst material should be easily separable from the reaction system after the degradation of the target pollutant. There are many ways to solve the problems to enhance the photocatalytic activity of CdS, such as the deposition of noble metallic compounds,7,8 the preparation CdS quantum dots9,10 and the formation of heterojunction semiconductors.11,12 A nanocomposite heterostructured system utilizing two semiconductor materials with different band gaps is a novel strategy used to improve the photocatalytic activity. Simultaneously, considering recycling is a necessary factor for an outstanding photocatalyst, we adopted a magnetic material to form a Type II heterojunction with CdS. Recently, spinel cobalt ferrite (CoFe2O4) nanoparticles have attracted a great deal of attention due to their chemical stability, mechanical hardness, magnetocrystalline anisotropy, high coercivity and moderate saturation magnetization.13,14 The large saturation magnetization of novel materials based on CoFe2O4 allows fast and effective separation from an aqueous solution using an external magnet, so CoFe2O4 has been widely applied in the photocatalysis field. For example, Wetchakun15 synthesized a CoFe2O4/CeO2 nanocomposite material by coupling a precipitation method with a hydrothermal method, which was used as a magnetic photocatalyst for degrading organic pollutants. Gupta16 combined CoFe2O4 with TiO2 using a hydrothermal method to degrade chlorpyrifos. Moreover, other composite photocatalysts have also been reported, such as CoFe2O4/graphene,17 CoFe2O4/ZnO,18 CoFe2O4/Ag3PO4 (ref. 19) and so on. Moreover, supports are always used to improve the performance of the photocatalyst. Graphene oxide (GO) or reduced-GO (rGO), a two-dimensional (2D) monolayer of graphitic sp2 hybridized carbon, has been reported as effective for the transfer of photoelectrons due to its high electron mobility, large specific surface area and excellent thermal conductivity20–23 in semiconductor heterojunction materials to enhance the photocatalytic performance, such as AgBr/ZnO/rGO,24 Bi2S3/TiO2/rGO,25 (C16H33(CH3)3N)4W10O32/g-C3N4/rGO,26 Ni@graphene-Cu,27 etc., so the fabrication of graphene-based photocatalysts has been deemed to be one of the most feasible strategies used to optimize the photocatalytic performance.28–30
On account of the above considerations, we now reported the CdS/CoFe2O4/rGO photocatalyst prepared via a hydrothermal method. Tetracycline was chosen as a target pollutant to detect the photocatalytic performance. The results exhibited that both the heterojunction of CdS/CoFe2O4 and rGO played important roles in the photocatalytic activity. This study provides a promising candidate for the efficient removal of tetracycline using an environmentally friendly and economical approach.
2. Experimental
2.1 Chemicals and reagents
Iron(III) nitrate nonahydrate (Fe(NO3)3·9H2O, AR), cobalt nitrate hexahydrate (Co(NO3)2·6H2O, AR) and sodium sulfide (Na2S, AR) were all purchased from Shanghai Chemical Reagent Co., Ltd. Polyvinylpyrrolidone (PVP, AR), ethanol (C2H5OH, 95%), potassium permanganate (KMnO4, AR), graphite power, sodium nitrate (NaNO3, AR), hydrochloric acid (HCl, AR), sulfuric acid (H2SO4, AR) and ethanol (C2H5OH, 95%) were all supplied from Sinopharm Chemical Reagent Co., Ltd. Cadmium chloride hemi(pentahydrate) (CdCl2·2.5H2O, 98%), ethylene glycol (98%, AR), hydrogen peroxide (H2O2, 30%), sodium hydroxide (NaOH, 97%) and L-cysteine (C3H7NO2S, AR) were all purchased from Aladdin Chemistry Co., Ltd. Tetracycline was analytically pure and used without any further purification. Distilled water was used in all our experiments.
2.2 Synthesis
2.2.1 Preparation of GO. Graphene oxide (GO) was synthesized using the modified Hummer's method,31,32 through the natural oxidation of graphite powder. Firstly, 1 g of graphite powder, 2.5 g of NaNO3 and 30 mL of concentrated H2SO4 were added to a 250 mL three-necked flask, then placed in an ice bath and stirred to obtain a homogeneous suspension. Secondly, 4 g of KMnO4 was added to the suspension and stirred for 2 h until the mixture turned green, after that the mixture was cooled down to 0 °C. Subsequently, the resulting dark green suspension was removed from the ice bath and the temperature increased to 40 °C for 20 min. Then, 30 mL of deionized water was added to the reaction mixture and stirred at 98 °C for 30 min. 10 mL of 30% H2O2 and 40 mL of deionized water were added respectively to terminate the reaction when the solution turned dark brown. The final product was collected by precipitation and centrifugation, washed with 30% HCl and dried in vacuo at 60 °C for 10 h.
2.2.2 Preparation of CoFe2O4. Pure CoFe2O4 was synthesized using a traditional hydrothermal method. Briefly, 4 mM Fe(NO3)3·9H2O and 2 mM Co(NO3)2·6H2O were dissolved in 40 mL of ethylene glycol, followed by the addition of 15 mM PVP under mechanically stirring for 30 min to obtain a clear solution. Then, the solution was transferred into a Teflon-lined stainless steel autoclave for hydrothermal treatment at 240 °C for 24 h. After the autoclave was allowed to cool to room temperature naturally, the as-formed precipitate was collected by centrifugation, washed several times with water and ethanol, and dried at 60 °C for 12 h.
2.2.3 Preparation of CdS/CoFe2O4/rGO. CdS/CoFe2O4/rGO was synthesized via a simple hydrothermal method. Briefly, 0.1833 g of CdCl2·2.5H2O and 0.1756 g of L-cysteine were dissolved together in 40 mL of deionized water and stirred for 30 min. Then, the pH was adjusted to pH = 7.0 using 0.1 mol L−1 NaOH, then 0.05 g of CoFe2O4 and 0.05 g of GO were added to the above suspension and allowed to dissolve for 30 min. Then, 0.045 g of Na2S·9H2O was added to the above suspension and stirred for 30 min under a nitrogen atomsphere. Subsequently, the solution was transferred into a Teflon-lined stainless steel autoclave for hydrothermal treatment at 180 °C for 2 h. The suspension was separated using an external magnet and the precipitate was washed with ethanol and water, and dried in vacuo at 60 °C for 24 h. The preparation process of CdS/CoFe2O4/rGO is shown in Scheme 1.
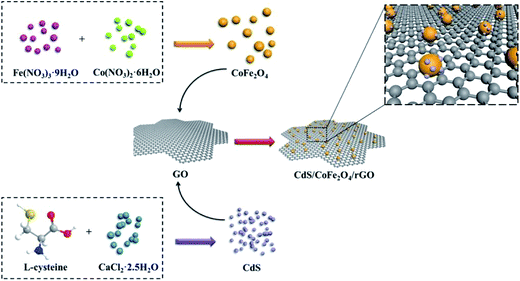 |
| | Scheme 1 A schematic illustration of the formation of CdS/CoFe2O4/rGO. | |
2.3 Characterization
In this work, X-ray diffraction (XRD) patterns were obtained using a D/max-X-ray diffractometer (Rigaku, Japan), which was equipped with Ni-filtrated Cu Kα radiation (40 kV, 30 mA) to characterize the crystal structure. The 2θ scanning angle range was 10–80° at a scanning rate of 5° min−1. Transmission electron microscopy (TEM) images were examined on an F20 S-TWIN electron microscope (Tecnai G2, FEI Co.). The SEM images were collected with S-4800 scanning electron microscopy (HITACHI, Japan). The UV-vis diffuse reflectance spectra (UV-vis DRS) of the photocatalyst power was obtained for the dry-pressed disk samples using a Specord 2450 spectrometer (Shimazu, Japan) equipped with an integrated sphere accessory for diffuse reflectance spectra using BaSO4 as the reference sample. Raman experiments were performed using a DXR spectrometer with a 532 nm laser and the measurements were made in a back scattering geometry. The room-temperature photoluminescence (PL) spectra of the samples were investigated utilizing a Cary Eclipse Spectrophotometer (VARIAN, USA) equipped with a xenon (Xe) lamp. The magnetic measurements were carried out using a vibrating sample magnetometer (VSM) (HH-15, Jiangsu University). The photocurrent and electrochemical impedance spectroscopy (EIS) measurements were conducted on a CHI852C electrochemical workstation and CHI760E workstation, respectively. The ESR signals of the radicals spin-trapped by the spin-trapping reagent 5,5-dimethyl-1-pyrroline N-oxide (DMPO) were investigated on a Bruker EPR A 300-10/12 spectrometer.
2.4 Activity test
The photocatalytic activity test of the as-prepared photocatalyst was investigated by degrading tetracycline with an initial concentration of 20 mg L−1 under visible light irradiation (a 350 W Xe lamp with a 420 nm cut-off filter). In brief, 0.1 g catalyst was dispersed in 100 mL of tetracycline aqueous solution. Before irradiation, the photocatalyst solution was mechanically stirred for 30 min to establish an absorption–desorption equilibrium between tetracycline and the photocatalyst. At given time intervals, small aliquots were sampled and centrifuged twice at 10![[thin space (1/6-em)]](https://www.rsc.org/images/entities/char_2009.gif) 000 rpm for 3 min to remove the photocatalyst nanoparticles and analyzed by recording the variation in the absorption band (358 nm) in the UV-vis spectrum of tetracycline using a UV-vis spectrophotometer. The photocatalytic degradation rate (Dr) was calculated as follows:where η is the Dr; C0 is solution concentration at the end of the dark reaction; Ct is the absorption of the reaction solution.
000 rpm for 3 min to remove the photocatalyst nanoparticles and analyzed by recording the variation in the absorption band (358 nm) in the UV-vis spectrum of tetracycline using a UV-vis spectrophotometer. The photocatalytic degradation rate (Dr) was calculated as follows:where η is the Dr; C0 is solution concentration at the end of the dark reaction; Ct is the absorption of the reaction solution.
2.5 Photoelectrochemical (PEC) measurements
The photocurrent was measured on an CHI852C electrochemical workstation using a standard three-electrode system. The IPCE measurements were carried out in a three-electrode. The CdS, CdS/CoFe2O4 and CdS/CoFe2O4/rGO samples on FTO substrates were used as working electrodes, and Ag/AgCl (saturated KCl) and platinum wire as the reference and counter electrodes, respectively. The working electrode was in the range of 1 cm2 with 0.5 M NaSO4 solution as a supporting electrolyte with 0.5 V versus SCE applied on the photoanode for the photocurrent test on the on-light conditions. EIS measurements were carried out in a three-electrode electrochemical cell on a CHI760E electrochemical workstation. A 0.1 M KCl solution containing 5 mM Fe (CN)63−/4− was used as the electrolyte.
3. Results and discussion
3.1 XRD analysis
The XRD patterns of the CdS (a), CoFe2O4 (b) and CdS/CoFe2O4/rGO (c) samples are displayed in Fig. 1. The diffraction peaks of pure CdS located at 24.8°, 26.5°, 28.1°, 43.6°, 47.7° and 52.7° corresponding to (1 0 0), (0 0 2), (1 0 1), (1 1 0), (1 0 3) and (2 0 1) can be indexed to CdS with a greenockite structure (JCPDS No. 41-1049). Fig. 1b at 2θ of 18.2°, 30.1°, 35.4°, 43.0°, 56.9° and 62.5° are respectively assigned to the (1 1 1), (2 2 0), (3 1 1), (4 0 0), (5 1 1) and (4 4 0) diffraction planes of CoFe2O4 cobalt iron oxide structure (JCPDS No. 22-1086). The sharp and intense peaks illustrate that the samples are well-crystallized. Obviously, the 35.4°, 56.9° and 62.5° diffraction peaks of CoFe2O4 in Fig. 1c become low and even disappear, which is attributed to the CdS deposition on the surface of CoFe2O4 and the diffraction peak of CdS is very distinct, which also reveals the successful formation of an heterojunction between CdS and CoFe2O4. The inset is the XRD pattern of GO, whose diffraction peak is located at 10.9°, but the typical diffraction peak of GO in Fig. 1c almost disappears after the hydrothermal reaction, which was attributed to the content of GO being very low.
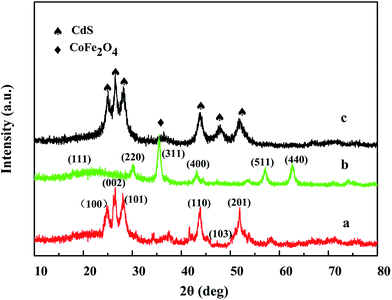 |
| | Fig. 1 The XRD patterns obtained for CdS (a), CoFe2O4 (b), CdS/CoFe2O4/rGO (c). | |
3.2 TEM images
Fig. 2 shows the TEM images of the CdS nanoparticles, CoFe2O4, GO and CdS/CoFe2O4/rGO, respectively. From Fig. 2a, the CdS nanoparticles are seriously aggregated; the main aggregation may be due to the as-prepared CdS nanoparticles with the “small size effect and surface effect” have more opportunities to combine together. From Fig. 2b, CoFe2O4 has a uniform particle size and the size was about 20 nm. The interplanar spacings (d values) were measured to be 0.297 and 0.254 nm, in good agreement with those (0.301 and 0.235 nm) of the (2 2 0) and (3 1 1) crystal planes of the standard CoFe2O4 sample, indicating the CoFe2O4 sample possessed good crystallinity. The observation of multiple bright electron diffraction rings in the SAED patterns (inset of Fig. 2b). Fig. 2c shows that rGO exhibits a typical wrinkled texture and most of the sheets resembled slightly crumpled paper. As shown in Fig. 2d, a relatively uniform distribution of the CdS and CoFe2O4 nanoparticles on the rGO sheets was obtained by the introduction rGO. This may be because an interfacial electron field was established on the interface between the rGO and the CdS and CoFe2O4 nanoparticles.
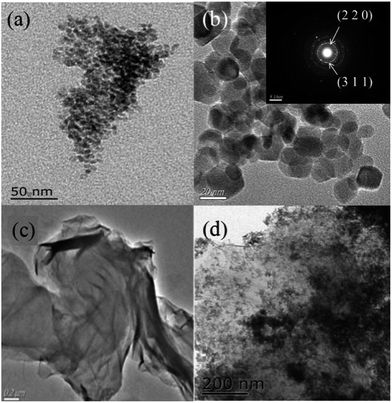 |
| | Fig. 2 TEM images of the (a) CdS nanoparticles, (b) CoFe2O4 nanoparticles; the inset is the CoFe2O4 SAED pattern, (c) GO and (d) magnified CdS/CoFe2O4/rGO. | |
3.3 SEM images
Fig. 3a–c show the different magnification SEM images of CdS/CoFe2O4/rGO. From Fig. 3a, we can clearly see that the surface of the CdS/CoFe2O4/rGO was very rough and the CdS nanoparticles are different in shape, the CdS was homogeneously distributed on the CoFe2O4 and rGO, and the construction of the CdS and CoFe2O4 heterojunction. In Fig. 3b is the magnified image of CoFe2O4 with CdS, which exhibits spherical-like nanoparticles. We intercepted a portion from Fig. 3c to complete the EDX measurement. The corresponding EDX measurement further confirms the existence of the elements Co, Fe, O, Cd, S, C and Au. Quantitative analysis reveals that the atomic ratio of Co and Fe in the hybrid was nearly equal to 1![[thin space (1/6-em)]](https://www.rsc.org/images/entities/char_2009.gif) :
:![[thin space (1/6-em)]](https://www.rsc.org/images/entities/char_2009.gif) 2, which is consistent with the stoichiometric composition of CoFe2O4. Note that the occurrence of the element Au was due to the metal spraying step performed before the SEM measurements.
2, which is consistent with the stoichiometric composition of CoFe2O4. Note that the occurrence of the element Au was due to the metal spraying step performed before the SEM measurements.
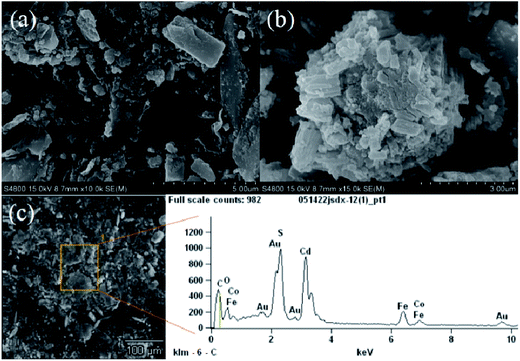 |
| | Fig. 3 The SEM images of CdS/CoFe2O4/rGO. | |
3.4 UV-vis DRS analysis
Fig. 4 shows the UV-vis diffuse reflectance spectra of CdS, CoFe2O4 and the CdS/CoFe2O4/rGO photocatalyst. For pure CdS, a strong absorption located at ca. 557 nm originating from the intrinsic band-edge absorption of the CdS nanoparticles can be seen. Pure CoFe2O4 has a remarkable absorption in the range of 200–800 nm, which may be due to its black color. In contrast, from the absorptions of pure CdS, CoFe2O4 and the CdS/CoFe2O4/rGO nanocomposite, it can be seen that the absorption at all wavelengths was much stronger in the CdS/CoFe2O4/rGO nanocomposite due to the presence of rGO and the formation of the heterojunction between CdS and CoFe2O4. This increase in the absorbance in the visible light region is in accordance with the color change of the photocatalyst from golden yellow to deep brown and should have implications in the photocatalytic capability of the composite.33 The band gap of the samples can be calculated as follows:| | |
α(hν) = A(hν − Eg)n/2
| (2) |
where α, ν, A, Eg and n are the absorption coefficient, light frequency, constant, band gap energy and n = 1 for a direct-band-gap semiconductor and n = 4 for an indirect-band-gap semiconductor.34 Pristine CdS was calculated from the optical absorption (αhν)1/2 versus photon energy plot in accordance with previous studies where CdS has been considered as an direct band gap material. So from Fig. 4, the estimated band-gap values are 2.23 eV and 1.58 eV corresponding to pure CdS and CdS/CoFe2O4/rGO, respectively. This may be ascribed to the accessional sub-band gap energy levels induced by the serious interface and surface defects in the agglomerated nanoparticles.35
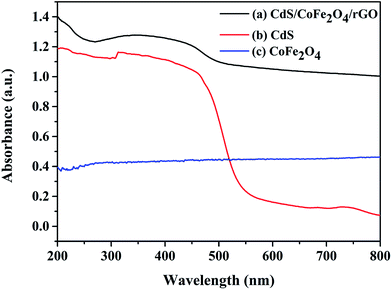 |
| | Fig. 4 The UV-vis diffuse reflectance spectra of CdS and CdS/CoFe2O4/rGO. | |
3.5 Raman spectra analysis
In order to study the bonding properties and defects of graphitic materials, GO and CdS/CoFe2O4/rGO were analyzed by Raman spectroscopy. The sp3 structural defects in carbon and the stretching of the C–C bonds in the graphitic materials seen from D band are ascribed to the G band, which is the typical in-plane vibration of sp2 bonded carbons.36 Fig. 5 shows the spectra of GO and CdS/CoFe2O4/rGO. The Raman spectra shown in Fig. 5 reveals the characteristic D and G bands observed at 1343 and 1589 cm−1 found in GO, respectively. However, the G bands of the as-prepared CdS/CoFe2O4/rGO are shifted to the lower frequency region when compared to the G bands of GO after the hydrothermal process. This phenomenon can be attributed to the recovery of the hexagonal network of carbon atoms with defects.37 The corresponding I(D)/I(G) ratio of GO and CdS/CoFe2O4/rGO in Fig. 5 were calculated to be 0.945 and 1.020, respectively. This increase may due to the high amount of defects after the reaction treatment or remnants of GO.34 We barely observed the characteristic Raman peak of CdS, which may due to the disturbing of the strong fluorescence properties in CdS.38
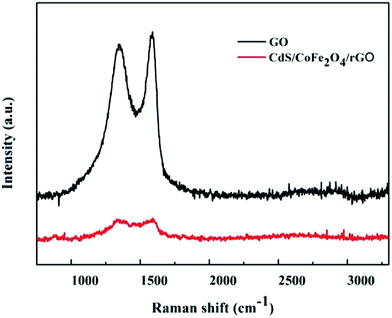 |
| | Fig. 5 The Raman spectra of GO and CdS/CoFe2O4/rGO. | |
3.6 Magnetic properties analysis
The magnetic properties of the as-prepared sample was measured by VSM at room temperature. Fig. 6 shows the hysteresis loops of CoFe2O4 and CdS/CoFe2O4/rGO. The VSM curve of CoFe2O4 shows that the saturation magnetization was 43.58 emu g−1 at 15![[thin space (1/6-em)]](https://www.rsc.org/images/entities/char_2009.gif) 026.85 Oe, which was higher than the photocatalyst. The size and shape anisotropy here play critical roles in determining the magnetic properties.39 With the assembly of the CdS nanoparticles on the surface of CoFe2O4, the saturation magnetization (Ms) of CdS/CoFe2O4/rGO decreased to 14.41 emu g−1 at 15
026.85 Oe, which was higher than the photocatalyst. The size and shape anisotropy here play critical roles in determining the magnetic properties.39 With the assembly of the CdS nanoparticles on the surface of CoFe2O4, the saturation magnetization (Ms) of CdS/CoFe2O4/rGO decreased to 14.41 emu g−1 at 15![[thin space (1/6-em)]](https://www.rsc.org/images/entities/char_2009.gif) 094.50 Oe, such a decrease could be a result of the presence of the non-magnetic component.40 In addition, the remanent magnetization (Mr) of CdS/CoFe2O4/rGO was 623.9 Oe. This result shows that CdS/CoFe2O4/rGO displays the expectant magnetic performance and can be separated and easily recovered from the treated solutions after the liquid-phase photocatalytic degradation reaction (as shown in the photograph of Fig. 6), which can facilitate the practical running of an industrial wastewater treatment process.
094.50 Oe, such a decrease could be a result of the presence of the non-magnetic component.40 In addition, the remanent magnetization (Mr) of CdS/CoFe2O4/rGO was 623.9 Oe. This result shows that CdS/CoFe2O4/rGO displays the expectant magnetic performance and can be separated and easily recovered from the treated solutions after the liquid-phase photocatalytic degradation reaction (as shown in the photograph of Fig. 6), which can facilitate the practical running of an industrial wastewater treatment process.
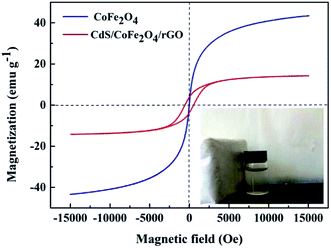 |
| | Fig. 6 The hysteresis loops of CoFe2O4 and CdS/CoFe2O4/rGO under a magnetic field. Inset: a photograph showing the magnetic recycling of the CdS/CoFe2O4/rGO photocatalyst. | |
3.7 Photocurrent response analysis
The photocurrent responses of CdS, CdS/CoFe2O4 and CdS/CoFe2O4/rGO shown in Fig. 7 were explored to investigate the electron generation and recombination behavior in the photocatalytic process. The CdS/CoFe2O4 composites exhibited a higher photocurrent response when compared to pure CdS, indicating that the synergistic effect between CdS and CoFe2O4 does indeed exist, so the separation of the photogenerated electrons and holes was increased. Obviously, the introduction of rGO forming the photocatalyst gave rise to the maximum photocurrent density in which the CdS/CoFe2O4/rGO was higher than that of pure CoFe2O4 and CdS/CoFe2O4 during the “on–off” irradiation cycles, resulting in the enhanced photocatalytic activity.
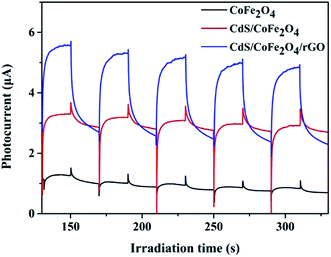 |
| | Fig. 7 The photocurrent-response of CoFe2O4, CdS/CoFe2O4 and CdS/CoFe2O4/rGO in a 0.5 M Na2SO4 aqueous solution under visible light irradiation. | |
3.8 EIS analysis
Electrochemical impedance spectroscopy (EIS) analysis has also been used to examine the state of the charge carriers. As shown in Fig. 8, the diameter of the Nyquist plot obtained for CdS/CoFe2O4/rGO was the smallest at a high frequency. As is known to all, the high frequencies in the EIS spectra correspond to the charge transfer restrained at the contact interface both at the electrode and the electrolyte solution, and the charge transfer resistance can be directly observed by the semicircle radius. The smaller the semi arc in the EIS Nyquist plot denotes the lower recombination of the electron–hole pairs.41,42
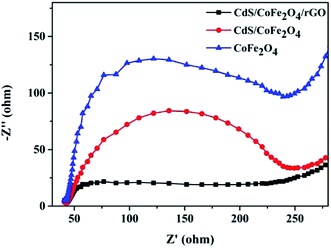 |
| | Fig. 8 Electrochemical impedance spectroscopy of the CoFe2O4, CdS/CoFe2O4 and CdS/CoFe2O4/rGO samples. | |
3.9 PL analysis
In order to examine the charge mobility, we adopted and analyzed the transient fluorescence (FL) of CdS and CdS/CoFe2O4/rGO excited at 337 nm (shown in Fig. 9B). The corresponding radiative lifetimes of the fitting decay curves obtained for CdS and CdS/CoFe2O4/rGO are 3.62 and 1.43 ns, respectively. The relatively shorter decay lifetime of the excited states reveals the faster interfacial electron transfer taking place in the semiconductors or the interfacial attachments and the improved separation of the electron–hole pairs.43 The quenched photoluminescence and the reduced decay lifetime further illuminate the greater separation of the photo-generated electrons and holes occurring at the interfaces of the compounds. CdS/CoFe2O4/rGO with the shorter decay time has an excellent capacity to utilize the charge carriers.
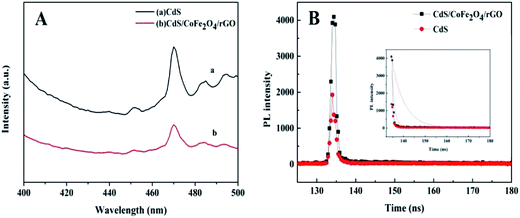 |
| | Fig. 9 The solid PL emission spectra (A) and FL emission decay (B) of CdS and CdS/CoFe2O4/rGO. | |
3.10 Photocatalytic activity
The photocatalytic activities of the as-prepared photocatalysts were evaluated by the degradation of 20 mg L−1 tetracycline under visible light irradiation. In order to discuss the effect different proportion of CoFe2O4 on the photocatalytic activity, from the degradation dynamics curves obtained for tetracycline over the CdS/CoFe2O4/rGO samples with different contents of CoFe2O4 shown in Fig. 10A, 0.05 g of CoFe2O4 in CdS/CoFe2O4/rGO exhibits the highest photocatalytic activity. The introduction of CoFe2O4 has a vital effect on the photocatalytic activity of the catalysts, which may be due to a majority of the electrons generated in the CdS can be transferred to the CoFe2O4 by the loaded sites under visible light irradiation; this additional route for electron transport can decrease the recombination of the electron–hole pairs. Moreover, Fig. 10B displays the photocatalytic capability of CdS, CoFe2O4, GO and CdS/CoFe2O4/rGO via the photodegradation of tetracycline. CdS/CoFe2O4/rGO reveals the best degradation rate of 56.3%, which indicates that CdS/CoFe2O4/rGO possesses the highest photocatalytic activity when compared to the other catalysts studied.
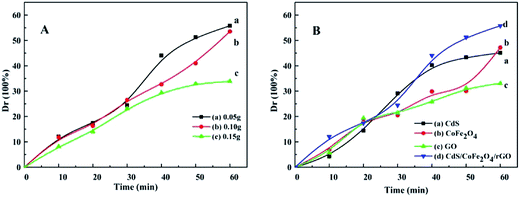 |
| | Fig. 10 The degradation dynamics curves obtained for tetracycline with the different photocatalyst samples under visible light irradiation (A and B): (A) CdS/CoFe2O4/rGO with different CoFe2O4 content, (a) 0.05 g, (b) 0.10 g and (c) 0.15 g. (B) The degradation rate of the different targets (a) CdS, (b) CoFe2O4, (c) GO and (d) CdS/CoFe2O4/rGO. | |
3.11 Stability
The stability of a photocatalyst is a necessary condition in practical application. To investigate the stability of the photocatalyst, recycling experiments for the photo-degradation of tetracycline were carried out and the results are shown in Fig. 11. It is clearly seen that CdS/CoFe2O4/rGO still maintains a high level of activity and does not exhibit an obviously decline after four cycles. CdS/CoFe2O4/rGO has satisfactory reusability during the photocatalytic reaction.
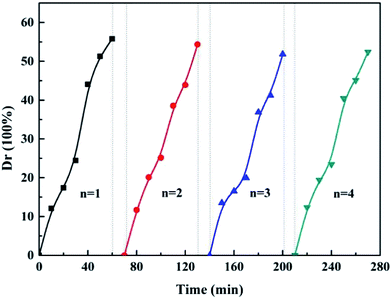 |
| | Fig. 11 The repeated the photocatalytic degradation of tetracycline experiments using the as-prepared CdS/CoFe2O4/rGO. | |
3.12 The mechanism of the pollutant photo-degradation process
The main active species during the photocatalysis process were determined using an electron spin resonance (ESR) spin-trap technique with DMPO, as shown in Fig. 12. Under visible light irradiation, the DMPO–˙O2− adduct over CdS/CoFe2O4/rGO was detected in a methanol dispersion (Fig. 12A). Six characteristic peaks existed in the spectra, which indicated that the photogenerated electrons in the conduction band of photocatalyst can combine with O2 to produce ˙O2− radicals in the process of the photo-degradation reaction. For the DMPO–˙OH signal, there are no or a little characteristic peaks in the spectra, suggesting nearly no ˙OH was produced in the photocatalytic degradation reaction.
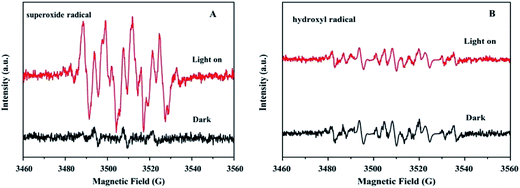 |
| | Fig. 12 The DMPO spin-trapping ESR spectra recorded with the CdS/CoFe2O4/rGO photocatalyst in (A) a methanol dispersion (for DMPO-superoxide radicals) and (B) an aqueous dispersion (for DMPO-hydroxyl radicals) under visible light irradiation. | |
3.13 The proposed mechanisms of the CdS/CoFe2O4/rGO photocatalyst
For the purpose of gaining insight on how to improve the photocatalytic activity of the ternary CdS/CoFe2O4/rGO nanocomposites, the relative band edge of the CdS and CoFe2O4 semiconductors at the point of zero charge were calculated using the following empirical equations:44where ECB and EVB are the conduction band (CB) and the valence band (VB) potentials, Ee is the energy of the free electrons on the hydrogen scale (4.5 eV), X is electronegativity of the semiconductor (the geometric mean of the electronegativity of the constituent atom) and Eg is the band gap energy of the semiconductor. Accordingly, the EVB of CdS and CoFe2O4 were calculated to be 1.88 and 1.98 eV, respectively. Similarly, the ECB of CdS and CoFe2O4 were calculated to be −0.52 and 0.65 eV, respectively.| | |
CdS + hν → CdS (h+ + e−)
| (5) |
| | |
CoFe2O4 + hν → CoFe2O4 (h+ + e−)
| (6) |
| | |
CdS (e−) + CoFe2O4 → CdS + CoFe2O4 (e−)
| (7) |
| | |
CoFe2O4 (h+) + CdS → CoFe2O4 + CdS (h+)
| (8) |
| | |
e− + graphene → graphene (e−)
| (9) |
| | |
O2 + e− (CoFe2O4 and graphene) → ˙O2−
| (10) |
| | |
˙O2− + TC → CO2 + H2O + mineral
| (11) |
| | |
h+ + TC → CO2 + H2O + mineral
| (12) |
Upon irradiation with visible light, the CdS and CoFe2O4 nanoparticles undergo charge separation to yield electrons (e−) and holes (h+) (reactions (5) and (6)). Because the graphene sheets are well known as good acceptors,45 the e− are quickly transferred to the sheets via a percolation mechanism (reaction (9)). Then, the negatively charged e− can react with the dissolved oxygen to produce superoxide anion radicals (reaction (10)) when the e− are transferred from the ECB of CdS to the ECB of CoFe2O4 (reaction (7)) and partial e− of CoFe2O4. Then, the ˙O2− can mineralize TC to generate CO2, H2O and mineral (reaction (11)). Furthermore, the h+ of CoFe2O4 can transfer to CdS and the h+ can oxidize the pollutant.
4. Conclusions
In summary, a novel magnetically separable CdS/CoFe2O4/rGO photocatalyst was successfully prepared using a facile hydrothermal method. The photocatalytic experiments indicate that CdS/CoFe2O4/rGO is a highly active photocatalyst for the degradation TC under the visible light irradiation. Furthermore, the magnetic properties of CdS/CoFe2O4/rGO promote their easy and fast separation from an aqueous solution using an external magnetic field and the CdS/CoFe2O4/rGO could be reused for 4 cycles without any obvious loss in its reactivity under visible light irradiation.
Conflicts of interest
There are no conflicts to declare.
Acknowledgements
We gratefully acknowledge the financial support of the Natural Science Foundation of Jiangsu Province (BK20150484), the China Postdoctoral Science Foundation (2015M570416) and the financial support of the financial support of the Research Foundation of Jiangsu University, China (14JDG148).
References
- X. J. Liu, L. K. Pan, T. Lv, G. Zhu, Z. Sun and C. Q. Sun, Chem. Commun., 2011, 47, 11984 RSC.
- M. Matsumura, S. Furukawa, Y. Saho and H. Tsubomura, J. Phys. Chem., 1985, 89, 1327 CrossRef CAS.
- P. Kumar, P. Singh and B. Bhattacharya, Ionics, 2011, 17, 721 CrossRef CAS.
- K. F. Wu, Z. Y. Chen, H. J. Lv, H. M. Zhu, C. L. Hill and T. Q. Lian, J. Am. Chem. Soc., 2014, 136, 7708 CrossRef CAS PubMed.
- J. Z. Chen, X. J. Wu, L. S. Yin, B. Li, X. Hong, Z. X. Fan, B. Chen, C. Xue and H. Zhang, Angew. Chem., Int. Ed., 2015, 54, 1210 CrossRef CAS PubMed.
- A. Kudo and Y. Miseki, Chem. Soc. Rev., 2009, 38, 253 RSC.
- W. T. Chen, T. T. Yang and Y. J. Hsu, Chem. Mater., 2008, 20, 7204 CrossRef CAS.
- H. J. Yan, J. H. Yang, G. J. Ma, G. P. Wu, X. Zong, Z. B. Lei, J. Y. Shi and C. Li, J. Catal., 2009, 266, 165 CrossRef CAS.
- M. H. Entezari and N. Ghows, Ultrason. Sonochem., 2011, 18, 127 CrossRef CAS PubMed.
- A. J. Hoffman, G. Mills, H. Yee and M. R. Hoffmann, J. Phys. Chem., 1992, 96, 5546 CrossRef CAS.
- Z. Xie, X. X. Liu, W. P. Wang, X. J. Wang, C. Liu, Q. Xie, Z. C. Li and Z. J. Zhang, Nano Energy, 2015, 11, 400 CrossRef CAS.
- C. Han, Z. Chen, N. Zhang, J. C. Colmenares and Y. J. Xu, Adv. Funct. Mater., 2015, 25, 221 CrossRef CAS.
- H. Zheng, J. Wang, S. E. Lofland, Z. Ma, L. Mohaddes-Ardabili, T. Zhao, L. Salamanca-Riba, S. R. Shinde, S. B. Ogale, F. Bai, D. Viehland, Y. Jia, D. G. Schlom, M. Wuttig, A. Roytburd and R. Ramesh, Science, 2004, 303, 661 CrossRef CAS PubMed.
- K. K. Senapati, C. Borgohain and P. Phukan, Catal. Sci. Technol., 2012, 2, 2361 CAS.
- N. Wetchakun, S. Chaiwichain, K. Wetchakun, W. Kangwansupamonkon, B. Inceesungvorn and S. Phanichphant, Mater. Lett., 2013, 113, 76 CrossRef CAS.
- V. K. Gupta, T. Eren, N. Atar, M. L. Yola, C. Parlak and H. Karimi-Maleh, J. Mol. Liq., 2015, 208, 122 CrossRef.
- L. Gan, S. M. Shang, C. W. M. Yuen, S. X. Jiang and E. L. Hu, Appl. Surf. Sci., 2015, 351, 140 CrossRef CAS.
- C. Borgohain, K. K. Senapati, K. C. Sarma and P. Phukan, J. Mol. Catal. A: Chem., 2012, 363–364, 495 CrossRef CAS.
- L. Gan, L. J. Xu and K. Qian, Mater. Des., 2016, 109, 354 CrossRef CAS.
- J. J. Ding, L. Z. Liu, J. J. Xue, Z. W. Zhou, G. Y. He and H. Q. Chen, J. Alloys Compd., 2016, 688, 649 CrossRef CAS.
- W. W. Zhong, A. J. Xu, R. Q. Guo and W. J. Wang, J. Alloys Compd., 2017, 696, 246 CrossRef CAS.
- Y. M. Li, X. J. Lv, J. Lu and J. H. Li, J. Phys. Chem. C, 2010, 114, 21770 CAS.
- J. W. Zhu, G. Y. Zeng, F. D. Nie, X. M. Xu, S. Chen, Q. F. Han and X. Wang, Nanoscale, 2010, 2, 988 RSC.
- H. H. Wang, D. L. Peng, T. Chen, Y. Chang and S. J. Dong, Ceram. Int., 2016, 42, 4406 CrossRef CAS.
- Y. Liu, Y. D. Shi, X. Liu and H. X. Li, Appl. Surf. Sci., 2017, 396, 58 CrossRef CAS.
- X. L. Yang, F. F. Qian, Y. Wang, M. L. Li, J. R. Lu, Y. M. Li and M. T. Bao, Appl. Catal., B, 2017, 200, 283 CrossRef CAS.
- L. Z. Liu, J. J. Xue, X. Y. Shan, G. Y. He, X. Wang and H. Q. Chen, Catal. Commun., 2016, 75, 13 CrossRef CAS.
- M. Khan, M. N. Tahir, S. F. Adil, H. U. Khan, M. R. Siddiqui, A. A. Al-warthan and W. Tremel, J. Mater. Chem. A, 2015, 37, 18753 Search PubMed.
- D. Chen, H. Zhang, Y. Liu and J. H. Li, Energy Environ. Sci., 2013, 6, 1362 CAS.
- T. Y. Liu, B. Liu, L. F. Yang, X. L. Ma, H. Li, S. Yin, T. Sato, T. Sekion and Y. H. Wang, Appl. Catal., B, 2017, 204, 593 CrossRef CAS.
- W. S. Hummers and R. E. Offeman, J. Am. Chem. Soc., 1958, 80, 1339 CrossRef CAS.
- Y. H. Zhang, Z. R. Tang, X. Fu and Y. J. Xu, ACS Nano, 2010, 4, 7303 CrossRef CAS PubMed.
- R. Jiang, H. Y. Zhu, J. B. Li, F. Q. Fu, J. Yao, S. T. Jiang and G. M. Zeng, Appl. Surf. Sci., 2016, 364, 604 CrossRef CAS.
- G. K. Zhang, M. Li, S. J. Yu, S. M. Zhang, B. B. Huang and J. G. Yu, J. Colloid Interface Sci., 2010, 345, 467 CrossRef CAS PubMed.
- N. Kislov, S. S. Srinivasan, Y. Emirov and E. K. Stefanakos, Mater. Sci. Eng., B, 2008, 153, 70 CrossRef CAS.
- M. S. Dresselhaus, A. Jorio, M. Hofmann, G. Dresselhaus and R. Saito, Nano Lett., 2010, 10, 751 CrossRef CAS PubMed.
- L. M. P. Martinez, S. M. Torres, V. Likodimos, P. Falaras, J. L. Figueiredo, J. L. Faria and A. M. T. Sliva, Appl. Catal., B, 2014, 158–159, 329 CrossRef.
- M. J. Zhou, D. L. Han, X. L. Liu, C. C. Ma, H. Q. Wang, Y. F. Tang, P. W. Huo, W. D. Shi, Y. S. Yan and J. H. Yang, Appl. Catal., B, 2015, 172–173, 174 CrossRef CAS.
- Q. Song and Z. J. Zhang, J. Am. Chem. Soc., 2004, 126, 6164 CrossRef CAS PubMed.
- S. Farhadi and F. Siadatnasab, Chin. J. Catal., 2016, 37, 1487 CrossRef CAS.
- L. Wu, J. Li, S. Zhang, L. Long, X. Li and C. Cen, J. Phys. Chem. C, 2013, 117, 22591 CAS.
- W. Zhou, W. Li, J. Q. Wang, Y. Qu, Y. Yang, Y. Xie, K. Zhang, L. Wang, H. Fu and D. Zhao, J. Am. Chem. Soc., 2014, 136, 9280 CrossRef CAS PubMed.
- Y. W. Zhu, S. Murali, W. W. Cai, X. S. Li, J. W. Suk, J. R. Potts and R. S. Ruoff, Adv. Mater., 2010, 22, 3906 CrossRef CAS PubMed.
- K. F. Zhang, Y. X. Liu, J. G. Deng, S. H. Xie, H. X. Lin, X. T. Zhao, J. Yang, Z. Han and H. X. Dai, Appl. Catal., B, 2017, 202, 569 CrossRef CAS.
- I. V. Lightcap, T. H. Kosel and P. V. Kamat, Nano Lett., 2010, 10, 577 CrossRef CAS PubMed.
|
| This journal is © The Royal Society of Chemistry 2017 |
Click here to see how this site uses Cookies. View our privacy policy here.  Open Access Article
 *b and
Peng Lvc
![[thin space (1/6-em)]](https://www.rsc.org/images/entities/char_2009.gif) 000 rpm for 3 min to remove the photocatalyst nanoparticles and analyzed by recording the variation in the absorption band (358 nm) in the UV-vis spectrum of tetracycline using a UV-vis spectrophotometer. The photocatalytic degradation rate (Dr) was calculated as follows:
000 rpm for 3 min to remove the photocatalyst nanoparticles and analyzed by recording the variation in the absorption band (358 nm) in the UV-vis spectrum of tetracycline using a UV-vis spectrophotometer. The photocatalytic degradation rate (Dr) was calculated as follows:
![[thin space (1/6-em)]](https://www.rsc.org/images/entities/char_2009.gif) :
:![[thin space (1/6-em)]](https://www.rsc.org/images/entities/char_2009.gif) 2, which is consistent with the stoichiometric composition of CoFe2O4. Note that the occurrence of the element Au was due to the metal spraying step performed before the SEM measurements.
2, which is consistent with the stoichiometric composition of CoFe2O4. Note that the occurrence of the element Au was due to the metal spraying step performed before the SEM measurements.
![[thin space (1/6-em)]](https://www.rsc.org/images/entities/char_2009.gif) 026.85 Oe, which was higher than the photocatalyst. The size and shape anisotropy here play critical roles in determining the magnetic properties.39 With the assembly of the CdS nanoparticles on the surface of CoFe2O4, the saturation magnetization (Ms) of CdS/CoFe2O4/rGO decreased to 14.41 emu g−1 at 15
026.85 Oe, which was higher than the photocatalyst. The size and shape anisotropy here play critical roles in determining the magnetic properties.39 With the assembly of the CdS nanoparticles on the surface of CoFe2O4, the saturation magnetization (Ms) of CdS/CoFe2O4/rGO decreased to 14.41 emu g−1 at 15![[thin space (1/6-em)]](https://www.rsc.org/images/entities/char_2009.gif) 094.50 Oe, such a decrease could be a result of the presence of the non-magnetic component.40 In addition, the remanent magnetization (Mr) of CdS/CoFe2O4/rGO was 623.9 Oe. This result shows that CdS/CoFe2O4/rGO displays the expectant magnetic performance and can be separated and easily recovered from the treated solutions after the liquid-phase photocatalytic degradation reaction (as shown in the photograph of Fig. 6), which can facilitate the practical running of an industrial wastewater treatment process.
094.50 Oe, such a decrease could be a result of the presence of the non-magnetic component.40 In addition, the remanent magnetization (Mr) of CdS/CoFe2O4/rGO was 623.9 Oe. This result shows that CdS/CoFe2O4/rGO displays the expectant magnetic performance and can be separated and easily recovered from the treated solutions after the liquid-phase photocatalytic degradation reaction (as shown in the photograph of Fig. 6), which can facilitate the practical running of an industrial wastewater treatment process.


