 Open Access Article
Creative Commons Attribution 3.0 Unported Licence
Syngas production: diverse H2/CO range by regulating carbonates electrolyte composition from CO2/H2O via co-electrolysis in eutectic molten salts†
Yue Liu‡
 a,
Dandan Yuan‡
 a,
Deqiang Ji
 a,
Zhida Li
 a,
Zhonghai Zhang
 b,
Baohui Wang
 a and
Hongjun Wu
 *a
*a
aProvincial Key Laboratory of Oil & Gas Chemical Technology, College of Chemistry & Chemical Engineering, Northeast Petroleum University, Daqing 163318, China. E-mail: hjwu@nepu.edu.cn; hjwu1979@163.com
bDepartment of Chemistry, East China Normal University, 500 Dongchuan Road, Shanghai, 200241, China
First published on 13th November 2017
Abstract
We present a novel sustainable method for the direct production of syngas (H2 + CO) from CO2/H2O co-electrolysis using a hermetic device, to address the continuously increasing level of environmental carbon dioxide (CO2). All experiments were conducted using a two-electrode system with a coiled Fe cathode and coiled Ni anode in eutectic mixtures of binary and ternary carbonates with hydroxide in a 0.1![[thin space (1/6-em)]](https://www.rsc.org/images/entities/char_2009.gif) :
:![[thin space (1/6-em)]](https://www.rsc.org/images/entities/char_2009.gif) 1 hydroxide/carbonate ratio. With an applied voltage of 1.6–2.6 V and an operating temperature of 500–600 °C, the H2/CO product ratio was easily tuned from 0.53 to 8.08 through renewable cycling of CO2 and H2O. The Li0.85Na0.61K0.54CO3–0.1LiOH composite had the highest current efficiency among those tested, with an optimum value approaching ∼93%. This study provides a promising technique for the electrochemical conversion of CO2/H2O to a controllable syngas feedstock that can be used in a broad range of industrial applications.
1 hydroxide/carbonate ratio. With an applied voltage of 1.6–2.6 V and an operating temperature of 500–600 °C, the H2/CO product ratio was easily tuned from 0.53 to 8.08 through renewable cycling of CO2 and H2O. The Li0.85Na0.61K0.54CO3–0.1LiOH composite had the highest current efficiency among those tested, with an optimum value approaching ∼93%. This study provides a promising technique for the electrochemical conversion of CO2/H2O to a controllable syngas feedstock that can be used in a broad range of industrial applications.
Introduction
The ever-increasing combustion of non-renewable fossil fuels due to industrial development is releasing a large amount of carbon dioxide (CO2) into the atmosphere, which has led to a serious greenhouse effect. As CO2 is the main component of greenhouse gases, effectively controlling CO2 generation and emission are urgent issues.1–3 Using photochemical and electrochemical methods for the chemical reduction of CO2 to reverse oxidative degradation is a huge challenge.4–10 Among current technologies, chemical conversion and utilization of CO2 is the most promising because it is both an economic and environmental friendly option. Since the last century, there has been gratifying progress in research on CO2 chemical conversion, especially with respect to the electrode materials, electrolytes, and operating conditions required for electrochemical reduction in molten salts.11–18 Syngas, a mixture of carbon monoxide (CO) and hydrogen (H2), has been cited as an essential precursor to a wide range of high value-added industrial products, such as olefins, fuels, and additives. Conventional syngas production methods include natural gas conversion, heavy oil conversion, and folding airflow bed gasification technology.19–21 However, the high temperatures (over 800 °C) required inevitably consume heat and promote reactor corrosion.22 In comparison, the molten salt electrolysis technique reported herein provides a low-temperature, stable, and safe route to syngas production.In this method, the source of hydrogen (H2) in syngas is LiOH, while carbon monoxide (CO) is sourced from carbonates. The co-electrolysis of CO2/H2O in eutectic molten salts provides a feasible way to produce syngas, which can be used in the Fischer–Tropsch (F–T) process to convert electrical energy to chemical energy.23 Syngas with a H2/CO ratio of 1.7–3.1 was obtained by controlling the H2O/CO2 feed ratio, as reported by Lee.24 Recently, Sastre et al. developed an electrochemical method for converting CO2 and H2O into syngas using a nanostructured Ag/g-C3N4 catalyst, with H2/CO ratios ranging from 100![[thin space (1/6-em)]](https://www.rsc.org/images/entities/char_2009.gif) :
:![[thin space (1/6-em)]](https://www.rsc.org/images/entities/char_2009.gif) 1 to 2
1 to 2![[thin space (1/6-em)]](https://www.rsc.org/images/entities/char_2009.gif) :
:![[thin space (1/6-em)]](https://www.rsc.org/images/entities/char_2009.gif) 1.25 We also demonstrated that, by rational design of the molten salt mixture, a desirable lower temperature (such as 600 °C) led to the highly efficient one-pot generation of syngas via CO2/H2O coelectrolysis with a current efficiency of ∼92% and a H2/CO ratio of 1.96–7.97 in Li1.07Na0.75Ca0.045CO3/0.15LiOH electrolyte.22 This result demonstrates that CaCO3 addition affects the composition of syngas. Using these methods, the CO2/H2O-derived generation of syngas has been achieved. Although syngas has successfully been produced in previous studies using a molten salt medium, H2 is the favored product, often resulting in a H2/CO molar ratio greater than 1. However, there are specific reactions in which a H2/CO molar ratio of less than 1 is needed, such as in alcohol synthesis with a H2/CO ratio of 0.5–2 using K/Cu/Co/Zn/Al catalyst.26 To broaden the utilization range, increasing the selectivity for CO in the syngas would be a significant development.
1.25 We also demonstrated that, by rational design of the molten salt mixture, a desirable lower temperature (such as 600 °C) led to the highly efficient one-pot generation of syngas via CO2/H2O coelectrolysis with a current efficiency of ∼92% and a H2/CO ratio of 1.96–7.97 in Li1.07Na0.75Ca0.045CO3/0.15LiOH electrolyte.22 This result demonstrates that CaCO3 addition affects the composition of syngas. Using these methods, the CO2/H2O-derived generation of syngas has been achieved. Although syngas has successfully been produced in previous studies using a molten salt medium, H2 is the favored product, often resulting in a H2/CO molar ratio greater than 1. However, there are specific reactions in which a H2/CO molar ratio of less than 1 is needed, such as in alcohol synthesis with a H2/CO ratio of 0.5–2 using K/Cu/Co/Zn/Al catalyst.26 To broaden the utilization range, increasing the selectivity for CO in the syngas would be a significant development.
Previously, Chery et al. studied the nature of electrolytes Li2CO3–Na2CO3 (52![[thin space (1/6-em)]](https://www.rsc.org/images/entities/char_2009.gif) :
:![[thin space (1/6-em)]](https://www.rsc.org/images/entities/char_2009.gif) 48 mol%), Li2CO3–K2CO3 (62
48 mol%), Li2CO3–K2CO3 (62![[thin space (1/6-em)]](https://www.rsc.org/images/entities/char_2009.gif) :
:![[thin space (1/6-em)]](https://www.rsc.org/images/entities/char_2009.gif) 38 mol%), Na2CO3–K2CO3 (56
38 mol%), Na2CO3–K2CO3 (56![[thin space (1/6-em)]](https://www.rsc.org/images/entities/char_2009.gif) :
:![[thin space (1/6-em)]](https://www.rsc.org/images/entities/char_2009.gif) 44 mol%), and a ternary mixture of Li2CO3–Na2CO3–K2CO3 (43.5
44 mol%), and a ternary mixture of Li2CO3–Na2CO3–K2CO3 (43.5![[thin space (1/6-em)]](https://www.rsc.org/images/entities/char_2009.gif) :
:![[thin space (1/6-em)]](https://www.rsc.org/images/entities/char_2009.gif) 31.5
31.5![[thin space (1/6-em)]](https://www.rsc.org/images/entities/char_2009.gif) :
:![[thin space (1/6-em)]](https://www.rsc.org/images/entities/char_2009.gif) 25 mol%) by thoroughly analyzing reoxidation and reduction.27 Herein, the CO2 reduction mechanism at a gold electrode in molten carbonates is investigated using cyclic voltammetry. The present work is a systematic exploration of changes in the H2/CO ratio in various binary or ternary carbonates (Li1.51K0.49CO3, Li1.07Na0.93CO3, Li1.43Na0.36K0.21CO3, and Li0.85Na0.61K0.54CO3) mixed with LiOH that favor syngas formation, but inhibit metal deposition,28 with the goal of broadening the H2/CO ratio in syngas. During electrolysis, alkali oxides, which are produced from the decomposition of monovalent alkali carbonate and LiOH, can combine with CO2 and H2O to renew the electrolyte. This regeneration of the carbonate electrolyte affords an advantageous circulation system to give syngas as the final product of CO2/H2O reduction via co-electrolysis in molten salts. Furthermore, the electricity needed for this electrolysis is measured to assess whether electrolysis proceeds with a relatively high current efficiency. In this study, CO2/H2O is synergistically converted into valuable chemicals by electrolyzing molten salts, providing an alternative route to resolve global excessive CO2 emissions and convert conventional electricity to chemical energy.
25 mol%) by thoroughly analyzing reoxidation and reduction.27 Herein, the CO2 reduction mechanism at a gold electrode in molten carbonates is investigated using cyclic voltammetry. The present work is a systematic exploration of changes in the H2/CO ratio in various binary or ternary carbonates (Li1.51K0.49CO3, Li1.07Na0.93CO3, Li1.43Na0.36K0.21CO3, and Li0.85Na0.61K0.54CO3) mixed with LiOH that favor syngas formation, but inhibit metal deposition,28 with the goal of broadening the H2/CO ratio in syngas. During electrolysis, alkali oxides, which are produced from the decomposition of monovalent alkali carbonate and LiOH, can combine with CO2 and H2O to renew the electrolyte. This regeneration of the carbonate electrolyte affords an advantageous circulation system to give syngas as the final product of CO2/H2O reduction via co-electrolysis in molten salts. Furthermore, the electricity needed for this electrolysis is measured to assess whether electrolysis proceeds with a relatively high current efficiency. In this study, CO2/H2O is synergistically converted into valuable chemicals by electrolyzing molten salts, providing an alternative route to resolve global excessive CO2 emissions and convert conventional electricity to chemical energy.
Experimental
Experimental methods
The electrolysis cell consists of an alumina crucible (Al2O3 > 99.9%, φ40 mm, 85 mm in height) filled with binary or ternary mixed carbonates (Li1.51K0.49CO3, Li1.07Na0.93CO3, Li0.85Na0.61K0.54CO3, and Li1.43Na0.36K0.21CO3) and LiOH for the CO2/H2O co-electrolysis experiments, with a total mixed molten salts mass of 80 g. The thermal energy for electrolysis was provided by a specially customized ceramic heating sleeve. Due to inevitable corrosion caused by the electrolytes and high-temperature oxidation, an affordable and corrosion-resistant electrode material was investigated for its long-term stability. Metallic materials Ni (φ1.6 mm, 39.7 cm in length, 20 cm2, Hebei Steady Metal Products Co., LTD, China) and polished Fe (φ1.6 mm, 39.7 cm in length, 20 cm2, Hebei Steady Metal Products Co., LTD, China), both in the form of spiral wires, were used as the anode and cathode, respectively. When the mixed salts reached the pre-set temperature, the two-electrode system was placed into the electrolyte and completely sealed with a sealant and sealing bolt. All electrolysis was performed in the voltage range 1.6–2.6 V. DC power (BK PRECISION 1715A) was used as the power supply for electrolytic production of carbon-based fuels in the electrolyte. The mean gas collection rate was near 120–140 mL min−1, controlled by a volumetric flowmeter. The gaseous products were expelled into a sampling bag through a topside gas-guide tube under argon, which also protected the electroactivity of the electrode.The molar ratio of hydroxide to carbonate in the LiOH and LiNa (LiK, LiNaK) eutectic electrolyte was defined as nH:nC. With nH:nC = 0.1![[thin space (1/6-em)]](https://www.rsc.org/images/entities/char_2009.gif) :
:![[thin space (1/6-em)]](https://www.rsc.org/images/entities/char_2009.gif) 1, the experiments are performed at temperatures of 500–600 °C, with voltage of 1.6–2.6 V applied at each temperature. Table 1 shows the experimental electrolytic conditions in detail.
1, the experiments are performed at temperatures of 500–600 °C, with voltage of 1.6–2.6 V applied at each temperature. Table 1 shows the experimental electrolytic conditions in detail.
| Electrolyte | Temperature/°C | Voltage/V |
|---|---|---|
| Li1.07Na0.93CO3–0.1LiOH | 500 | 1.6, 1.8, 2.0, 2.2, 2.4, 2.6 |
| 525 | 1.6, 1.8, 2.0, 2.2, 2.4, 2.6 | |
| 550 | 1.6, 1.8, 2.0, 2.2, 2.4, 2.6 | |
| 575 | 1.6, 1.8, 2.0, 2.2, 2.4, 2.6 | |
| 600 | 1.6, 1.8, 2.0, 2.2, 2.4, 2.6 | |
| Li1.51K0.49CO3–0.1LiOH | 500 | 1.6, 1.8, 2.0, 2.2, 2.4, 2.6 |
| 525 | 1.6, 1.8, 2.0, 2.2, 2.4, 2.6 | |
| 550 | 1.6, 1.8, 2.0, 2.2, 2.4, 2.6 | |
| 575 | 1.6, 1.8, 2.0, 2.2, 2.4, 2.6 | |
| 600 | 1.6, 1.8, 2.0, 2.2, 2.4, 2.6 | |
| Li1.43Na0.36K0.21CO3–0.1LiOH | 500 | 1.6, 1.8, 2.0, 2.2, 2.4, 2.6 |
| 525 | 1.6, 1.8, 2.0, 2.2, 2.4, 2.6 | |
| 550 | 1.6, 1.8, 2.0, 2.2, 2.4, 2.6 | |
| 575 | 1.6, 1.8, 2.0, 2.2, 2.4, 2.6 | |
| 600 | 1.6, 1.8, 2.0, 2.2, 2.4, 2.6 | |
| Li1.43Na0.36K0.21CO3–0.1LiOH | 500 | 1.6, 1.8, 2.0, 2.2, 2.4, 2.6 |
| 525 | 1.6, 1.8, 2.0, 2.2, 2.4, 2.6 | |
| 550 | 1.6, 1.8, 2.0, 2.2, 2.4, 2.6 | |
| 575 | 1.6, 1.8, 2.0, 2.2, 2.4, 2.6 | |
| 600 | 1.6, 1.8, 2.0, 2.2, 2.4, 2.6 |
Product characterization
Afterwards, the syngas obtained from electrolysis was characterized by gas chromatography (GC, Agilent 7890B) equipped with a thermal conductivity detector (TCD) and hydrogen flame ionization detector (FID) to determine the content of each component. After obtaining the concentration of each substance from the chromatogram, only the cathode fuel gas (methane, hydrocarbons, hydrogen, and carbon monoxide) was calculated. Fourier transform infrared spectroscopy (FTIR, Tensor27) was used to characterize the molecular structure of the products. The current–voltage relationship of different cathode materials (0.5 cm2 surface area) was measured using a Ni wire anode (20 cm2 surface area). Additionally, the current efficiency was calculated from the charge (in Faradays) passed during electrolysis compared to the charge required to form each measured mole of the gaseous products using the following equation:28| ηi = 100 × ni × (mi/MWi) × (Far/Q) | (1) |
![[thin space (1/6-em)]](https://www.rsc.org/images/entities/char_2009.gif) 485C mol−1), and Q is the charge, calculated from I (A) × time (h).28
485C mol−1), and Q is the charge, calculated from I (A) × time (h).28
Results and discussion
Theoretical analysis of hydroxide selection
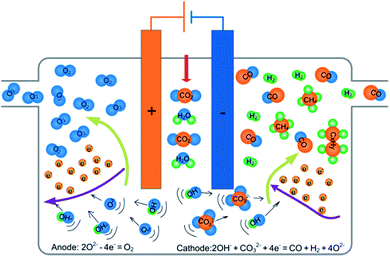
The reduction of CO2/H2O via co-electrolysis of a molten mixture of carbonates and hydroxide can be driven by applying an external force field to the electrolysis unit. As shown in Scheme 1, using a hermetic device, syngas and hydrocarbons are generated from the reaction of OH− and CO32− on the cathode surface, and oxygen is formed by oxidation of O2− on the anode. The intermediate product (metal oxide) in the reaction process can absorb the incoming carbon dioxide and water, generating carbonates and hydroxides to regenerate the electrolyte, which completes the construction of a circulation system.The target product, CO and H2, can be obtained by the coelectrolysis of ionized OH− and CO32− via reaction (2). The generated O2− can be consumed in the following two ways: (i) reaction with CO2 or H2O, regenerating CO32− or OH− according to reactions (3) or (4), and (ii) the oxidation of O2− to produce oxygen via electron loss (reaction (5)).
| 2OH− + CO32− + 4e− = CO + H2 + 4O2− | (2) |
| CO2 + O2− = CO32− | (3) |
| H2O + O2− = 2OH− | (4) |
| 2O2− − 4e− = O2 | (5) |
The reacted OH− in the electrolysis comes from hydroxide. It is necessary to control the source of OH− to keep the produced syngas mixture at the desired H2/CO ratio.
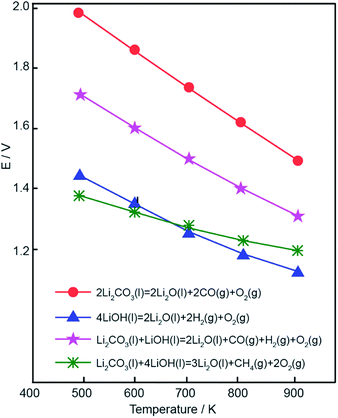
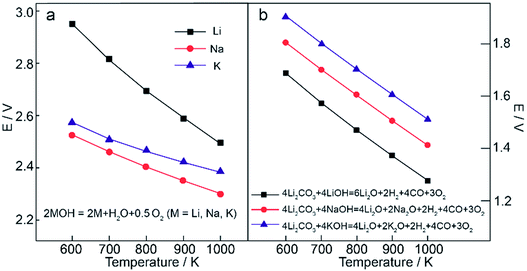
Compared to divalent molten salts, monovalent salts have higher conductivity, lower energy consumption, and give better electrical conductivity for the reduction of carbon dioxide at high temperature.29,30 Basic data was obtained from NIST Chemistry WebBook31 Fig. 1a shows the potential of metal deposition with three kinds of hydroxides. Unlike lithium hydroxide, pure sodium or potassium hydroxide tended to reduce the alkali cation to the alkali metal because of the relatively low metal deposition potentials. When KOH serves as the hydrogen source, K metal required a lower potential than H2, meaning that K metal deposition could become a side reaction.32 Fig. 1b shows the calculated thermodynamic electrolysis potential of various hydroxides as a function of temperature for syngas formation. The electrolysis potential was calculated from the thermochemical enthalpy and entropy of individual species. The formulae can be written as:33
| E° = −ΔG°/n × Far | (6) |
| ΔG°(T) = ∑νBH°(B,T) − T × ∑νB S°(B,T) | (7) |
| H° − H298.15° = A × t + B × t2/2 + C × t3/3 + D × t4/4 − E/t + F − H | (8) |
| S° = A × ln(t) + B × t + C × t2/2 + D × t3/3 − E/(2 × t2) + G | (9) |
![[thin space (1/6-em)]](https://www.rsc.org/images/entities/char_2009.gif) 485C mol−1), n is the number of transferred electrons, t = T/1000, and T is the temperature in K, and A–G are thermodynamic parameters.33
485C mol−1), n is the number of transferred electrons, t = T/1000, and T is the temperature in K, and A–G are thermodynamic parameters.33
 | ||
| Fig. 1 Calculated thermodynamic potential of (a) metal deposition and (b) syngas generation in different hydroxide systems. | ||
For ease of discussion, the absolute value of the electrolysis potential was used to represent the calculation value. As shown in Fig. 1b, the theoretical electrolytic voltage in the equations of various MOH (M = Li, Na, K) for syngas generation decreased with increasing electrolytic temperature. At 700 K, the energy required for syngas production corresponded to a voltage of 1.57 V in the LiOH electrolyte, which was lower than those in NaOH electrolyte (1.70 V) and KOH electrolyte (1.80 V). In comparison to the NaOH and KOH systems, the LiOH system required a lower potential, and Li deposition was relatively low. As the KOH system showed contrary behavior at the same electrolytic temperature, the LiOH electrolyte was chosen as the optimal system.
Determination of optimal temperature and operating voltage
The eutectic points of pure lithium, sodium, or potassium carbonates are 723, 851, and 891 °C, respectively. The relatively high melting temperature of the individual carbonates increases both the reaction energy consumption and heat loss. Low carbonate melting points are achieved by eutectic mixtures of alkali carbonates, such as Li1.51K0.49CO3, Li1.07Na0.93CO3, Li0.85Na0.61K0.54CO3 and Li1.43Na0.36K0.21CO3 at 490, 499, 375, and 390 °C, respectively.34–36 To achieve the controlled synthesis of syngas at relatively low temperatures, a binary carbonate mixture of Li–Na or Li–K or a ternary carbonate mixture of Li–Na–K were chosen as electrolytes to reduce the reaction temperature in this study. The highest eutectic point of the electrolytes studied was 499 °C (Li1.07Na0.93CO3) and the lowest eutectic point of the electrolytes studied was 375 °C (Li0.85Na0.61K0.54CO3). As interpreted in our previous study, a high electrolysis temperature leads to an increased hydrogen yield due to enhanced reactivity.28 Due to slower ionic migration, poor conductivity at low electrolytic temperature, difficulty of operation, and corrosion resistant performance at a high operating temperature, an appropriate temperature range was shown to be necessary for stable, continuous, and efficient electrolysis. Furthermore, according to previous theoretical and electrochemical reports, the selective electroreduction of CO2 to CO likely occurs in Li–Na and Li–K molten salts at ≤650 °C by cyclic voltammetry.37,38 Furthermore, temperatures of over 600 °C favor methane formation, achieving a methane yield of 64.9% in a eutectic mixture of carbonates as electrolyte in electrochemically reducing H2O/CO2.28 In our previous study,33 when the temperature was about 550 °C, the methane content was less than 25%. After conducting a systematic experimental study of experimental data, the range of electrolysis temperatures studied herein was chosen as 500–600 °C.The electrolytic voltages required to form the reduction products in various reactions were calculated using the Gibbs energy at temperatures ranging from 400 K to 900 K in molten lithium carbonate. As shown in Fig. 2, obvious downward trends were observed for cathodic product generation. Beyond that, theoretical calculation also demonstrated that electrolysis voltage was another critical factor for controlling reaction selectivity. The electrolysis temperatures investigated ranged from 773 K to 873 K, and the electrolytic potential of the mixtures of carbonates and hydroxide further decreased. Therefore, the potentials of pure lithium carbonate decomposition were below 1.6 V. However, 1.6 V was taken as the starting voltage in this study because of the concentration overpotential, electrochemical overpotential, and resistance overpotential.39,40 The actual decomposition voltage was greater than the theoretical value, E(decomposition potential) = E(theory decomposition voltage) + E(overpotential) + IR. According to our previous study,32,33 metal deposition occurs at higher voltages and, when the voltage exceeds 2.5 V, the CO content showed a significant downward trend. Therefore, an electrolysis voltage range of 1.6–2.6 V was determined.
Optimization of electrodes for molten carbonate/hydroxide conversion
In LixNayKzCO3–LiOH electrolytes, O2 is produced from the oxidation of O2− and CO32− at the anode, according to reactions (5) and (10):| 2CO32− − 4e− = 2CO2 + O2 | (10) |
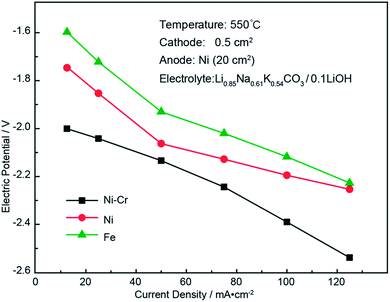
To prevent electrolyte corrosion and high-temperature oxidation of these ions, a cost-effective and corrosion-resistant electrode material with long-term stability is necessary. In our previous study, a Ni electrode showed a lower anodic overpotential by polarization analysis.28 Therefore, Ni wire was used as the anode in this electrochemical study. To select cathode materials with excellent chemical stability, Ni, Fe, and Ni–Cr were tested as applicable cathodes. The electrochemical performance of these materials was evaluated using polarization tests, as shown in Fig. 3.
As the current density increased, the overpotential also increased, and the working voltage of the electrolytic cell exceeded the rest potential voltage. Minimizing this overpotential was essential to achieve maximum energy efficiency during electrolysis. The lowest cathodic overpotential and low cost made Fe a preferable cathode material. Therefore, a Fe cathode was a viable choice for long-term electrolysis in Li2CO3–Na2CO3–K2CO3/LiOH. We believe that the low overpotential observed for the Fe cathode presents an analogous electrocatalytic opportunity for syngas production via simultaneous splitting of hydroxide and carbonate on a similar surface. Therefore, iron and nickel were selected as the cathode and anode materials, respectively.
Analysis and characterization of electrochemical products
Gaseous products prepared from the Li0.85Na0.61K0.54–0.1LiOH electrolyte at a temperature of 550 °C, using 20 cm2 of Fe wire as the cathode and 20 cm2 of Ni wire as the anode, were monitored by gas chromatography (GC) and IR spectroscopy. Gas chromatography detection consisted of a hydrogen flame ionization detector (FID) and thermal conductivity detector (TCD). As shown in Fig. 4a (FID), small by-products, such as propane and n-butane, were generated during electrolysis. TCD signals also indicated a small amount of CH4, and these alkanes are collectively represented as CxHy. The presence of CO, H2, and the anodic product were also shown in the TCD signals. As shown in Fig. 4b, peaks in the range 3000–3100 cm−1 were associated with unsaturated C–H stretching vibrations,41,42 while peaks from 2800 cm−1 to 3000 cm−1 clearly indicated saturated C–H stretching vibrations, including –CH3 and –CH2–. Trace amounts of CO2 were present in the gaseous products. CO2 has four modes of vibration, with two being infrared-active. The presence of CO2 was confirmed by the stretching vibrations at 2349 cm−1 and the flexural vibration at 667 cm−1.43 The stretching vibration of C![[triple bond, length as m-dash]](https://www.rsc.org/images/entities/char_e002.gif) O was present in the range 2200–2250 cm−1, which proved the presence of CO. The peaks from 1300–1400 cm−1 corresponded to C–H bending vibrations, and peaks from 1300–1700 cm−1 were associated with C–C stretching vibrations. The peaks at around 750 cm−1 corresponded to C
O was present in the range 2200–2250 cm−1, which proved the presence of CO. The peaks from 1300–1400 cm−1 corresponded to C–H bending vibrations, and peaks from 1300–1700 cm−1 were associated with C–C stretching vibrations. The peaks at around 750 cm−1 corresponded to C![[double bond, length as m-dash]](https://www.rsc.org/images/entities/char_e001.gif) C out-of-plane flexural vibrations in cis-olefins. The above IR observations demonstrated that the products of CO2/H2O coelectrolysis contained a large amount of CO and hydrocarbons in this work.
C out-of-plane flexural vibrations in cis-olefins. The above IR observations demonstrated that the products of CO2/H2O coelectrolysis contained a large amount of CO and hydrocarbons in this work.
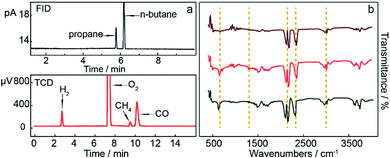 | ||
| Fig. 4 Results of gaseous product analysis from (a) gas chromatograph with FID and TCD, and (b) IR spectra under the same electrolytic conditions. | ||
Effect of mixed molten carbonate compositions on syngas product selectivity
As shown in Fig. 5, under all investigated electrolytic temperatures with voltage ranging from 1.6 V to 1.8 V, CO was the main product. However, a further increase in applied voltage (1.8–2.6 V) seemed to favor H2 generation, indicating that 1.8 V resulted in the optimum CO fraction. To illustrate the dependence of syngas composition on temperature, CO, H2, and CxHy fractions at 1.8 V were calculated at five temperatures, as shown in Fig. 6.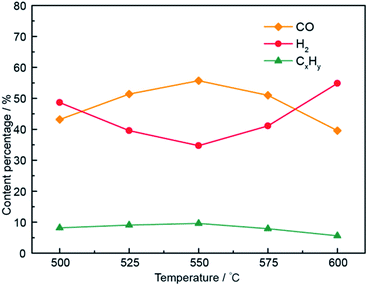 | ||
| Fig. 6 Compositions of electrolysis gaseous products at temperatures of 500–600 °C in the Li1.07Na0.93CO3–0.1LiOH electrolyte system. | ||
Fig. 6 shows the gaseous product contents in the Li1.07Na0.93CO3–0.1LiOH system at various electrolytic temperatures. When the applied temperature was increased from 500 to 550 °C, the CO content increased gradually under the same electrolysis voltage. For instance, the yield of CO rose from ∼43.2% at 500 °C and 1.8 V to ∼55.7% at 550 °C and 1.8 V. In contrast, under the same electrolysis conditions, the H2 content gradually decreased with increasing electrolysis temperature (500–550 °C), showing that increasing temperature led to an increase in current density and favored CO generation. As the electrolysis temperature was further increased (550–600 °C), the H2 content increased gradually while the CO content gradually decreased at the same electrolysis voltage. This could be ascribed to the reduction potential required by H2 and CO decreasing at elevated temperature. However, the rate of decrease in H2 production was faster than that of CO, meaning that 550 °C was the optimum electrolysis temperature for this system. This result showed the dependence of the CO fraction on the applied temperature, with higher temperatures found to not favor targeted CO production. The change in CxHy by-product content was within 10%. The above-mentioned experimental results showed that 550 °C was the optimum electrolysis temperature for the Li–Na system. Specifically, the H2/CO molar ratio of 0.62–9.60 was gained by adjusting the electrolysis voltage and operating temperature of the Li–Na system. Compared with previous research,23–25 syngas was generated simultaneously with a H2/CO ratio of less than 1.
Selection of the optimum electrolytic voltage for the Li1.51K0.49CO3–0.1LiOH system is shown in Fig. S1.† At 1.6 V, the CO content increased with increasing electrolysis temperature (500–550 °C), as shown in Fig. 7, indicating that the solubility of CO2 increased with elevating temperature and the kinetics were enhanced.44,45 The CO content decreased with a further increase in temperature (550–600 °C). This might be attributed to CO oxidation occurring at 575 °C in the Li–K system.22 This showed that the best electrolysis temperature for the Li–K system was 550 °C. As shown in Fig. S1,† the H2/CO molar ratios were well controlled in the range 0.76–5.04, 0.67–8.08, 0.59–4.33, 0.66–4.04, and 0.81–4.07. In particular, the adjustable range of H2/CO molar ratio range in the Li1.51K0.49CO3–0.1LiOH system was 0.59–8.08.
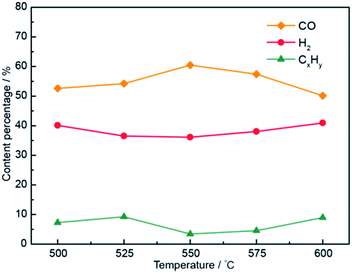 | ||
| Fig. 7 Compositions of electrolysis gaseous products at temperatures of 500–600 °C in the Li1.51K0.49CO3–0.1LiOH electrolyte system. | ||
Selection of the optimum electrolytic voltage for the Li1.43Na0.36K0.21CO3–0.1LiOH system under electrolytic temperatures is shown in Fig. S2,† and a detailed description can be found in the ESI.† Fig. 8 plots the gas concentration of the Li1.43Na0.36K0.21CO3–0.1LiOH system at various temperatures. The CO concentration by electrolysis at 1.8 V in Li1.43Na0.36K0.21CO3–0.1LiOH increased to ∼61.6% as the electrolytic temperature was increased from 500 °C to 550 °C, indicating that the increase in the temperature favored the formation of CO. Concurrently, at the applied voltage of 1.8 V, the hydrogen concentration dropped to ∼32.8%, and other products stayed at around ∼5%. The CO content then gradually declined at temperature of 550–600 °C, while the hydrogen content increased with increasing temperature (550–600 °C). This phenomenon was caused by high-temperature activation of the Li1.43Na0.36K0.21CO3 electrolyte and hydrogen formation was due to the activity of growth32 The CO content of the system reached a maximum of ∼61.7% while the H2 content was 32.8% at 1.8 V and 550 °C. The adjustable range of the H2/CO molar ratio was 0.53–7.76 in the Li2CO3–Na2CO3–K2CO3 system with a mass ratio of 61![[thin space (1/6-em)]](https://www.rsc.org/images/entities/char_2009.gif) :
:![[thin space (1/6-em)]](https://www.rsc.org/images/entities/char_2009.gif) 22
22![[thin space (1/6-em)]](https://www.rsc.org/images/entities/char_2009.gif) :
:![[thin space (1/6-em)]](https://www.rsc.org/images/entities/char_2009.gif) 17.
17.
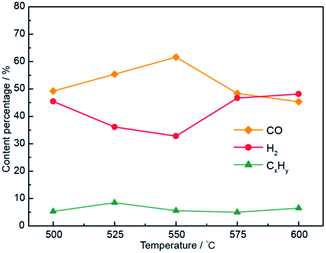 | ||
| Fig. 8 Compositions of electrolysis gaseous products at temperatures of 500–600 °C in the Li1.43Na0.36K0.21CO3–0.1LiOH electrolyte system. | ||
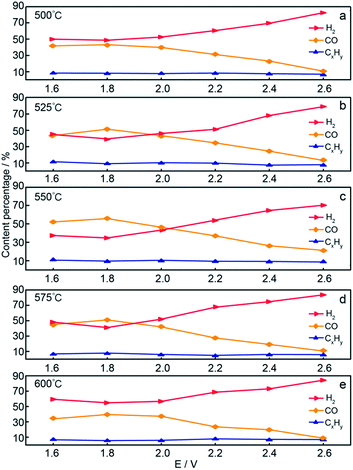
Selection of the optimum electrolytic voltage for the Li0.85Na0.61K0.54CO3–0.1LiOH system has also been interpreted in Fig. S3.† At an electrolysis voltage was 2.2 V, the compositions of the electrolysis gaseous products are shown in Fig. 9. The CO content gradually increased, the H2 content gradually decreased, and the CO selectivity increased slightly when increasing the temperature from 500 to 550 °C. With a further increase in temperature, the CO content began to decrease, while the H2 content gradually increased. With a lower electrolysis potential required for the temperature rise, the higher temperature did not contribute to CO formation. These results confirmed that the CO content reached a maximum at 550 °C and 2.2 V. The H2/CO molar ratio was 1.02, and the H2/CO molar ratio ranged from 1.02 to 7.42 in Li0.85Na0.61K0.54CO3 by tuning the voltage and temperature.
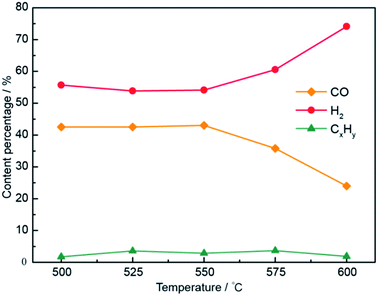 | ||
| Fig. 9 Compositions of electrolysis gaseous products at temperatures of 500–600 °C in the Li0.85Na0.61K0.54CO3–0.1LiOH electrolyte system. | ||
In summary, the four electrolyte systems investigated presented varying H2/CO molar ratio ranges under different electrolytic conditions, but with the common feature that all maximum CO fractions were observed at 550 °C. This was a desirably low temperature (vs. 800 °C)22 that could lead to the highly efficient one-pot generation of syngas by CO2/H2O via coelectrolysis in molten salts. In detail, compared with Li0.85Na0.61K0.54CO3–0.1LiOH, the other three systems demonstrated an advantage in the generated H2/CO ratio, implying an enlarged application potential. Furthermore, Li1.51K0.49CO3–0.1LiOH and Li1.43Na0.36K0.21CO3–0.1LiOH provided maximum CO contents of more than 60%, which were superior to those of Li1.07Na0.93CO3–0.1LiOH and Li0.85Na0.61K0.54CO3–0.1LiOH. Therefore, it was concluded that a larger Li2CO3 fraction favored CO generation, and that Li2CO3-induced modification at the interface between the cathode and electrolyte might be responsible for the observed changes in CO contents. By regulating the composition of the electrolytes, the synthesis of wide range of H2/CO ratios has been successfully realized, and the industrial application range of syngas has been expanded.
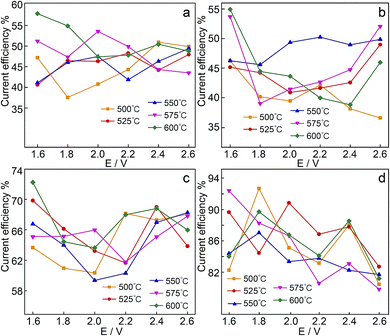
Current efficiency is a significant metric of CO2/H2O transformation selectivity. Regarding the volume of obtained gaseous products, the current efficiency was calculated, as shown in Fig. 10. An irregular change in the current efficiency was observed in the Li1.07Na0.93CO3–0.1LiOH and Li1.51K0.49CO3–0.1LiOH systems, and the current efficiency of each reduction product was lower than 60%. Presumably, this was due to the deposition of alkali metals at the cathodic surface.46 CO32− ions can also be reduced indirectly via the prior reduction of alkali metal ions to the metal (reactions (11) and (12)).47
| M+ + Xe− → M | (11) |
| 4M + M2CO3 → C + 3M2O | (12) |
In another study on a Ni electrode under similar conditions to that stated earlier, the cathodic limit corresponded to the reduction of CO32− ions to carbon, while the anodic limit was assigned to the oxidation of Ni according to reaction (13).48
| Ni2+ + 2e− → Ni | (13) |
Of the four electrolytes investigated, the mixture of Li0.85Na0.61K0.54–0.1LiOH exhibited a higher current efficiency with an optimum efficiency approaching ∼93%. However, it produced a relatively low fraction of CO (∼25%). The current efficiencies for fuel gas production are all over 79%, signifying that regulating applied cell voltages leads to syngas generation of various concentrations.
Conclusions
In summary, the one-pot generation of syngas with a wide range H2/CO ratios (0.62–9.6 vs. over 1) was achieved through rationally designed molten salt electrolysis system. Electrolysis was carried out at 500–600 °C with an operating voltage of 1.6–2.6 V using a low-cost Fe cathode and Ni anode. CO2/H2O was directly transformed into syngas via electrolysis in the Li0.85Na0.61K0.54–0.1LiOH electrolyte, with a 93.2% current efficiency at a constant voltage of 1.8 V and temperature of 500 °C. Moreover, the molar ratios of H2/CO were 0.62–9.60, 0.59–8.08, 0.53–7.76, and 1.02–7.42 for Li1.07Na0.93CO3–0.1LiOH, Li1.51K0.49CO3–0.1LiOH, Li1.43Na0.36K0.21CO3–0.1LiOH, and Li0.85Na0.61K0.54–0.1LiOH electrolytes, respectively. Syngas with diverse H2/CO ratios was obtained by regulating the electrolyte composition, applied cell voltage, and electrolytic temperature. The methane-based hydrocarbon content varied by within 10% in the four electrolytes. In this manner, this work provides a path for further enhancements of product selectivity of CO and H2, and demonstrates a new sustainable process for recycling H2O and CO2.Conflicts of interest
There are no conflicts to declare.Acknowledgements
This work is supported by the National Natural Science Foundation of China (No. 21476046 and 21306022), the Specialized Research Fund for the Doctoral Program of Higher Education of China (No. 20132322120002), the China Postdoctoral Science Foundation (No. 2013M540269), the Postdoctoral Science Foundation of Heilongjiang Province of China (No. LBH-TZ0417), and partly supported by the Science Foundation for Creative Research Groups of the Heilongjiang Higher Education Institutes of China (No. 2013TD004) and the Northeast Petroleum University (No. SJQHB201602 and YJSCX2016-018 NEPU).Notes and references
- B. Kumar, M. Llorente and J. Froehlich, et al., Annu. Rev. Phys. Chem., 2012, 63, 541 CrossRef CAS PubMed.
- W. K. Fong, H. Matsumoto, C. S. Ho and Y. F. Lun, Planning Malaysia Journal, 2008, 6, 101 Search PubMed.
- D. C. Grills, Y. Matsubara and Y. Kuwahara, et al., J. Phys. Chem. Lett., 2014, 5, 2033 CrossRef CAS PubMed.
- J. R. Bolton and D. O. Hall, Annu. Rev. Energy, 1979, 4, 353 CrossRef CAS.
- R. Wick and S. D. Tilley, J. Phys. Chem. C, 2015, 119, 26243 CAS.
- Q. Kong, D. Kim and C. Liu, et al., Nano Lett., 2016, 16, 5675 CrossRef CAS PubMed.
- D. R. Kauffman, J. Thakkar and R. Siva, et al., ACS Appl. Mater. Interfaces, 2015, 7, 15626 CAS.
- W. H. Wang, Y. Himeda and J. T. Muckerman, et al., Chem. Rev., 2015, 115, 12936 CrossRef CAS PubMed.
- C. Costentin, M. Robert and J. M. Savéant, Acc. Chem. Res., 2015, 48, 2996 CrossRef CAS PubMed.
- H. K. Lim, H. Shin and W. A. Goddard, et al., J. Am. Chem. Soc., 2014, 136, 11355 CrossRef CAS PubMed.
- M. Azuma, K. Hashimoto, M. Hiramoto, M. Watanae and T. Sakata, J. Electrochem. Soc., 1990, 137, 1772 CrossRef CAS.
- F. Köleli, T. Atilan and N. Palamut, et al., J. Appl. Electrochem., 2003, 33, 447 CrossRef.
- C. W. Li and M. W. Kanan, J. Am. Chem. Soc., 2012, 134, 7231 CrossRef CAS PubMed.
- A. Wiȩckowski, E. G. M. Szklarczyk and J. Sobkowski, Electrochim. Acta, 1983, 28, 1619 CrossRef.
- H. Wu, Z. Li, D. Ji and Y. Liu, et al., RSC Adv., 2017, 7, 8467 RSC.
- Y. Matsuzaki and I. Yasuda, J. Electrochem. Soc., 2000, 147, 1630 CrossRef CAS.
- H. Yang, Y. Gu, Y. Deng and F. Shi, Chem. Commun., 2002, 2002, 274 RSC.
- H. Wu, Z. Li, D. Ji and Y. Liu, et al., Carbon, 2016, 106, 208 CrossRef CAS.
- M. E. S. Hegarty, A. M. O'Connor and J. R. H. Ross, Catal. Today, 1998, 42, 225 CrossRef CAS.
- M. S. Rana and V. Sámano, et al., Fuel, 2007, 8, 1216 CrossRef.
- R. Dvořák, T. Pařízek and L. Bébar, et al., Clean Technol. Environ. Policy, 2009, 95 CrossRef.
- Y. Liu, D. Ji, Z. Li and D. Yuan, et al., Int. J. Hydrogen Energy, 2017, 42, 18165 CrossRef CAS.
- T. Riedel, M. Claeys and H. Schulz, et al., Appl. Catal., A, 1999, 186, 201 CrossRef CAS.
- J. H. Lee, K. Y. Koo and U. H. Jung, et al., Korean J. Chem. Eng., 2016, 33, 3115 CrossRef CAS.
- F. Sastre and M. J. Muñoz-Batista, et al., ChemElectroChem, 2016, 3, 1497 CrossRef CAS.
- N. Tien-Thao and M. H. Zahedi-Niaki, et al., Appl. Catal., A, 2007, 326, 152 CrossRef CAS.
- D. Chery, V. Albin and A. Meléndez-Ceballos, et al., Int. J. Hydrogen Energy, 2016, 41, 18706 CrossRef CAS.
- H. Wu, D. Ji, L. Li and D. Yuan, et al., Adv. Mater. Technol., 2016, 1 DOI:10.1002/admt.201600092.
- D. J. Adams, T. M. Dwyer and B. Hille, J. Gen. Physiol., 1980, 75, 493 CrossRef CAS PubMed.
- S. B. Kausley, C. P. Malhotra and A. B. Pandit, Journal of Water Process Engineering, 2017, 16, 149 CrossRef.
- NIST Chemistry WebBook. NIST Standard Reference Database Number 69, ed. P. J. Linstrom and W. G. Mallard, National Institute of Standards and Technology, Gaithersburg, MD, 2016, http://webbook.nist.gov Search PubMed.
- D. Ji, Y. Liu and Z. Li, et al., Int. J. Hydrogen Energy, 2017, 42, 18156 CrossRef CAS.
- H. Wu, Y. Liu and D. Ji, et al., J. Power Sources, 2017, 362, 92 CrossRef CAS.
- C. W. Bale and A. D. Pelton, CALPHAD: Comput. Coupling Phase Diagrams Thermochem., 1982, 6, 255 CrossRef CAS.
- S. Licht, Adv. Mater., 2011, 23, 5592 CrossRef CAS PubMed.
- S. Licht, H. Wu, Z. Zhang and H. Ayub, Chem. Commun., 2011, 47, 3081 RSC.
- D. Chery, V. Albin, V. Lair and M. Cassir, Int. J. Hydrogen Energy, 2014, 39, 12330 CrossRef CAS.
- D. Chery, V. Lair and M. Cassir, Electrochim. Acta, 2015, 160, 74 CrossRef CAS.
- J. J. Yang, C. H. Choi, H. B. Seo, H. J. Kim and S. G. Park, Electrochim. Acta, 2012, 86, 277 CrossRef CAS.
- H. Li and C. Oloman, J. Appl. Electrochem., 2005, 35, 955 CrossRef CAS.
- C. Kötting, J. Güldenhaupt and K. Gerwert, Chem. Phys., 2012, 396, 72 CrossRef.
- P. Grimaldi, L. D. Giambattista and S. Giordani, et al., Spectrochim. Acta, Part A, 2011, 84, 74 CrossRef CAS PubMed.
- C. H. Lin and H. Bai, Ind. Eng. Chem. Res., 2004, 43, 5983 CrossRef CAS.
- Y. Kanai, K. Fukunaga and K. Terasaka, et al., Chem. Eng. Sci., 2013, 100, 153 CrossRef CAS.
- H. Gupta and L. S. Fan, Ind. Eng. Chem. Res., 2002, 41, 4035 CrossRef CAS.
- H. V. Ijije, R. C. Lawrence and G. Z. Chen, RSC Adv., 2014, 4, 35808 RSC.
- M. L. Deanhardt, K. H. Stern and A. Kende, J. Electrochem. Soc., 1986, 133, 1148 CrossRef CAS.
- F. Lantelme, B. Kaplan, H. Groult and D. Devilliers, J. Mol. Liq., 1999, 83, 255 CrossRef CAS.
Footnotes |
| † Electronic supplementary information (ESI) available. See DOI: 10.1039/c7ra07320h |
| ‡ The two authors contributed equally to this paper. |
| This journal is © The Royal Society of Chemistry 2017 |

