 Open Access Article
Creative Commons Attribution 3.0 Unported Licence
Incensfuran: isolation, X-ray crystal structure and absolute configuration by means of chiroptical studies in solution and solid state†‡
Najeeb Ur Rehmana,
Hidayat Hussain *ab,
Sulaiman Al-Shidhania,
Satya Kumar Avulaa,
Ghulam Abbasac,
Muhammad Usman Anwar
 a,
Marcin Góreckide,
Gennaro Pescitelli
 *d and
Ahmed Al-Harrasi*a
aUoN Chair of Oman's Medicinal Plants and Marine Natural Products, University of Nizwa, PO Box 33, 616 Birkat Al Mauz, Nizwa, Oman. E-mail: hussainchem3@gmail.com; aharrasi@unizwa.edu.om; Fax: +968-25446289; Tel: +968-25446328
bCenter for Marine Biotechnology and Biomedicine, Scripps Institution of Oceanography, University of California-San Diego, La Jolla, CA 92093-0204, USA
cDepartment of Biological Sciences and Chemistry, University of Nizwa, PO Box 33, 616 Birkat Al Mauz, Nizwa, Oman
dDipartimento di Chimica e Chimica Industriale, Università di Pisa, via Moruzzi 13, 56124 Pisa, Italy. E-mail: gennaro.pescitelli@unipi.it
eInstitute of Organic Chemistry, Polish Academy of Sciences, ul. Kasprzaka 44/52, 01-224 Warsaw, Poland
First published on 31st August 2017
Abstract
A new cembrane diterpene named incensfuran (1), biogenetically derived from incensole (2), was isolated from crude extracts of the Boswellia papyrifera Hochst. The structure of incensfuran (1) was elucidated by 1D and 2D NMR study, and its absolute configuration was determined by single crystal X-ray diffraction analysis and electronic and vibrational circular dichroism spectroscopy (ECD, VCD). Moreover semisynthesis of incensfuran (1) was achieved after treatment of incensole (2) with BF3·OEt2. In addition epoxidation of incensfuran (1) provided expoxide analog 3 with 80% yield.
Introduction
Diterpenes are an important class of natural products based on twenty carbon atoms which can be found both in marine organisms and terrestrial plants. They are biogenetically derived from condensation of four isoprene units via deoxyxylulose phosphate or mevalonate pathways. Diterpenoids are generally found in Nature as linear, bicyclic, tricyclic or tetracyclic, pentacyclic, and macrocyclic diterpenes.1 Cembranoids are 14-membered macrocyclic diterpene displaying a C-1 isopropyl group along with three methyl groups at C-4, C-8 and C-12. Cembranes have been reported from various natural sources including marine invertebrates (viz., soft corals and sponges), plants (viz., frankincense, resins, and tobacco), and insects.2 The chemical diversity can be generated among cembranoids through polyoxygenation, yielding hydroxyl group (which are normally esterified by small-sized aliphatic or aromatic acids), keto groups, furan ring formation or γ-lactone group.3 However, the oxygenation and stereochemical diversity of cembranoids are quite complex, for instance incensole (2) contains a 14-membered carbocyclic ring which incorporates the tetrahydrofuran ring. Incensole (2) and its acetate demonstrated a wide range of therapeutic applications such as: antiproliferative, anti-inflammatory, neuroprotective, antidepressive-like and also cytotoxic properties.4Due to their wide range of biological effects connected with unique structural variations, incensole analogs have received special interest among scientists with respect to their isolation and synthesis.2 As a part of our ongoing research we have investigated various Boswellia species. Here, we reported the isolation from Boswellia papyrifera Hochst. of a new cembrance diterpene named incensfuran (1) along with known compound viz., incensole (2). Its structure and relative configuration was elucidated by NMR and X-ray studies, and the absolute configuration was confirmed by means of electronic and vibrational circular dichroism (ECD, VCD) in solution, and in the case of ECD also in the solid state. In particular, we tested the applicability of the solid-state ECD/TDDFT method5 to the target compound which is fairly challenging, since it possesses a weak solid-state ECD spectrum with a band <200 nm, due to the presence of only one alkene chromophore in its structure.
Results and discussion
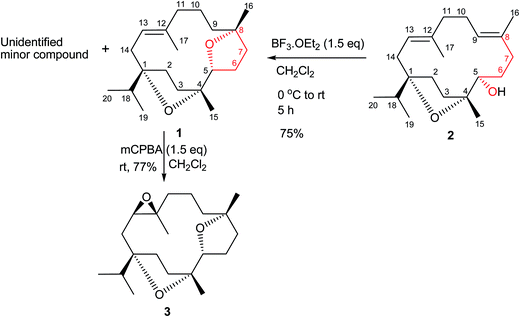
Phytochemical investigation of B. papyrifera resulted in the isolation and characterization of a new cembrane analog, incensfuran (1) (Scheme 1).Compound 1 was obtained as colorless crystal and its molecular formula was confirmed as C20H34O2 by ESIMS and NMR data. Moreover, the IR spectrum contained the absorption band of an olefinic (1670 cm−1) functionality. This was further supported from 1H-NMR spectrum peak at δ 6.01 (br. s, 1H, H-13) and 13C-NMR peaks at δ 132.2 (C-12) and 121.2 (C-13). Furthermore, NMR displayed typical signals for isopropyl group of cembrane skeleton δH: 0.87 (d, J = 6.6 Hz, 3H, H-19); δC: 17.7; δH: 1.01 (d, J = 6.6 Hz, 3H, H-20); δC: 17.1) and cembrane skeleton was further confirmed from other methyl signals in NMR spectra δH: 1.55 (s, 3H, 17-Me); δC: 18.8; δH: 1.10 (s, 3H, 15-Me); δC: 24.0; δH: 1.04 (s, 3H, 16-Me); δC: 25.6). In addition, 1H-NMR spectrum also possessed well-resolved oxymethine signal at 4.14 (dd J = 9.6, 3.0 Hz, 1H, H-5) supported by 13C-NMR peak at 83.4.6
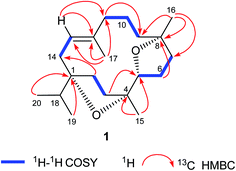
The DEPT NMR spectrum demonstrated the presence of 20 carbons divided into five methyls, eight methylenes, three methines (including one oxygenated C-5 methine at δ 83.4), and four quaternary carbons including three oxygenated tertiary carbons at δ 88.7, 86.5, and 83.7 for C-1, C-4, and C-8 respectively. Moreover, the complete structure of compound 1 was accomplished by COSY and HMBC experiments (Fig. 1) which illustrated oxygenation at C-1, C-4, C-5, and C-8 in the form of two furan rings. The cembrane skeleton as well two furan units were supported by key HMBC correlations between Me-20 and Me-19 with C-1 and C-18; Me-15 with C-3, C-4, and C-5; Me-16 with C-7, C-8, and C-9; Me-17 and C-11, C-12, and C-13; H-2 with C-1, C-3, C-4, and C-14; H-3 with C-1, C-2, C-4, and C-5; H-5 with C-3, C-4, C-6, and C-7; H-6 with C-4, C-5, C-7, and C-8; H-7 with C-5, C-6, C-8, and C-9; H-10 with C-8, C-9, C-11, and C-12; H-13 with C-1, C-11, C-12, and C-14, suggested the C-5 and C-8 furano-incensole.4,7
The relative stereochemistry at C-1, C-4, C-5, and C-8 was confirmed by the NOESY correlations of H-5 with Me-16 and Me-15, and of Me-19/20 with Me-15. Moreover, the structure of 1 was also confirmed by single-crystal X-ray diffraction analysis (Fig. 2). Moreover incensfuran (1) was prepared (75%) from incensole (2) via Lewis acid mediated cyclization with BF3·OEt2 along with unidentified minor compound. Incensfuran (1) was also epoxidized with mCPBA in CH2Cl2 and yielded expoxide analog 3 with 80% yield.
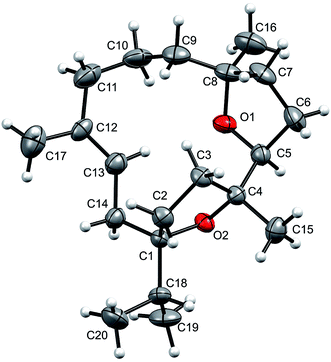 | ||
| Fig. 2 Molecular structure of incensfuran (1). Thermal ellipsoids are presented with 50% probability. | ||
Determination of the absolute configuration
Similar to the previous report on 5-epi-incensole,8 in order to assign the absolute configuration of incensfuran 1, we performed chiroptical studies based on the tandem use of ECD and VCD spectroscopy both in solution and solid state. First, we applied the so-called solid-state ECD/TDDFT methodology,5,9 which is based on the comparison between the measured ECD spectrum in the solid state as a microcrystalline KBr or KCl pellet, and the spectrum computed by TDDFT method using the X-ray geometry as input structure (after optimization of all H-atoms). Consequently, all uncertainties related to the conformational search are avoided. Over the last decade, it has been shown that this methodology is particular beneficial for flexible medium-size natural products,5,9–16 and can be also applied to differentiate the conformational polymorphic forms of active pharmaceutical ingredients.17 In Fig. 3, the measured ECD spectra of incensfuran 1 in acetonitrile solution (red line) and in the solid-state as KCl pellet (black line) are presented. As can be seen, both spectra display a negative ECD band with a minimum centered at ∼190 nm.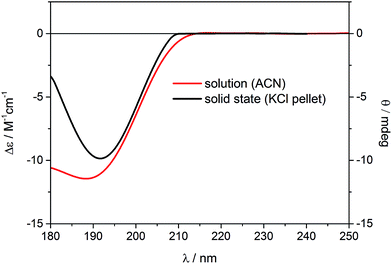 | ||
| Fig. 3 Experimental ECD spectra of (1S,4R,5R)-incensfuran (1) measured in acetonitrile solution (red line, left scale) and the solid state as KCl pellet (black line, right scale). | ||
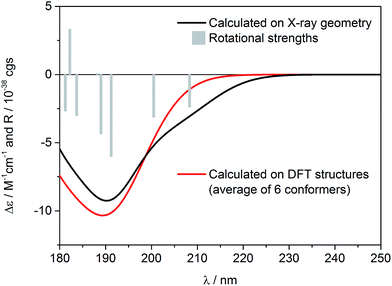
In Fig. 4, the ECD spectrum calculated at CAM-B3LYP/TZVP level using the X-ray geometry with the (1S,4R,5R)-configuration is shown (black line). The agreement with the experimental solid-state ECD spectrum (Fig. 3) allowed us to establish the absolute configuration of incensfuran 1 to be 1S,4R,5R. At the same time, we also confirmed that the absolute configuration at C-1 and C-4 is the same as incensole.6,8
Having in mind that 1 possesses only one alkene chromophore in its structure, it is not surprising that ECD spectra in both media showed only a single negative band below 200 nm. Therefore, we decided to support the assignment by computing solution ECD and VCD spectra. In the first step of the computational procedure,18,19 a thorough conformational analysis was run with molecular mechanics (Merck Molecular Force Field, MMFF) within an energy range of 10 kcal mol−1. Next, all the obtained structures (31) were submitted to DFT optimization at the B3LYP/6-31G(d) level of theory to reduce the total number of conformers found. Then, the remaining conformers (20) within 3 kcal mol−1 were further re-optimized in vacuo using a higher level of theory, i.e. B3LYP/6-311+G(d,p). Finally, a set of 6 stable conformers with Boltzmann population >1% at 298 K were selected (see Table S1, ESI‡). The most abundant DFT structure is almost coincident with the X-ray geometry (Fig. 5, and S1, ESI‡). The remaining low-energy conformers (Fig. S1, ESI‡) show moderate variations in the conformation of the macrocycle ring, especially in the region ranging from C-8 to C-11, while the region from C-1 to C-8 is more rigid because of the presence of the oxygen bridges. Furthermore, some differences in the conformation of tetrahydrofuran rings are also observed.
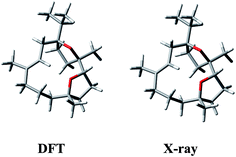 | ||
| Fig. 5 Comparison between the lowest-energy DFT structure calculated in vacuo at B3LYP/6-311+G(d,p) level and the X-ray structure of (1S,4R,5R)-incensfuran (1). | ||
Solution ECD spectrum was simulated at the TDDFT level of theory using DFT-optimized geometries. The calculations were performed in vacuo for the first 50 excited electronic states using two different levels, i.e. CAM-B3LYP/aug-cc-pVDZ and CAM-B3LYP/TZVP. The obtained results were consistent, however a slightly better match between experimental and computed spectra was obtained using CAM-B3LYP/TZVP level, so these results are shown here (Fig. 4). As expected, there is also a good agreement between the solution and calculated ECD spectrum, which further confirms the configurational assignment of (1S,4R,5R)-incensfuran (1).
One may argue that a single ECD band, though consistently reproduced by calculations, may not suffice to assign the absolute configuration of a new compound confidently. This is true in general, however we wish to observe that the experimental ECD of incensfuran (1) is not weak; its g-factor (Δε/ε) is −0.001, both experimental and calculated. The absolute value is therefore well above the assumed sensitivity of ECD spectra (10−5). Still, it is a good practice to use independent chiroptical methods to assign the absolute configuration of new natural products.19 Therefore, we confirmed ECD results using VCD too.
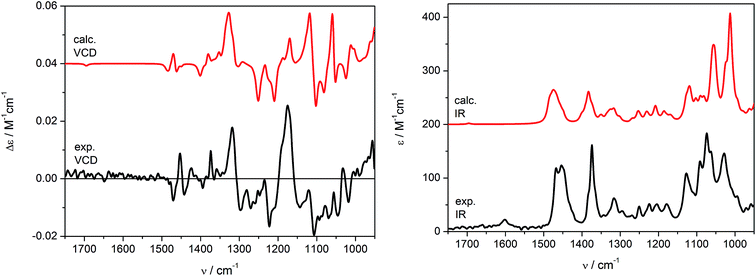
Theoretical VCD and IR spectra were calculated at the B3LYP/6-311+G(d,p) level applying the PCM model for CHCl3 (ε = 4.9) in order to reflect the impact of solvent not only on conformational equilibrium, but also on vibrational transitions, by reoptimizing the previously found set conformers (Table S2, ESI‡). The simulated VCD/IR spectra are shown in Fig. 6. As can be seen, the Boltzmann averaged spectra (red curves) are in good agreement with the experimental data recorded in CDCl3 (black curves). As it would be expected, similar results were obtained by carrying out in vacuo calculations (Fig. S2, ESI‡). Some discordances in the relative intensities of calculated VCD bands may be observed in the range of 1300–1100 cm−1. Nevertheless, the experimental and calculated IR spectra correspond perfectly in the range 1600–950 cm−1, resulting indeed in a good agreement of VCD signs too, which allowed us to confirm independently the previous assignment obtained using ECD spectroscopy. Note that at the concentration of 0.19 M, the C![[double bond, length as m-dash]](https://www.rsc.org/images/entities/char_e001.gif) C stretching (1600–1700 cm−1) is almost silent in the VCD spectrum and faintly visible in the IR one.
C stretching (1600–1700 cm−1) is almost silent in the VCD spectrum and faintly visible in the IR one.
Summarizing, here we demonstrated that the solid-state ECD/TDDFT method confirmed its strength even in the presence of a single alkene moiety as the only chromophore unit in the molecule. Previously, we had applied the same technique to compounds containing other weak chromophores such as two non-conjugated double bonds,8 two non-conjugated ester moieties,20 and two anhydride groups.21 Furthermore, we showed that the stereochemical assignment can be performed using very low amount of sample (∼0.2 mg in this case) required to record a significant solid-state ECD spectrum <200 nm. In contrast, to measure solution VCD spectrum one need a much larger amount of sample (∼11 mg in the present case).
Conclusion
A new cembrane diterpene, incensfuran (1), was isolated from the crude extracts of the B. papyrifera Hochst and its structure elucidated by means of spectroscopic data analysis including 1D (1H and 13C NMR spectra) and 2D (COSY, HMBC, NOESY) spectra. The relative and absolute configuration was established as (1S,4R,5R)-1 by single crystal X-ray analysis in tandem with electronic and vibrational circular dichroism. In the course of our work we also confirmed that the solid-state ECD/TDDFT method can be reliably applied to compounds having one substituted olefin as the only chromophore in their structure.Experimental section
General
Optical rotations were measured on a KRUSS P P3000 polarimeter (A. Kruss Optronic, Germany). IR spectra were recorded on a Bruker, ATR-Tensor 37 spectrophotometer. ESI-MS were recorded on a Waters Quattro Premier XE Mass Spectrometer (Waters, Milford, MA). The 1H and 13C NMR spectra were recorded on Bruker NMR spectrometers operating at 600 MHz (150 MHz for 13C). The chemical shift values are reported in ppm (δ) units and the coupling constants (J) are given in Hz. For TLC, pre-coated aluminum sheets (silica gel 60 F-254, E. Merck) were used. Visualization of the TLC plates was achieved under UV light at 254 and 366 nm and by spraying with ceric sulfate reagent.ECD spectra were measured with a Jasco (Tokyo, Japan) J-715 spectropolarimeter at room temperature, using 100 nm min−1 scanning speed, a step size of 0.2 nm, a bandwidth of 1 nm, a response time of 0.5 s, and an accumulation of 8 scans. The solution spectrum of 1 was measured on a 3.3 mM CH3CN solution in a quartz cell with a path length of 0.02 cm. The ECD solid-state spectrum was obtained using the KCl pellet technique described previously.9 In particular, ∼0.1 mg of 1 was mixed and ground with 200 mg of KCl, and then ∼100 mg of this mixture was used to prepare the pellet. IR/VCD spectra were recorded at room temperature using a Jasco (Tokyo, Japan) FVS-6000 VCD spectrometer between 2000–850 cm−1 with 4 cm−1 resolution using 4000 scans, on 0.19 M CDCl3 solution in a BaF2 cell with a path length of 100 μm. The final spectrum was obtained by subtracting the CDCl3 spectrum recorded in the same conditions.
For X-ray measurements, single crystals of 1 were mounted on a glass fiber and examined at 296 K on a Bruker D8 Venture APEX diffractometer equipped with Photon 100 CCD area detector using graphite-monochromated Mo-Kα radiation (λ = 0.71073 Å).‡
Plant material
The B. papyrifera frankincense was donated by Dr Saifeldin Elnegrabi from Sudan. All of these samples were authenticated by Dr Mustafa Mansi (botanist), Department of Biological Sciences and Chemistry, University of Nizwa, the Sultanate of Oman and voucher specimen (no. BSHR-01/2012) was deposited with the Herbarium of the Chair of Oman's Medicinal Plants and Marine Natural Products.Extraction and purification
The air-dried powdered resin (1.5 kg) of B. papyrifera was finely extracted with MeOH (10 l) at r.t. (3 × 15 days) and evaporated under reduced pressure to yield a crude MeOH extract (1.3 kg). The crude MeOH extract was subjected to Vacuum Liquid Chromatography (VLC) using 10, 20. 30, 50% n-hexane/EtOAc, and washed with EtOAc to afford five fractions (SF1–SF5). Fraction (SF1), 10% n-hexane/EtOAc, was further subjected to column chromatography using n-hexane, 2%, 5%, and 10% n-hexane/EtOAc as a mobile phase to get four sub-fractions (SSF1–SSF4). After taking TLC, fraction two (SSF2) was further chromatographed and gave semi-pure compound which was loaded directly on recycling preparative HPLC, using CHCl3 solvent system stabilized with 0.6% EtOH. Incensfuran (1, 55.5 mg) was eluted as a UV-inactive compound at a retention time of 51.7 min with 3.5 ml min−1 flow rate. The compound was re-crystallized in 30% CHCl3/MeOH to make a white needle like crystals.Incensfuran (1): white crystals; [α]25D = − 15.2 (c 0.26, MeOH); IR (KBr): 1670, 1460, 1382, 1053, 978 and 841 cm−1; IR (CDCl3): 1467, 1452, 1374, 1315, 1250, 1224, 1203, 1177, 1127, 1074, 1026 cm−1; VCD (CDCl3, sign): 1470 (−), 1454 (+), 1442 (−), 1423 (+), 1395 (−), 1373 (+), 1317 (+), 1297 (−), 1270 (−), 1222 (−), 1175 (+), 1143 (−), 1107 (−), 1068 (−), 1046 (+) and 1018 cm−1 (−); ECD (CH3CN, Δε): 188.3 nm (−11.4); ECD (KCl, mdeg): 191.6 nm (−9.9); 1H-NMR (600 MHz, CDCl3): 6.01 (br. s, 1H, H-13), 4.14 (dd, J = 9.6, 3.0 Hz, 1H, H-5), 2.20 (m, 2H, H-11), 2.27 (m, 1H, H-2b), 2.13 (m, 1H, H-14a), 2.03 (m, 1H, H-14b), 2.01 (m, 1H, H-3a), 1.97 (m, 1H, H-9a), 1.80 (m, 1H, H-18), 1.78 (m, 1H, H-2a), 1.64 (m, 1H, H-6a), 1.71 (m, 2H, H-7a, H-3b), 1.67 (m, 1H, H-6b), 1.53 (m, 2H, H-7b), 1.55 (s, 3H, 17-Me), 1.48 (m, 1H, H-9b), 1.42 (m, 1H, H-10a), 1.33 (m, 1H, H-10b), 1.10 (s, 3H, 15-Me), 1.04 (s, 3H, 16-Me), 1.01 (d, J = 6.6 Hz, 3H, H-20), 0.87 (d, J = 6.6 Hz, 3H, H-19); 13C NMR (150 MHz, CDCl3): δ 132.2 (C-12), 121.2 (C-13), 88.7 (C-1), 86.5 (C-4), 83.4 (C-5), 83.7 (C-8), 41.1 (C-18), 40.9 (C-11), 38.5 (C-3), 38.4 (C-7), 35.2 (C-6), 31.3 (C-14), 31.1 (C-11), 28.1 (C-2), 25.6 (C-16), 24.0 (C-15), 19.8 (C-10), 18.8 (C-17), 17.7 (C-19), 17.1 (C-20); ESIMS: m/z (rel. int.): 329.02 [M + Na]+ (100); (calcd for C20H34O2 + Na, 329.2); 635.2 [2M + Na] (50).
Compound 3
To a cooled (0°) soln. of incensfuran (1) (20 mg) in CH2Cl2 (5 ml) was added mCPBA (1.5 eq.) and the mixture was stirred at r.t. for 6 h. After taking TLC the reaction was quenched by addition of saturated Na2SO3 solution. The mixture was extracted with CH2Cl2 followed by washed with sat. aq. NaHCO3 solution and dried with Na2SO4. Finally the residue was loaded directly on recycling preparative HPLC, using CHCl3 solvent system stabilized with 0.6% EtOH to give compound 3 with 77% yield. Colourless solid; [α]25D = + 21.7 (c 0.04, MeOH); 1H-NMR (600 MHz, CDCl3): 4.02 (dd, J = 9.6, 3.6 Hz, 1H, H-5), 3.66 (dd, J = 10.2, 2.4, 1H, H-13), 2.19 (dd, J = 10.2, 3.6 Hz, 1H, H-9), 1.20 (m, 1H, H-9), 1.90 (m, 1H, H-7), 1.57 (m, 1H, C-7), 1.67 (m, 1H, H-11a), 1.52 (m, 1H, H-11b), 2.07 (m, 1H, H-2b), 2.19 (dd, J = 14.4, 2.4, 1H, H-14a), 1.47 (m, 1H, H-14b), 1.72 (m, 1H, H-3a), 1.87 (m, 1H, H-9a), 1.80 (m, 1H, H-18), 1.46 (m, 1H, H-2a), 1.85 (m, 1H, H-6a), 1.52 (m, 2H, H-7a, H-3b), 2.01 (m, 1H, H-6b), 1.16 (s, 3H, 16-Me), 1.53 (m, 2H, H6b, H-7b), 1.21 (s, 3H, 17-Me), 1.65 (m, 1H, H-9b), 1.62 (m, 1H, H-10a), 1.78 (m, 1H, H-10b), 1.05 (s, 3H, 15-Me), 1.01 (d, J = 6.6 Hz, 3H, H-20), 0.81 (d, J = 6.6 Hz, 3H, H-19); 13C NMR (150 MHz, CDCl3): δ 88.3 (C-1), 86.4 (C-4), 84.5 (C-5), 82.5 (C-8), 65.4 (C-13), 61.2 (C-12), 36.6 (C-18), 39.9 (C-11), 38.5 (C-3), 36.5 (C-7), 33.5 (C-6), 30.2 (C-14), 31.6 (C-9), 27.3 (C-2), 27.4 (C-16), 21.6 (C-15), 20.5 (C-10), 18.9 (C-17), 16.4 (C-19), 18.9 (C-20); ESIMS: m/z (rel. int.): 345.0 [M + Na]+; (calcd for C20H34O3 + Na, 345.2).Computational section
Conformational searches and preliminary DFT calculations were run with Spartan'14 (Wavefunction, Irvine CA), with standard parameters and convergence criteria. DFT and TDDFT calculations run with Gaussian'09 (Revision D.01. Gaussian, Inc: Wallingford, CT; 2013), with default grids and convergence criteria. The conformational search was run with the Monte Carlo algorithm implemented in Spartan'14 and using Merck Molecular Force Field (MMFF). The geometries were then optimized by DFT calculations first at the B3LYP/6-31G(d,p) level and then at the B3LYP/6-311G+(d,p) level of theory, first in vacuo and then using the PCM solvent model for CHCl3. Next, all conformers with Boltzmann population of >1% at 298 K were considered for ECD (in vacuo) and VCD (in vacuo and CHCl3) calculations. Frequency calculations were run at the B3LYP/6-311+G(d,p) level of theory using PCM for CHCl3. IR and VCD spectra were obtained as sums of Lorentzian functions with a half-width at half height of 6 cm−1, and a frequency scale factor of 0.985, and Boltzmann-averaged at 298 K using internal energies. ECD calculations were run at the CAM-B3LYP/aug-cc-pVDZ and CAM-B3LYP/TZVP levels of theory in vacuo. ECD spectra were obtained as sums of Gaussian functions with an exponential half-width of 0.35 eV, using rotational strengths calculated in the dipole-length gauge, and Boltzmann averaged at 298 K using internal energies. Average spectra were generated with the software SpecDis, v. 1.70.22,23Conflicts of interest
There are no conflicts to declare.Acknowledgements
The authors would like to thank The Oman Research Council (TRC) for the generous support through the project ORG/HSS/14/004. This work was also supported by the Wrocław Centre for Networking and Supercomputing (WCSS). M. G. gives thanks for the support from the Polish Ministry of Science and Higher Education (‘Mobilnosc Plus’ grant no. 1286/MOB/IV/2015/0).References
- V. Lanzotti, Diterpenes for therapeutic use, in Natural products, Phytochemistry, botany, and mechanism of alkaloids, phenols and terpenes, ed. K. G. Ramawati and J. M. Merilon, Springer-Verlag, Berlin, Heidelberg, 2013, pp. 3171–3191 Search PubMed.
- F. Pollastro, S. Golin, G. Chianese, M. Y. Putra, A. S. Moriello, L. D. Petrocellis, V. García, E. Munoz, O. Taglialatela-Scafati and G. Appendino, J. Nat. Prod., 2016, 79, 1762–1768 CrossRef CAS PubMed.
- L. F. Liang and Y. W. Guo, Chem. Biodiversity, 2013, 10, 2161–2196 CAS.
- A. A. Zaki, Biosens. Anal. Biotechnol., 2014, 1, 1–3 Search PubMed.
- G. Pescitelli, T. Kurtán and K. Krohn, Assignment of the Absolute Configurations of Natural Products by Means of Solid-State Electronic Circular Dichroism and Quantum Mechanical Calculations, in Comprehensive Chiroptical Spectroscopy, ed. N. Berova, R. W. Woody, P. Polavarapu and K. Nakanishi, Wiley, New York, 2012, pp. 145–176 Search PubMed.
- J. Ren, Y. G. Wang, A. G. Wang, L. Q. Wu, H. J. Zhang, W. J. Wang, Y. L. Su and H. L. Qin, J. Nat. Prod., 2015, 78, 2322–2331 CrossRef CAS PubMed.
- T. E. Alemika, G. O. Onawunmi and T. A. Olugbade, Journal of Pharmacy and Bioresources, 2004, 1, 7–11 Search PubMed.
- S. K. Avula, H. Hussain, R. Csuk, S. P. Sommerwerk, P. Liebing, M. Górecki, G. Pescitelli, A. Al-Rawahi, N. Ur Rehman, I. R. Green and A. Al-Harrasi, Tetrahedron: Asymmetry, 2016, 27, 829–833 CrossRef CAS.
- G. Pescitelli, T. Kurtán, U. Flörke and K. Krohn, Chirality, 2009, 21, E181–E201 CrossRef CAS PubMed.
- T. Kurtán, R. Jia, Y. Li, G. Pescitelli and Y.-W. Guo, Eur. J. Org. Chem., 2012, 6722–6728 CrossRef.
- A. Cimmino, V. Mathieu, M. Masi, R. Baroncelli, A. Boari, G. Pescitelli, M. Ferderin, R. Lisy, M. Evidente, A. Tuzi, M. C. Zonno, A. Kornienko, R. Kiss and A. Evidente, J. Nat. Prod., 2016, 79, 116–125 CrossRef CAS PubMed.
- P. Zhang, L.-H. Meng, A. Mandi, X.-M. Li, T. Kurtán and B.-G. Wang, RSC Adv., 2015, 5, 39870–39877 RSC.
- P. Sun, D. X. Xu, A. Mandi, T. Kurtán, T. J. Li, B. Schulz and W. Zhang, J. Org. Chem., 2013, 78, 7030–7047 CrossRef CAS PubMed.
- S. Lu, T. Kurtán, G. J. Yang, P. Sun, A. Mandi, K. Krohn, S. Draeger, B. Schulz, Y. H. Yi, L. Li and W. Zhang, Eur. J. Org. Chem., 2011, 28, 5452–5459 CrossRef.
- S. Lu, P. Sun, T. Li, T. Kurtán, A. Mandi, S. Antuš, K. Krohn, S. Draeger, B. Schulz, Y. Yi, L. Li and W. Zhang, J. Org. Chem., 2011, 76, 9699–9710 CrossRef PubMed.
- H.-W. Liu, X.-Z. Yu, D. Padula, G. Pescitelli, Z.-W. Lin, F. Wang, K. Ding, M. Lei and J.-M. Gao, Eur. J. Med. Chem., 2013, 59, 265–273 CrossRef CAS PubMed.
- J. Frelek, M. Górecki, M. Łaszcz, A. Suszczyńska, E. Vass and W. J. Szczepek, Chem. Commun., 2012, 5295–5297 RSC.
- G. Pescitelli and T. Bruhn, Chirality, 2016, 28, 466–474 CrossRef CAS PubMed.
- S. Superchi, P. Scafato, M. Górecki and G. Pescitelli, Curr. Med. Chem., 2017, 24 DOI:10.2174/0929867324666170310112009.
- K. Krohn, U. Farooq, U. Flörke, B. Schulz, S. Draeger, G. Pescitelli, P. Salvadori, S. Antuš and T. Kurtán, Eur. J. Org. Chem., 2007, 3206–3211 CrossRef CAS.
- M. Saleem, H. Hussain, I. Ahmed, S. Draeger, B. Schulz, K. Meier, M. Steinert, G. Pescitelli, T. Kurtán, U. Flörke and K. Krohn, Eur. J. Org. Chem., 2011, 808–812 CrossRef CAS.
- T. Bruhn, A. Schaumlöffel, Y. Hemberger and G. Bringmann, Chirality, 2013, 25, 243–249 CrossRef CAS PubMed.
- T. Bruhn, A. Schaumlöffel, Y. Hemberger and G. Pescitelli, SpecDis version 1.70, Berlin, Germany, 2017. https://specdis-software.jimdo.com/ Search PubMed.
Footnotes |
| † Dedicated to Professor Atta-ur-Rahman on the occasion of his 75th birthday. |
| ‡ Electronic supplementary information (ESI) available. CCDC 1555949. For ESI and crystallographic data in CIF or other electronic format see DOI: 10.1039/c7ra07351h |
| This journal is © The Royal Society of Chemistry 2017 |

