 Open Access Article
A study on the mechanical, thermal properties and crystallization behavior of poly(lactic acid)/thermoplastic poly(propylene carbonate) polyurethane blends
Jia Yangabc,
Hongwei Panbc,
Xin Liabc,
Shulin Suna,
Huiliang Zhang *b and
Lisong Dongb
aChangchun University of Technology, Changchun 130012, China
bKey Laboratory of Polymer Ecomaterials, Chinese Academy of Sciences, Changchun Institute of Applied Chemistry, Changchun 130022, China. E-mail: hlzhang@ciac.ac.cn
cUniversity of Science and Technology of China, 230026, China
First published on 28th September 2017
Abstract
Poly(lactic acid) (PLA) was toughened by the thermoplastic poly(propylene carbonate) polyurethane (PPCU), and the mechanical properties, crystallization behaviour and enzymatic degradation of the PLA/PPCU blends were investigated. The mechanical testing results showed that the impact strength and elongation at break of PLA/PPCU blends were remarkably higher than those of pure PLA. The impact strength was enhanced from 4.8 kJ m−2 for pure PLA to 102.8 kJ m−2 for the 50/50 PLA/PPCU blend. The impact testing showed obvious ductile fracture after PLA was blended with PPCU. It was found that the PLA matrix showed large plastic deformation (shear yielding) in the blend subjected to impact tests, which is an important energy-dissipation process and led to a toughened polymer blend. PPCU could act as an impact modifier for PLA. The maximum improvement in the cold crystallization temperature (Tcc) value was observed for PLA/PPCU blends where Tcc was increased from 113 °C to 128 °C. PPCU enhanced the crystallization degree of PLA, but the positive function of crystallization was weakened when the content of PPCU was increased from 10 to 50 wt%. Isothermal crystallization kinetics showed that PPCU improved the crystallinity of the PLA and reduced the crystallization rate of blends. And the incorporation of PPCU did not alter the crystal structure of the PLA matrix. The PLA/PPCU blends were high strength and high toughness, entirely biodegradable materials, which is important for manufacture and application.
Introduction
Poly(lactic acid) (PLA) is an aliphatic and thermoplastic polyester that has attracted considerable attention because of its biodegradability, biocompatibility, compostable characteristics and nontoxicity to the human body and environment. PLA is one of the widest applied biodegradable materials, but the product varieties are limited due to its brittleness. Toughening is important for the application of PLA.1–7In recent years, there have been many methods reported for enhancing the toughness of PLA, including blending with elastomers, core–shell structural impact modifiers, copolymerization strategies, plasticization with a miscible component and blending with an immiscible homopolymer or copolymer.8
Elastomer and rubber impact modifiers, such as natural rubber (NR),9–11 epoxidized natural rubber (ENR),12–14 nanofibers,15 poly[(butylene adipate)-co-terephthalate](PBAT),16–18 thermoplastic polyurethane(TPU)19–22 and poly(propylene carbonate) (PPC)23,24 were used for flexibilizer of PLA. Pongtanayut et al.25 have reported that the properties of PLA/natural rubber (NR) and PLA/epoxidized natural rubber (ENR) were compared with the properties of PLA. Kanzawa et al.26 have improved the mechanical properties of PLA/PBAT blends, examining the morphological changes of PLA/PBAT/PC, and elucidating the mechanism for improvement of the mechanical properties of the blends. Zou et al.24 have reported that PLA/PPC blends were prepared via vane extruder with a short thermo-mechanical history. Compared with those of the traditional extruder, better mechanical properties and finer dispersion particles have been achieved.
Core–shell impact modifiers, such as acrylic impact modifier (ACR),27,28 acrylonitrile–butadiene–styrene (ABS)29 and methyl methacrylate–butadiene–styrene (MBS),30 are important types of toughener of PLA. Li et al.31 have reported that ACR with different core–shell ratios were synthesized and used to toughen PLA. The impact strength of PLA could be significantly improved by ACR. Sun et al.32 have explored the use of GMA-functionalized ABS (ABS-g-GMA) core–shell particles to toughen PLA. Zhang et al.30 have reported that PLA was compatible with a core–shell of MBS and MBS could be used effectively as an impact modifier of PLA.8
Although NR, ENR, ACR, and MBS have a good toughening effect, they are non-biodegradable materials. And it will have harmful effects on the environment after application. However, the properties of PLA/PBAT blends have superior performance in the practical field, but the high cost of PBAT is disadvantage for the widespread application of PLA. Poly(propylene carbonate) (PPC) is also a biodegradable aliphatic polycarbonate,33 and the low cost of PPC is advantage for the widespread application of PLA. But the properties of PLA/PPC blends are insufficient for the widespread application of PLA, it can be seen in the past study. PPCU was prepared by using PPC and polyols as the raw materials and diphenyl-methane-diisocyanate (MDI) as the extender chain.34
In the research here, PPCU was chosen to toughen PLA. PLA was blended with PPCU by internal mixer. The miscibility, mechanical properties, phase morphology, and crystallization behavior of PLA/PPCU blends were investigated. The impact strength and the elongation at break of PLA/PPCU were improved nearly 25 and 60 times in comparison with those of neat PLA.
Experimental
Materials and preparation of the blends
PLA Grade 4032 D (2% D-lactide, 98% L-lactide content) was obtained from Natureworks LLC (United States). The general molecular weight (Mw) average was about 2.07 × 10⁵ g mol−1, polydispersity of 1.73. Thermoplastic poly(propylene carbonate)polyurethane (PPCU) was purchased from Jiangsu Zhongke Jinlong Chemical Co., Ltd.PLA and PPCU were dried at 70 °C for 8 h in a drying cabinet. First, PLA/PPCU blends were prepared by melt mixing with a Haake Rheomix 600 (Karlsruhe, Germany) at a rotating speed 60 rpm at 190 °C for 5 min. The mixing compositions of the PLA/PPCU blends were 100/0, 90/10, 80/20, 70/30, 60/40, and 50/50 w/w. Then, all the samples and pure PLA were compression molded into sheets with thicknesses of 3.0 and 1.0 mm at 190 °C for impact strength measurement, tensile measurement, differential scanning calorimetry, dynamic mechanical analysis, phase morphology tests, rheological measurements.
Characterization
Structure analysis. The chemical structure of PPC and PPCU were analyzed with a Fourier transform infrared spectrophotometer (FTIR, Perkin Elmer, 2200, USA) with the wave number ranging from 4000 to 400 cm−1. The molecular weight of PPCU was measured by gel permeation chromatography (GPC, Waters 1515, USA), the eluent was tetramethylene oxide, and flow rate was 1.0 ml min−1.The procedures for isothermal crystallization kinetic experiments were as follows: all samples were heated to 195 °C at 45 °C min−1 and held for 3 min to eliminate the previous thermal history, and then cooled from 195 °C down to 90 °C at 45 °C min−1, until the crystallization was completed. After that, the samples were repeatedly heated to 195 °C at a rate of 45 °C min−1, held for 3 min. Then the samples cooled from 195 °C down to 94 °C, 98 °C, 102 °C and 106 °C at 45 °C min−1, respectively, until the crystallization was completed.
Small-angle X-ray scattering (SAXS) experiments of undeformed specimens were performed at RT using a NanoSTAR-U (Bruker AXS Inc., Germany) with Cu Kα radiation (wavelength, λ = 0.154 nm). The generator was operated at 40 kV and 650 μA. Two-dimensional SAXS patterns were obtained with a HI-STAR detector. The sample-to-detector distance was LSD = 1074 mm. The effective scattering vector q (q = (4π/λ)sin![[thin space (1/6-em)]](https://www.rsc.org/images/entities/char_2009.gif) θ, where 2θ is the scattering angle) at this distance ranged from 0.044 to 2.0 nm−1. The X-ray exposure time was 60 min.
θ, where 2θ is the scattering angle) at this distance ranged from 0.044 to 2.0 nm−1. The X-ray exposure time was 60 min.
The crystallite morphology of PLA/PPCU blends was observed with a Leica DMLP polarized microscope (POM) (Wetzlar, Germany) equipped with a Linkam TM600 hot stage and a computer-controlled charged-coupled-device camera. A small amount of samples with the thickness of approximately 0.05 mm was sandwiched between two microscopic cover glasses and then placed on the hot stage. The samples were heated from room temperature to 190 °C at a rate of 30 °C min−1, held at 190 °C for 3 min to eliminate previous thermal history, and then quenched to 120 °C at a rate of 30 °C min−1 for isothermal crystallization and held for 60 min. The morphology changes were recorded during the crystallization process.
![[thin space (1/6-em)]](https://www.rsc.org/images/entities/char_2009.gif) δ) versus the storage modulus (E′). The size of the sample was L × W × H = 10 × 5 × 1 mm3. The experiment was performed in a tension mode at a constant heating rate of 3 °C min−1 and a frequency of 1 Hz. The temperature ranged from 10 to 90 °C for PLA/PPCU samples.
δ) versus the storage modulus (E′). The size of the sample was L × W × H = 10 × 5 × 1 mm3. The experiment was performed in a tension mode at a constant heating rate of 3 °C min−1 and a frequency of 1 Hz. The temperature ranged from 10 to 90 °C for PLA/PPCU samples.Results and discussion
Structure analysis
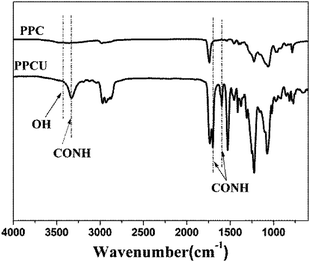
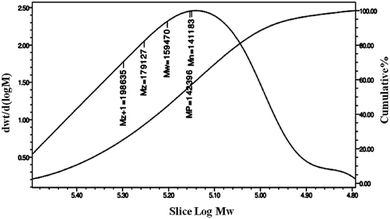
FT-IR spectra of PPC and PPCU were displayed in Fig. 1. It was seen that the band corresponding to the terminal hydroxy bonds of PPC at 3420 cm−1 disappeared, and new bands corresponding to the NH and NHCO bonds appeared at 3340 and 1592 cm−1, respectively.35 The structure diagram of PPCU was exhibited as Scheme 1. In Fig. 2, it indicated that the weight-average molecular weight of PPCU was Mw = 1.595 × 10⁵ g mol−1, and polydispersity was 1.13 from gel permeation chromatography analysis.Mechanical properties
Fig. 3 showed the notched Izod impact strength, tensile strength and elongation at break of PLA/PPCU blends, it indicated that the toughness of PLA was improved with the addition of PPCU. The notched impact strength of pure PLA was about 4.8 kJ m−2. From Fig. 3(a), it was shown that there was no obvious improvement of impact strength for the 90/10 PLA/PPCU blend. However, with the further increase of PPCU content from 10 to 50 wt% in the PLA/PPCU blends, the notched impact strength of the blends was significantly improved from 5.4 kJ m−2 to 102.8 kJ m−2. The brittle–ductile transition of the blends was obtained when the PPCU contents varied from 10 to 20 wt%.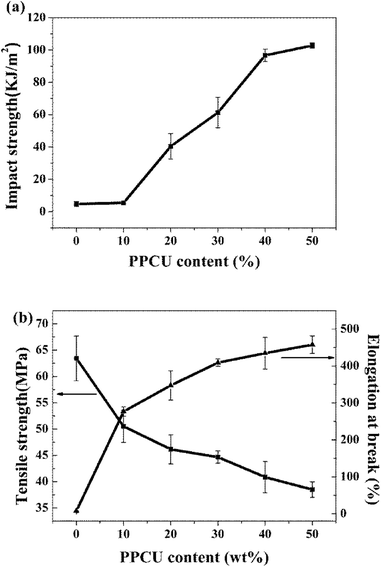 | ||
| Fig. 3 The Mechanical properties of PLA/PPCU blends (a) Impact strength, (b) Tensile strength and elongation at break. | ||
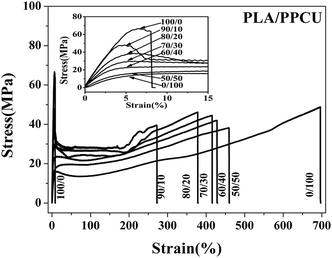
The impact strength, Young's modulus, tensile strength, and elongation at break of PLA/PPCU blends were summarized in Table 1. It indicated that the brittle properties of PLA could be modified by the addition of PPCU. The elongation at break of pure PLA was about 7.3%, whereas the elongation at break of 50/50 PLA/PPCU blend was about 457.9%. The elongation at break of 50/50 PLA/PPCU blends was improved nearly 60 times in comparison with that of pure PLA. These results also indicated that the PPCU could significantly improve the mechanical properties of PLA.
| PLA/PPCU (wt/wt) | Impact strength (kJ m−2) | Young's modulus (MPa) | Tensile strength (MPa) | Elongation at break (%) |
|---|---|---|---|---|
| 100/0 | 4.8 ± 1.4 | 1431.2 ± 102.3 | 63.4 ± 4.3 | 7.3 ± 0.8 |
| 90/10 | 5.4 ± 0.6 | 1336.6 ± 92.4 | 50.5 ± 3.0 | 276.8 ± 12.6 |
| 80/20 | 40.4 ± 7.9 | 1085.0 ± 85.8 | 46.2 ± 2.8 | 347.3 ± 39.4 |
| 70/30 | 61.3 ± 9.4 | 899.7 ± 94.8 | 44.7 ± 1.2 | 409.2 ± 10.2 |
| 60/40 | 96.7 ± 3.8 | 706.5 ± 87.2 | 40.9 ± 3.0 | 434.8 ± 43.1 |
| 50/50 | 102.8 ± 1.6 | 458.5 ± 39.5 | 38.5 ± 1.5 | 457.9 ± 23.6 |
| 0/100 | — | 308.5 ± 71.8 | 37.8 ± 3.2 | 661.4 ± 49.3 |
Fig. 4 shows tensile stress–strain curves of PLA/PPCU, pure PLA was brittle fracture, and the PLA/PPCU blends generated shear yield when the PPCU contents was 10%. In the other word, the brittle–ductile transition of the blends was obtained after in addition of PPCU. The yield strength of PLA/PPCU blends decreased continuously with increasing PPCU content. This addicted that the brittle of PLA had been weaken and the toughness been greatly enhanced.
Toughening mechanism
Scanning electron microscopy (SEM) was used to investigate the toughening mechanism of PLA/PPCU blends. The SEM photographs were shown in Fig. 5. The impact fracture surfaces of PLA/PPCU blends were observed by using SEM. From Fig. 5(a–f), the impact fracture surface of pure PLA showed relatively smooth, indicating that little shear yielding had taken place during the impact test. This was in agreement with low impact strength of pure PLA.31 From Fig. 5(c), as the PPCU content of PLA/PPCU reached 20 wt%, rough surface could be seen on the fracture surface of PLA/PPCU blend. This was consistent with the results of the impact strength of the blends. The fracture surface of PLA/PPCU blend was different from other photographs. Obvious many root-like whiskers and many long stretches of the ligaments structure could be seen on the fracture surface of the 80/20 and 70/30 PLA/PPCU blends. From Fig. 5(d) and (e), more obvious filiform structure could be seen on fracture surface of PLA/PPCU blends with further increasing PPCU content from 40 to 50 wt%.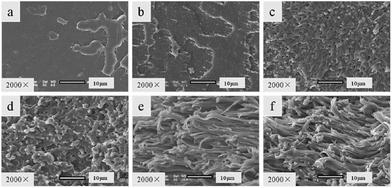 | ||
| Fig. 5 SEM photographs of the impact fracture surface of PLA/PPCU blends. (a) Pure PLA, (b) PLA/PPCU 90/10, (c) 80/20, (d) 70/30, (e) 60/40 and (f) 50/50. | ||
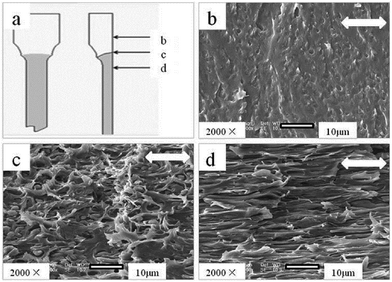
From Fig. 6, obvious cavities could be seen on the PLA/PPCU blends. Bucknall et al.36 had reported that elastomeric play two roles: first, as a stress concentration induced a large amount of silver lines and shear zone. Second, control the silver grain development and make silver grain into destructive crack timely termination without development. Cavitations are important in notched specimens because it enables the blend to yield at moderate stresses under plane strain conditions. The cavities were formed because that two-phase′s surface had debonded between PLA and PPCU when the blends were pulled out. To study the toughening mechanism of PLA/PPCU blends, the necked down region of the tensile specimen was cryo-fractured longitudinally.8 SEM micrographs of fractured surfaces were shown in Fig. 6. The micrographs of the tensile specimen were taken at different locations of the necked down region as depicted in Fig. 6(a), where the stress state varied. The materials which had no necking in the tensile test demonstrated a smooth longitudinal fracture surface without visible plastic deformation in Fig. 6(b). Some obvious cavities could be seen on the PLA/PPCU blends. The cavities had been observed when the PPCU phase was pulled out from the PLA matrix due to debonding. In Fig. 6(c) and (d), oval cavities were visible near the necked down region of the PLA/PPCU blends during tension where enlarging stresses were created. These cavities were formed when the volumetric strain energy released by forming a void was greater than the surface energy needed to form new surface plus the energy needed to stretch the surrounding elastomeric particles to make space for the void.26 These cavities were enlarged in the stress direction along with the deformation of the matrix. It indicated that shear yielding occurred in the PLA matrix as induced by the cavitation of PPCU particles was the major toughening-mechanism.
Thermal properties
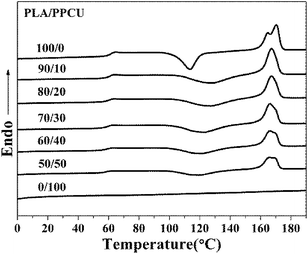
Differential scanning calorimetry (DSC) heating thermograms of samples were shown in Fig. 7, and the corresponding parameters for the PLA/PPCU blends were summarized in Table 2.| PLA/PPCU (wt/wt) | Tg (°C) | Tcc (°C) | ΔHcc (J g−1) | Xc (%) | Tm (°C) | ΔHf (J g−1) |
|---|---|---|---|---|---|---|
| 100/0 | 63.2 | 113.6 | 32.3 | 40.6 | 170.3 | 37.8 |
| 90/10 | 61.2 | 128.0 | 31.0 | 41.2 | 167.3 | 34.5 |
| 80/20 | 60.9 | 127.1 | 27.7 | 41.9 | 167.2 | 31.2 |
| 70/30 | 60.1 | 122.9 | 25.2 | 44.2 | 166.2 | 28.8 |
| 60/40 | 59.6 | 121.0 | 20.7 | 43.9 | 166.2 | 24.5 |
| 50/50 | 58.7 | 119.0 | 15.0 | 40.6 | 165.8 | 18.9 |
| 0/100 | 14.6 | — | — | — | — | — |
As shown in Fig. 7, three main transitions successively could be observed: a glass transition, a cold crystallization exotherm and a melting endotherm. It could be seen that pure PLA exhibited a glass transition at 63.2 °C. The addition of PPCU had taken place a marked change in the glass transition temperature of PLA. The addition of PPCU decreased the glass transition temperature from 63.2 °C for pure PLA to 58.7 °C for the 50/50 PLA/PPCU blend.
The absolute degree of crystallinity (Xc) of the samples was evaluated from the heat evolved during crystallization by the following relationship (eqn (1)):
 | (1) |
 is the heat of fusion for 100% crystalline PLA (93 J g−1)37 and WPLA is the weight fraction of PLA in the blend.
From Fig. 7, pure PLA exhibited a cold crystallization temperature at 113.6 °C. The addition of PPCU increased the cold crystallization temperature from 113.6 °C for pure PLA to 119.0 °C for the 50/50 PLA/PPCU blend. It was therefore demonstrated that the addition of PPCU made it easier for PLA to crystallize. It indicated that PPCU could improve the crystallization temperature for PLA. But the positive function of crystallization was weaken when the content of PPCU further increasing. The process could be expressed as Scheme 2, and the content of PPCU gradually increasing from a to d. It could be seen that before the melting peak was accompanied by a small exothermic peak for pure PLA. It was generated the metastable α′-form crystal because the cold crystallization of PLA occurred in the temperature range lower than Tcritical (approximately 120 °C) temperature range. The α′-form would be transformed into more stable α-form crystal when heated to high temperature (approximately 165 °C), α′–α phase transition leading to the generation of the exothermic peak. It could be seen from the Fig. 7, the double melting peak moved from high to low temperatures with increasing PPCU content. It indicated that the addition of PPCU main effect was to promote the formation of α′-form crystal.
The effect of PPCU on the ability of PLA to crystallize could be further confirmed from the low heat of fusion (ΔHf) of the PLA/PPCU blends in comparison to that of pure PLA (Table 2). However, the value of WPLA × decreased faster comparing to that of ΔHf with increasing PPCU content in the blends, the result suggesting that PPCU enhanced the crystallinity of PLA. The value of ΔHf decreased, indicated that the crystallinity of blends was decreasing with increasing PPCU content in the blends. It also indirectly indicated that the PLA/PPCU blends had obtained higher toughness.
Isothermal crystallization kinetics
The well-known Avrami equation38,39 was used to analyze the remarkable overall isothermal crystallization kinetics of blend samples. It assumes that the relative crystallinity X(t) develops as a function of crystallization time t as follows:| X(t) = 1 − exp(−Ktn) | (2) |
The Avrami equation could be further deduced as,
lg[−ln(1 − X(t))] = lg![[thin space (1/6-em)]](https://www.rsc.org/images/entities/char_2009.gif) K + n K + n![[thin space (1/6-em)]](https://www.rsc.org/images/entities/char_2009.gif) lg lg![[thin space (1/6-em)]](https://www.rsc.org/images/entities/char_2009.gif) t t
| (3) |
![[thin space (1/6-em)]](https://www.rsc.org/images/entities/char_2009.gif) t result in a linear relationship. From the slope and intercept of the curves, the Avrami exponent n and rate constant K can be obtained, and the value of n and K was enumerated in Table 3.
t result in a linear relationship. From the slope and intercept of the curves, the Avrami exponent n and rate constant K can be obtained, and the value of n and K was enumerated in Table 3.
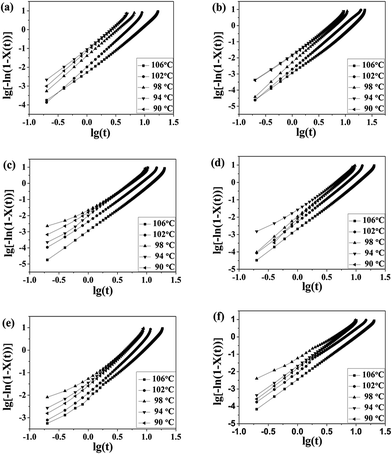 | ||
Fig. 8 Plots of lg{−ln[1 − X(t)]} versus lg![[thin space (1/6-em)]](https://www.rsc.org/images/entities/char_2009.gif) t for isothermal crystallization at the indicated temperatures: (a) pure PLA, (b) PLA/PPCU 90/10, (c) 80/20, (d) 70/30, (e) 60/40, (f) 50/50. t for isothermal crystallization at the indicated temperatures: (a) pure PLA, (b) PLA/PPCU 90/10, (c) 80/20, (d) 70/30, (e) 60/40, (f) 50/50. | ||
| PLA/PPCU (wt/wt) | Tc (°C) | K | n | t1/2 (min) | tmax (min) | g |
|---|---|---|---|---|---|---|
| 100/0 | 106 | 0.005 | 2.5 | 7.17 | 14.08 | 0.14 |
| 102 | 0.010 | 2.8 | 4.43 | 9.01 | 0.23 | |
| 98 | 0.039 | 2.7 | 2.93 | 5.89 | 0.34 | |
| 94 | 0.097 | 2.5 | 2.40 | 4.82 | 0.42 | |
| 90 | 0.072 | 2.7 | 2.30 | 4.64 | 0.43 | |
| 90/10 | 106 | 0.001 | 2.7 | 11.85 | 23.89 | 0.08 |
| 102 | 0.002 | 2.8 | 8.11 | 16.48 | 0.12 | |
| 98 | 0.005 | 3.0 | 5.44 | 11.15 | 0.18 | |
| 94 | 0.016 | 2.6 | 4.83 | 9.60 | 0.21 | |
| 90 | 0.014 | 2.6 | 4.58 | 9.08 | 0.22 | |
| 80/20 | 106 | 0.001 | 2.8 | 10.38 | 21.11 | 0.10 |
| 102 | 0.004 | 2.7 | 6.73 | 13.54 | 0.15 | |
| 98 | 0.025 | 2.3 | 4.89 | 10.20 | 0.20 | |
| 94 | 0.008 | 2.9 | 4.57 | 9.35 | 0.22 | |
| 90 | 0.017 | 2.5 | 4.34 | 8.56 | 0.23 | |
| 70/30 | 106 | 0.002 | 2.7 | 9.18 | 18.49 | 0.11 |
| 102 | 0.005 | 2.8 | 5.96 | 12.05 | 0.17 | |
| 98 | 0.010 | 2.8 | 4.49 | 9.14 | 0.22 | |
| 94 | 0.031 | 2.4 | 3.72 | 9.05 | 0.27 | |
| 90 | 0.007 | 3.0 | 3.45 | 8.15 | 0.29 | |
| 60/40 | 106 | 0.010 | 2.2 | 7.14 | 12.87 | 0.14 |
| 102 | 0.013 | 2.4 | 5.24 | 10.08 | 0.19 | |
| 98 | 0.064 | 2.0 | 4.34 | 8.62 | 0.23 | |
| 94 | 0.041 | 2.3 | 3.50 | 7.53 | 0.29 | |
| 90 | 0.029 | 2.4 | 3.27 | 7.26 | 0.31 | |
| 50/50 | 106 | 0.003 | 2.5 | 8.40 | 16.51 | 0.12 |
| 102 | 0.017 | 2.2 | 5.33 | 9.85 | 0.19 | |
| 98 | 0.109 | 2.3 | 4.99 | 8.06 | 0.20 | |
| 94 | 0.021 | 2.5 | 4.04 | 7.96 | 0.25 | |
| 90 | 0.015 | 2.6 | 3.32 | 7.63 | 0.30 |
For pure PLA sample, the n values observed in the present work were around 2.5–2.8. For the 90/10, 80/20, and 70/30 PLA/PPCU blends, the n values were between 2.3 and 3.0, which suggested that the 90/10, 80/20, and 70/30 PLA/PPCU blends have a stronger trend of instantaneous three-dimensional growth than pure PLA. The other n-values of the 60/40 and 50/50 PLA/PPCU blends are between 2.0 and 2.6.
Wunderlich40 had attributed an Avrami n exponent of 3 to spherical structure resulting from instantaneous nucleation (that is, the number of nuclei reaches a steady state value rapidly after crystallization begins) and an exponent n between 2 and 3 to truncated spheres resulting from instantaneous nucleation with diffusion control. This fact indicates that the incorporation of the PPCU content is larger than 40%, and PPCU can be used as a amorphous polymer that impede the diffusion of PLA macromolecular chains. The overall rate constant K is extremely sensitive to temperature, which determines both the nucleation and the growth processes. The K values of all the samples decrease with increase in the crystallization temperature, and this means both the nucleation rate and growth rate decrease as the crystallization temperature increases. However, at the same crystallization temperature, all of the PLA/PPCU blends have lower K values than pure PLA, which also indicates that an addition of PPCU in PLA decreases the crystallization rate of PLA.
For all samples, the effect of PPCU on the crystallization rate K (Table 3), the inclusion of PPCU significantly decreased the crystallization rates of the PLA/PPCU blends, compared to the pure PLA.
Meanwhile, t1/2 can be determined from the measured kinetic parameters according to the following equation:41
t1/2 = (ln![[thin space (1/6-em)]](https://www.rsc.org/images/entities/char_2009.gif) 2/K)1/n 2/K)1/n
| (4) |
The overall crystallization rate (G) calculated from the reciprocal of crystallization half time is listed in Table 3 as well.
| G = 1/t1/2 | (5) |
It is clearly observed that the trend of G is similar to that of K. In Table 3, the result of isothermal crystallization kinetic indicated that the values of t1/2 of PLA/PPCU blends increasing after in addition of PPCU, compared to the pure PLA. It can be explained that the PLA was dispersed and impeded by high content of PPCU, and the crystallization ability of blends was weaken. But the values of t1/2 were gradually decreased with increasing PPCU content from 10 to 50 wt%. It indicated that PPCU could improve the crystallization rate of PLA when the PPCU content varied from 10 to 50 wt%. It was further verified for the trend of G value. In one word, the crystallization degree of PLA/PPCU blends was decreased with the addition of PPCU, and embodied in improving the toughness of PLA.
Crystalline morphology
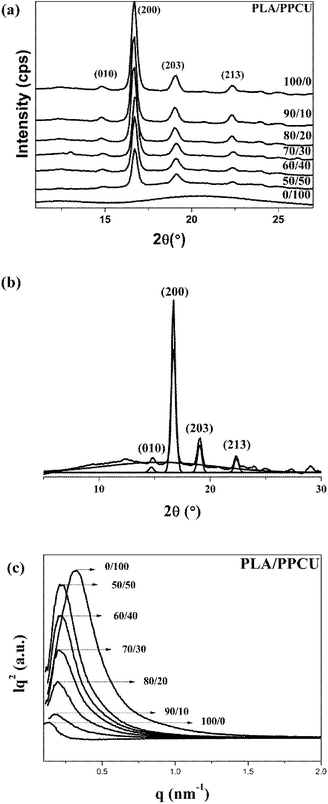
As a semicrystalline polymer, the crystal structure and morphology of PLA have been extensively investigated using many techniques from the academic viewpoint of structural interest. X-ray diffraction is one of the most accurate and representative techniques. It has been reported that PLA crystallizes in seven forms (α, α′, α′′, β, γ, ε, and stereo complex),42 the formation of which depends on the crystallization conditions. The most common α-form occurred in conventional melt and solution crystallization conditions. Therefore, to get further information about the crystal morphologies of pure PLA and PLA/PPCU blends, wide-angle X-ray diffraction experiment was performed in this study. Fig. 9 showed the WAXD patterns of pure PLA and PLA/PPCU blends. Curves are expressed to those crystallized isothermally at 120 °C for 1 h. Certainly, it is enough to complete the crystallization processes of PLA samples at 120 °C. The most representative peaks of the α-form crystals can be observed at diffraction angles 2θ of 14.8 (010), 16.7 (200), 19.0 (203), 22.3 (213), indicating that PLA is the typical orthorhombic crystal. It can be seen that the incorporation of PPCU does not alter the crystal structure of the PLA matrix. Wu et al.43 reported that the pure PLA isothermally crystallized by cooling in the air showing three small characteristic peaks, indicating that the sample is almost amorphous (low crystallinity) attribute to the low homogeneous crystallization rate during the rapid-cooling treatment. However, when the PLA samples are isothermally crystallized at 120 °C for 1 h, four distinct diffraction peaks at 14.8 (010), 16.7 (200), 19.0 (203) and 22.3 (213) are appeared. The most common explanation for this phenomenon is that the isothermal crystallization at a suitable temperature can contribute to the formation of the lamella, thus the crystals are likely more perfect of lager size or lamella thickness, better organized spherulites and increase of crystallinity. These above results suggest that the formation of perfect α-form crystals may be related to additives component, crystallization temperature, and time employed.43Fig. 9 shows the WAXD patterns for the pure PLA and PLA/PPCU blends. It can be seen that the incorporation of PPCU does not change the crystal structure of PLA in the blends relative to the pure PLA. The degree of crystallinity of PLA was calculated as eqn (6):
 | (6) |
 | (7) |
![[thin space (1/6-em)]](https://www.rsc.org/images/entities/char_2009.gif) 2θ)/sin2
2θ)/sin2![[thin space (1/6-em)]](https://www.rsc.org/images/entities/char_2009.gif) θ
θ![[thin space (1/6-em)]](https://www.rsc.org/images/entities/char_2009.gif) cos
cos![[thin space (1/6-em)]](https://www.rsc.org/images/entities/char_2009.gif) θ, the temperature factor (T) = e−2B(sin
θ, the temperature factor (T) = e−2B(sin![[thin space (1/6-em)]](https://www.rsc.org/images/entities/char_2009.gif) θ/λ)2, and 2B = 10. fi can be expressed approximately by
θ/λ)2, and 2B = 10. fi can be expressed approximately by
 | (8) |
The total WAXD curve of pure PLA was resolved into crystalline and amorphous portions (Fig. 9). From eqn (6)–(8), the X-ray diffraction data of the PLA/PPCU blends are shown in Table 4. Ihkl = Ci,hkl(θ)Ii,hkl(θ) or Ca(θ)Ia(θ) is the integrating intensity scattered over a suitable angular interval by the crystalline and the amorphous phases, respectively. There are 3 atoms of carbon, 4 atoms of hydrogen, and 2 atoms of oxygen in a repeating unit of PLA; the total atomic scattering factor wasfhkl2 = 3fC2 + 4fH2 + 2fO2, where ki = 0.9, Ca(θ) = 1, and K = kiCa(θ) = 0.9. With the data of Table 4, eqn (6) can be reduced to give eqn (9).
 | (9) |
| hkl | A | 010 | 200 | 203 | 213 |
| 2θ | 16.1 | 14.8 | 16.7 | 19 | 22.3 |
| Ia(θ) or Ii,hkl(θ) | 28![[thin space (1/6-em)]](https://www.rsc.org/images/entities/char_2009.gif) 831 831 |
1295 | 9000 | 5016 | 2484 |
| I | 25![[thin space (1/6-em)]](https://www.rsc.org/images/entities/char_2009.gif) 947.9 947.9 |
1043.6 | 9908.7 | 7856.4 | 6235.2 |
| T | 0.92 | 0.93 | 0.92 | 0.85 | 0.85 |
| f2 = 12fH2 + 12fC2 + 4fO2 | 193.9 | 200.0 | 191.0 | 179.6 | 162.9 |
| LP | 99.0 | 117.6 | 91.9 | 70.5 | 50.6 |
| C(θ) | 1.0 | 0.8 | 1.1 | 1.6 | 2.5 |
| K | 0.9 |
| PLA/PPCU | 100/0 | 90/10 | 80/20 | 70/30 | 60/40 | 50/50 |
| Wc,x(%) | 49.06 | 50.30 | 51.26 | 52.38 | 50.01 | 49.32 |
SAXS was used to investigate the crystal structure and macrostructure of neat PLA before and after blending with PPCU. Fig. 9 shows the Lorentz-corrected SAXS curves of the blends at various compositions annealed at 120 °C for 1 h.
The long spacing dac, which was defined as the crystal layer thickness together with one interlamellar amorphous layer, measured along the lamella normal and calculated using Bragg eqn (6).44
The crystal layer thickness dc and the amorphous layer thickness da can be calculated using eqn (11) and (12), respectively.
 | (10) |
| dc = dac × Xc | (11) |
| da = dac − dc | (12) |
Here qmax represents the position of the intensity maximum in a SAXS pattern, Xc,2 represents the crystallinity of the samples of SAXS, which was derived from DSC measurement. The obtained qmax, dac, dc and da values are summarized in Table 6. In Fig. 9, pure PLA exhibits a broader scattering peak, which can be observed around q = 0.128 nm−1. The scattering peaks gradually shifted in position to higher q values with increasing PPCU content, which indicated the dac values decreased. In Table 6, the dac, dc and da values were 49.06, 19.91, and 29.14 nm, respectively, for pure PLA. For the 50/50 PLA/PPCU blend, they became 28.8, 11.69, and 17.11 nm, respectively. It is obvious that all of the values of dac, da and dc values decreased with increasing PPCU content. However, the decreases in both da and dc were large. For example, the decrease in da was around 11.96 nm after blending 50 wt% PPCU as compared to that of neat PLA. Such significant decrease in both da and dc suggested that PPCU could affect the crystalline of PLA. The size of spherulites became smaller with increasing PPCU.
| PLA/PPCU (wt/wt) | qmax (nm−1) | Xc (%) | dac (nm) | dc (nm) | da (nm) |
|---|---|---|---|---|---|
| 100/0 | 0.128 | 40.6 | 49.06 | 19.91 | 29.14 |
| 90/10 | 0.183 | 41.2 | 34.31 | 14.13 | 20.17 |
| 80/20 | 0.194 | 41.9 | 32.37 | 13.56 | 18.80 |
| 70/30 | 0.205 | 44.2 | 30.63 | 13.54 | 17.09 |
| 60/40 | 0.216 | 43.9 | 29.07 | 12.76 | 16.31 |
| 50/50 | 0.218 | 40.6 | 28.80 | 11.69 | 17.11 |
This study used POM to determine the spherulite morphologies and growth rates of the pure PLA and PLA/PPCU blends that isothermally crystallized at predetermined temperatures 120 °C for 1 h. Fig. 10 shows the polarized optical photomicrographs of several selected samples taken during the isothermal crystallization at 120 °C for 15 min. From Fig. 10(a–d), the presence of PPCU in PLA/PPCU blends resulted in the nucleating density of the spherulites being increased, the size of the spherulites decreased and obscurer spherulites boundaries. From Fig. 10(e) and (f), the nucleating density of the spherulites were slightly lower. PPCU could form continuous phase due to the content up to 40 wt%. Molten PPCU had the effects of solvent and plasticizer, and make it easier for PLA molecular chain motion so that the size of spherulites are more likely to grow up at 120 °C.
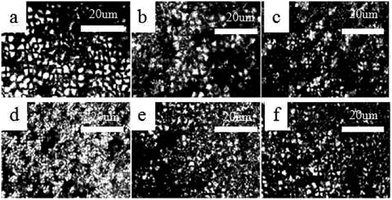 | ||
| Fig. 10 Spherulitic growth process of pure PLA and PLA/PPCU blends at a crystallization temperature of 120 °C at 15 min. (a) Pure PLA, (b) 90/10, (c) 80/20, (d) 70/30, (e) 60/40, (f) 50/50. | ||
However, it indicated that the content of PPCU in the blends affected the morphology of spherulites. PPCU had improved the crystallization degree for PLA. The crystallinity values in Tables 2 and 5 exhibit the order Wc,x > Xc. The crystallinity determined from X-ray diffraction (Wc,x) was equal to the sum of crystalline and interphase contents, while the measurement of fusion enthalpy by calorimetry (Xc) yields values which are equal to the crystalline content. Imperfections of crystals are not easily distinguished from the amorphous phase. Therefore, some disagreements among the quantitative results of crystallinity by different measurement methods are frequently encountered. These results were in consistent with the crystallinity data from DSC (Table 2), WAXD, and SAXS measurement.
Dynamic mechanical analysis
Dynamic mechanical analysis was used to analyze the modulus changes of the blends. The storage modulus (E′)-temperature curves of pure PLA and PLA/PPCU blends are exhibited in Fig. 11(a). It can be seen that PLA/PPCU blends show lower storage modulus than pure PLA from −25 to 80 °C, indicating an increase in the flexibility of PLA imparted by the PPCU. Above 50 °C, E′ decreases rapidly because of the glass transition of PLA and reaches a minimal value around 65 °C.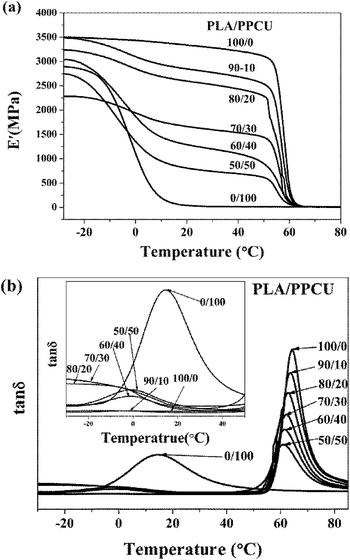 | ||
Fig. 11 (a) Dynamic storage modulus, (b) tan![[thin space (1/6-em)]](https://www.rsc.org/images/entities/char_2009.gif) δ of pure PLA and PLA/PPCU blends as a function of temperature. δ of pure PLA and PLA/PPCU blends as a function of temperature. | ||
This reflects an enhancement of sample rigidity resulting from the cold crystallization process detected using DSC. The tan![[thin space (1/6-em)]](https://www.rsc.org/images/entities/char_2009.gif) δ-temperature curves of pure PLA and PLA/PPCU blends are exhibited in Fig. 11(b). The Loss factor tan
δ-temperature curves of pure PLA and PLA/PPCU blends are exhibited in Fig. 11(b). The Loss factor tan![[thin space (1/6-em)]](https://www.rsc.org/images/entities/char_2009.gif) δ = E′′/E′, it can be seen in Fig. 11(b) that tan
δ = E′′/E′, it can be seen in Fig. 11(b) that tan![[thin space (1/6-em)]](https://www.rsc.org/images/entities/char_2009.gif) δ decrease constantly with increasing PPCU content. This indicates the elastic property of blends was improved with the addition of PPCU, and toughness was increased significantly. Fig. 11(b) showed obvious tendencies that the glass transition of PLA/PPCU blends moved toward the temperature of the glass transition of PPCU. It can be seen that the glass transition peak of PLA has evidently shifted to low temperature, and indicates that the blends are tended to toughness.
δ decrease constantly with increasing PPCU content. This indicates the elastic property of blends was improved with the addition of PPCU, and toughness was increased significantly. Fig. 11(b) showed obvious tendencies that the glass transition of PLA/PPCU blends moved toward the temperature of the glass transition of PPCU. It can be seen that the glass transition peak of PLA has evidently shifted to low temperature, and indicates that the blends are tended to toughness.
Enzymatic hydrolysis
The biodegradability of PLA/PPCU blends is extremely important for the potential application of the materials in the future. Proteinase K is the only protein that can directly produce enzymatic hydrolysis without hydrolysis. Therefore, the analysis of weight loss data evaluated the degradation of PLA/PPCU blends. As shown in Fig. 12(a), the weight loss of the blends increased with time for all samples. The weight loss of the PLA/PPCU blends was decreased from 65.9 to 50.3 wt% by incorporation of the PPCU. The rate of enzymatic degradation could be determined from the slope of the weight loss against time. There was little difference among the five samples for the enzymatic degradation before six days due to the incubation period for proteinase K.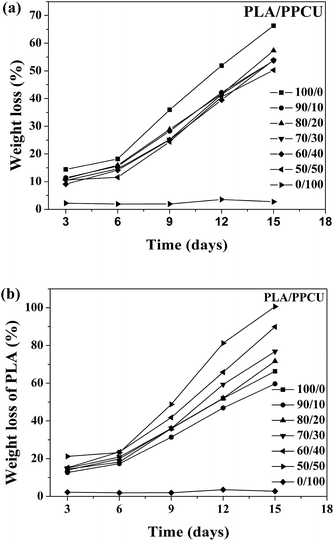 | ||
| Fig. 12 (a) The weight loss of PLA/PPCU blends and (b) the weight loss of PLA, as a function of time during the enzymatic degradation. | ||
The weight loss (WL) of the samples was calculated via eqn (13):
 | (13) |
After six days, the blends began to degradation at a faster rate. It indicated that the addition of PPCU had no obvious influence on the enzymatic degradation rate of PLA/PPCU.
The relative weight loss of PLA (WL,PLA) of the samples was calculated via eqn (14):
 | (14) |
From Fig. 12(b), it can be seen that the enzymatic degradation rate of PLA was obvious improved with gradually increasing PPCU content. The relative weight loss of PLA was improved from 59.6 to 100%. The PLA was entirely degraded in the PLA/PPCU 50/50 blends at 15th days. It can be comprehended that the PLA was hydrolyzed before degraded by enzyme, and the hydrolysis ability of PLA was improved because of PLA being dispersed by PPCU. There are more active points after PLA being hydrolyzed, then exhibit that PPCU have promoted the enzymatic degradation rate of PLA.
Conclusions
The PLA/PPCU blends were prepared via twin screw extruder. The mechanical test results showed that PLA could be remarkably toughened by in addition of PPCU. The impact strength of PLA was enhanced from 4.8 to 102.8 kJ m−2 for the 50/50 PLA/PPCU blend. The toughening-mechanism investigation revealed that shear yielding occurred in the PLA matrix as induced by the cavitation of PPCU particles. DSC analysis revealed that PPCU had distinct effect on the melting process, the temperature of cold crystallization had been obviously improved with the increase of PPCU content for PLA. PPCU enhanced the crystallization degree of PLA, but the function of promoting was weaken when the content of PPCU further increased. But the crystallization rate of PLA/PPCU blends was decreased with increasing PPCU, and the blends show up toughness. The crystallization density and spherulites size of PLA were obviously affected with the addition of PPCU, but not alter the crystalline type of PLA. The microstructure of the blends changed with the addition of PPCU. And the result indicated that the microstructure of blend was obviously changed when the PPCU content was 20 wt%. The results were further demonstrated in isothermal crystallization kinetics of blend. When the blend without PPCU content had a stress relaxation mechanism that depended on the PLA matrix, and the blends with PPCU content from 10 to 50 wt% had similar stress relaxation mechanism that depended on the PPCU constituents. The enzymatic degradation rate of PLA was obvious improved with gradually increasing PPCU content. Moreover, the study in this work provided a method for toughening modification of PLA and expanding its application.Conflicts of interest
This manuscript are no conflicts to other articles.Acknowledgements
This work was supported by the fund of Science & Technology Bureau of Jilin Province of China (No. 20160307001GX), Science & Technology Bureau of Changchun City of China (No. 16SS03), Science & Technology Bureau of Jilin City of China (No. 20163206), and Chinese Science Academy (Changchun Branch) (No. 2017SYHZ0016).Notes and references
- J. H. Qiu, Y. W. Zhang, X. HMeng, H. Q. Zhang and J. D. Liu, Polym. Int., 2010, 59, 78–84 CrossRef CAS.
- W. C. Lai and J. P. Liao, Mater. Chem. Phys., 2013, 139, 161–168 CrossRef CAS.
- K. S. Anderson and M. A. Hillmyer, Polymer, 2004, 45, 8809–8823 CrossRef CAS.
- N. Bitinis, R. Verdejo, P. Cassagnau and M. A. Lopez-Manchado, Mater. Chem. Phys., 2011, 129, 823–831 CrossRef CAS.
- N. Bitinis, R. Verdejo, E. M. Maya, E. Espuche, P. Cassagnau and M. A. Lopez-Manchado, Compos. Sci. Technol., 2012, 72, 305–313 CrossRef CAS.
- M. Jonoobi, J. Harun, A. P. Mathew and K. Oksman, Compos. Sci. Technol., 2010, 70, 1742–1747 CrossRef CAS.
- Y. J. Chen, L. J. Han, Z. L. Li, J. J. Kong, D. D. Wu, Z. W. Cao and L. S. Dong, RSC Adv., 2017, 7, 712–719 RSC.
- Y. P. Hao, H. Y. Liang, J. J. Bian, S. S. Sun, H. L. Zhang and L. S. Dong, Polym. Int., 2014, 63, 660–666 CrossRef CAS.
- M. S. Z. M. Desa, A. Hassan, A. Arsad, R. Arjmandi and N. N. B. Mohammad, J. Appl. Polym. Sci., 2016, 133, 44344 Search PubMed.
- N. A. Rosli, I. Ahmad, F. H. Anuar and I. Abdullah, Polym. Test., 2016, 54, 196–202 CrossRef CAS.
- N. J. Wu, H. Zhang and G. L. Fu, ACS Sustainable Chem. Eng., 2017, 5, 78–84 CrossRef CAS.
- L. Mascia, R. Su, J. Clarke, Y. Lou and E. Mele, Eur. Polym. J., 2017, 87, 241–254 CrossRef CAS.
- A. Masek, K. Diakowska and M. Zaborski, J. Therm. Anal. Calorim., 2016, 125, 1467–1476 CrossRef CAS.
- P. Sukpuang, M. Opaprakasit, A. Petchsuk, P. Tangboriboonrat, P. Sojikul and P. Opaprakasit, J. Elastomers Plast., 2016, 48, 105–121 CrossRef CAS.
- J. J. Li, J. Li, D. Feng, J. F. Zhao, J. R. Sun and D. G. Li, RSC Adv., 2017, 7, 28889–28897 RSC.
- Z. Cao, Y. Lu, C. Zhang, Q. Zhang, A. Zhou, Y. C. Hu, D. Wu, G. L. Tao, F. H. Gong, W. Z Ma and C. L. Liu, J. Appl. Polym. Sci., 2017, 134, 44895 Search PubMed.
- T. M. Dias Fernandes, M. C. Amorim Moreira Leite, A. M. Furtado de Sousa, C. R. Guimaraes Furtado, V. A. Escocio and A. L. Nazareth da Silva, Polym. Bull., 2017, 74, 1713–1726 CrossRef.
- H. W. Pan, D. D. Ju, Y. Zhao, Z. Wang, H. L. Yang, H. L. Zhang and L. S. Dong, Fibers Polym., 2016, 17, 1540–1549 CrossRef CAS.
- J. B. Zeng, Y. D. Li, Q. Y. Zhu, K. K. Yang, X. L. Wang and Y. Z. Wang, Polymer, 2009, 50, 1178–1186 CrossRef CAS.
- V. Jaso, M. Cvetinov, S. Rakic and Z. S. Petrovic, J. Appl. Polym. Sci., 2014, 131, 41104 CrossRef.
- L. D. Feng, X. C. Bian, Y. Cui, Z. M. Chen, G. Li and X. S. Chen, Macromol. Chem. Phys., 2013, 214, 824–834 CrossRef CAS.
- E. Oliaei, B. Kaffashi and S. Davoodi, J. Appl. Polym. Sci., 2016, 133, 43104 CrossRef.
- L. Y. Zhou, G. Y. Zhao and W. Jiang, Ind. Eng. Chem. Res., 2016, 55, 5565–5573 CrossRef CAS.
- W. Zou, R. Y. Chen, G. Z. Zhang, H. C. Zhang and J. P. Qu, Polym. Adv. Technol., 2016, 27, 1430–1437 CrossRef CAS.
- K. Pongtanayut, C. Thongpin and O. Santawitee, Energy Procedia, 2013, 34, 888–897 CrossRef CAS.
- T. Kanzawa and K. Tokumitsu, J. Appl. Polym. Sci., 2011, 121, 2908–2918 CrossRef CAS.
- H. Y. Liang, Y. P. Hao, J. J. Bian, H. L. Zhan, L. S. Dong and H. X. Zhang, Polym. Eng. Sci., 2015, 55, 386–396 CAS.
- H. L. Zhang, H. Y. Liang, J. J. Bian, Y. P. Hao, L. J. Han, X. M. Wang, G. B. Zhang, S. R. Liu and L. S. Dong, Polym. Int., 2014, 63, 1076–1084 CrossRef CAS.
- L. Wang, W. M. Gramlich and D. J. Gardner, Polymer, 2017, 114, 242–248 CrossRef CAS.
- H. L. Zhang, N. A. Liu, X. H. Ran, C. Y. Han, L. J. Han, Y. G. Zhuang and L. S. Dong, J. Appl. Polym. Sci., 2012, 125, E550–E561 CrossRef CAS.
- W. Li, Y. Zhang, D. D. Wu, Z. L. Li, H. L. Zhang, L. S. Dong, S. L. Sun, Y. J. Deng and H. X. Zhang, Adv. Polym. Technol., 2015 DOI:10.1002/adv.21632.
- S. L. Sun, M. Y. Zhang, H. X. Zhang and X. M. Zhang, J. Appl. Polym. Sci., 2011, 122, 2992–2999 CrossRef CAS.
- X. F. Ma, J. G. Yu and N. Wang, J. Polym. Sci., Part B: Polym. Phys., 2006, 44, 94–101 CrossRef CAS.
- Y. Y. Chen, Z. X. Liu, S. Han, J. Han and D. Y. Jiang, J. Appl. Polym. Sci., 2016, 133, 43667 Search PubMed.
- S. J. Wang, Y. H. Huang, B. Liao, G. Lin, G. M. Cong and L. B. Chen, Int. J. Polym. Anal. Charact., 1997, 3, 131–143 CrossRef CAS.
- C. B. Bucknall and D. R. Paul, Polymer, 2013, 54, 320–329 CrossRef CAS.
- E. W. Fischer, H. J. Sterzel and G. Wegner, Colloid Polym. Sci., 1973, 251, 980–990 CAS.
- M. Avrami, J. Chem. Phys., 1939, 7, 1103–1112 CrossRef CAS.
- M. Avrami, J. Chem. Phys., 1940, 8, 212–224 CrossRef CAS.
- B. Wunderlich, Macromolecular Physics, Academic, New York, 1976, vol. 2 Search PubMed.
- J. Yu and J. He, Polymer, 2000, 41, 891–898 CrossRef CAS.
- H. Marubayashi, S. Asai and M. Sumita, Macromolecules, 2012, 45, 1384–1397 CrossRef CAS.
- J. H. Wu, X. X. Zou, B. Jing and W. L. Dai, Polym. Eng. Sci., 2015, 55, 1104–1112 CAS.
- Y. Zhao, Y. Zhang, Z. L. Li, H. W. Pan, Q. L. Dong, L. J. Han, H. L. Zhang and L. S. Dong, Korean J. Chem. Eng., 2016, 33, 1104–1114 CrossRef CAS.
| This journal is © The Royal Society of Chemistry 2017 |

