 Open Access Article
Creative Commons Attribution 3.0 Unported Licence
TiO2 nanoparticle/nanofiber–ZnO photoanode for the enhancement of the efficiency of dye-sensitized solar cells
Man Yang,
Binghai Dong *,
Xiaojie Yang,
Wankun Xiang,
Ziqing Ye,
Erjing Wang,
Li Wan,
Li Zhao and
Shimin Wang*
Hubei Collaborative Innovation Center for Advanced Organic Chemical Materials, Key Laboratory for the Green Preparation and Application of Functional Materials, Ministry of Education, Hubei Key Laboratory of Polymer Materials, Faculty of Materials Science and Engineering, Hubei University, Wuhan 430062, P. R. China. E-mail: wwwdbh@163.com; shiminwang@126.com
First published on 29th August 2017
Abstract
The overall objective of this research was the preparation of optical nanocomposite photoanodes through a simple method. The synthesized nanocomposite photoanodes were then used to improve the power conversion efficiency of dye-sensitized solar cells (DSSCs). Titanium dioxide (TiO2) nanofibers (NF) were prepared via electrospinning and calcination. Then, thin films were prepared with commercial TiO2 (NP) as a binder. Different concentrations of zinc oxide (ZnO) nanoparticles were used to impregnate TiO2 NP/NF. When the prepared nanostructures were used as photoanodes, the DSSCs based on NP/NF–ZnO film with an optimum concentration of ZnO (3.5 M) exhibited the highest short circuit current density (Jsc) of 12.83 mA cm−2 and open circuit voltage (Voc) of 0.764 V. The NP/NF–ZnO photoanode also exhibited a maximum power conversion efficiency (PCE) of 6.54%, which was higher by 26.5% than that of NP/NF (5.17%) with the same electrolyte.
Introduction
O'Regan and Grätzel first fabricated TiO2-based dye-sensitized solar cells (DSSCs) in 1991.1 Over the past two decades, DSSCs have been considered to be third-generation photovoltaic devices due to their low cost, easy manufacture, and relatively high solar energy conversion efficiency.2–4 The fabrication of DSSCs with power conversion efficiency (PCE) of over 14% has attracted considerable interest from numerous research communities.5 A typical DSSC consists of a photoanode based on TiO2 nanoparticles (NPs), a dye acting as a light absorber, a liquid electrolyte (I−/I3−), and a counter electrode.6 The photoanode has a crucial role in DSSCs. Give the low band gap (Eg), high surface area for dye absorption, and facile fabrication, TiO2 NPs are widely used as effective photoanodes in conventional DSSCs. However, the weak light-scattering ability of TiO2 NPs restricts light harvesting by dye molecules, and the multiple capture events at the grain boundaries of TiO2 NPs inhibit electron transport and increase the recombination of electrons with redox species in the electrolyte. Research groups have attempted to vary the morphology and structure of TiO2 to overcome these drawbacks.One-dimensional (1D) nanostructures such as nanowire,7 nanofibers,8 nanorods,9 nanobelts,10 nanotubes,11 and nanosheets,12 have been utilized as photoanodes. 1D nanostructures provide a direct pathway for electron diffusion, thus, promoting electron transport, reducing charge recombination, and increasing charge collection efficiency, these beneficial effects collectively improve PCE.13 TiO2 nanofiber membranes are nanostructures with great potential as a DSSC photoanode. Recently, TiO2 nanofibers for DSSCs have been successfully fabricated via electrospinning, which allows for the control of nanofibers diameter and nanofiber membrane thickness.14
Nevertheless, 1D-nanostructures exhibit insufficient internal surface area compared with zero dimensional nanoparticles, this characteristic limits the amount of dye to that could be loaded on 1D nanostructures.15 Several groups have reported the enhanced efficiency of DSSCs based on two or more other nanostructures, such as nanowires-based composite electrodes,16 nanorods–nanoparticle composite electrodes,17 nanofibers–nanoparticle composite electrodes,18 and nanowire–nanoparticle composite electrodes.19 DSSCs based on these composite materials exhibit improved photovoltaic performance and high PCE.
Another approach to address insufficient internal surface area and low dye loading is the use of other photoanode materials, such as ZnO, SnO2, Nb2O5, and Al2O3, these materials are semiconductors with wide band-gaps.20–23 ZnO is one of the first oxide semiconductor alternatives applied in DSSCs.24,25 It has a wide band gap of 3.37 eV, which is similar to that of TiO2 (3.2 eV), and a high exciton binding energy of 60 meV.26 The high electron mobility properties of ZnO surpass those of TiO2,27,28 and its high electron transport rate decreases recombination. However, the IPCE and efficiency of ZnO-based solar cells is still far lower than those of TiO2 because ZnO is chemically unstable, and easily forms insulating complexes (Zn2+/dye agglomerates) upon contacting dye-loading solutions.29,30 Therefore, electron injection from the dye molecules to the semiconductor may be hindered.31 The successful route to overcome this issue is to combine two different materials, such as ZnO/TiO2 core–shell nanostructures,32 and heterogeneous ZnO/TiO2 architectures.33 The conversion efficiencies of combined ZnO materials are better than those of bare ZnO nanostructures.
The introduction of ZnO NPs into TiO2 thin films is beneficial for rapid electron transport. For example, Memarian et al.34 used a hollow ZnO structure as DSSCs photoanodes and showed much better PCE performance as high as 7.5%. Yana Yang et al.35 fabricated a DSSC with a photoanode based on ZnO nanowires in mesoporous TiO2. The DSSC obtained a PCE of 7.13%. They found that the short circuit current (Jsc) of the DSSC was enhanced, whereas, the open-circuit voltage (Voc) did not improve due to the absence of electron transfer in the open circuit.
Previous researches from different groups have shown that, the PCE of DSSC benefits from the application of different structures. In the present study, we used an electrospinning technique to fabricate TiO2 nanofibers (NF) and a simple impregnation technique to prepare TiO2–ZnO composites. We found that using the TiO2–ZnO nanocomposites as photoanodes can significantly enhance the photovoltaic performance of DSSCs because of a high dye loading amount and improved light scattering. DSSCs that utilize the composites (NP/NF–ZnO film with an optimum concentration of 3.5 M) as photoanodes exhibited a greatly enhanced PCE of 6.54%, which was higher by 26.5% than that of DSSCs with NP/NF photoanode (5.17%), and by 69% than that of DSSCs with NP photoanodes (3.87%) with the same electrolyte.
Experimental section
Materials and chemicals
Polyvinyl pyrrolidone (PVP, Mw = 1![[thin space (1/6-em)]](https://www.rsc.org/images/entities/char_2009.gif) 300
300![[thin space (1/6-em)]](https://www.rsc.org/images/entities/char_2009.gif) 000), and titanium(IV) isopropoxide (TIP) were purchased from Sigma-Aldrich, Ltd. Acetone, isopropanol, ethanol, and acetic acid were purchased from Sinopharm Chemical Reagent Co., Ltd. Di-tetrabutylammonium cis-bis(isothiocyanato)bis(2,2′-bipyridyl-4,4′-dicarboxylato)ruthenium(II) (N719) dye was purchased from Solaronix. Commercial titanium dioxide (TiO2 20 nm) was purchased from Wuhan lattice Solar Energy Technology Co., Ltd. All chemicals were used as received without further purification. Fluorine-doped tin oxide (FTO) conductive glass (1.5 cm × 2.0 cm, 14 Ω cm−1) was purchased from Nippon Sheet Glass, Japan. The FTO was successively cleaned in acetone, isopropanol, ethanol, deionized water in an ultrasonic cleaner for approximately 30 min.
000), and titanium(IV) isopropoxide (TIP) were purchased from Sigma-Aldrich, Ltd. Acetone, isopropanol, ethanol, and acetic acid were purchased from Sinopharm Chemical Reagent Co., Ltd. Di-tetrabutylammonium cis-bis(isothiocyanato)bis(2,2′-bipyridyl-4,4′-dicarboxylato)ruthenium(II) (N719) dye was purchased from Solaronix. Commercial titanium dioxide (TiO2 20 nm) was purchased from Wuhan lattice Solar Energy Technology Co., Ltd. All chemicals were used as received without further purification. Fluorine-doped tin oxide (FTO) conductive glass (1.5 cm × 2.0 cm, 14 Ω cm−1) was purchased from Nippon Sheet Glass, Japan. The FTO was successively cleaned in acetone, isopropanol, ethanol, deionized water in an ultrasonic cleaner for approximately 30 min.
Preparation of TiO2 nanofibers
TiO2 nanofibers were produced by electrospinning and calcination. In our work, the precursor solution consisted of 35 mL ethanol and 10 mL acetic acid. Then, 5 g TIP was added to the precursor solution under magnetic stirring for half an hour. Afterward, 2 g PVP (Mw = 1![[thin space (1/6-em)]](https://www.rsc.org/images/entities/char_2009.gif) 300
300![[thin space (1/6-em)]](https://www.rsc.org/images/entities/char_2009.gif) 000) was slowly dissolved in the solution under electromagnetic stirring for 2 h at 70 °C in a water bath. The solution was then electrospun under an applied voltage of 10 kV at a flow rate of 2.5 mL min−1. The distance between the needle tip and collector (aluminium foil) was 10 cm. Finally, the resulting nanofibers were annealed at 500 °C for 30 min at a heating rate of 1 °C min−1. The thicknesses of the nanofibers were controlled by varying the duration of electrospinning.
000) was slowly dissolved in the solution under electromagnetic stirring for 2 h at 70 °C in a water bath. The solution was then electrospun under an applied voltage of 10 kV at a flow rate of 2.5 mL min−1. The distance between the needle tip and collector (aluminium foil) was 10 cm. Finally, the resulting nanofibers were annealed at 500 °C for 30 min at a heating rate of 1 °C min−1. The thicknesses of the nanofibers were controlled by varying the duration of electrospinning.
Synthesis of the nanocomposite photoanode
First, the TiO2 nanofiber films were stripped from the Al foil, and then cut into uniform sizes of 4 mm × 4 mm after calcination. The strips were then pasted onto FTO glass using commercial TiO2 slurry. TiO2 nanoparticle/TiO2 nanofiber films (NP/NF) were heated at 125 °C for 10 min on a hotplate and calcined at 500 °C for 30 min in air. Second, 2.0 M, 2.5 M, 3.0 M, 3.5 M, and 4.0 M Zn(NO3)2 aqueous solutions were prepared. Subsequently, the whole samples were immersed in the Zn(NO3)2 solutions at 70 °C for 30 min. Afterward, the samples were flushed with deionized water and oven-dried. Finally, the samples were calcined at 500 °C for 30 min in air.Fabrication of DSSC
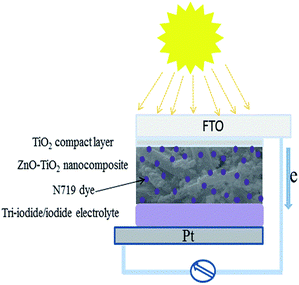
All the samples prepared above were immersed in 0.5 mM N719 dye solution with ethanol as the solvent. The samples were maintained in the solutions for 24 h to complete sensitization. The photoanodes were washed with ethanol to remove excess dye molecules. Then, the dye-sensitized photoanodes and a Pt counter electrode were assembled into a sandwich-type cell. Then, a syringe was used to inject the electrolyte solution (consisting of 0.1 M of LiI, 0.05 M of I2, 0.5 M of 4-tert-butylpyridine, and 0.6 M of tetrabutylammonium iodide in acetonitrile) into the internal space of the cell. The effective area was fixed at 0.16 cm2. The simple scheme for DSSC fabrication is presented in Fig. 1.Characterization
The NP/NF films and the crystalline structures of the devices were characterized via X-ray diffraction (XRD, Bruker-AXS D8 Advance). The elemental states of the sample were analyzed via X-ray photoelectron spectroscopy (XPS, ESCALAB 250Xi). The morphology of the devices were investigated by field-emission scanning electron microscopy (FE-SEM, JEOL JEM 6510LV) coupled with an energy dispersive X-ray (EDX) detector and transmission electron microscope (TEM, JEM2100, Japan). Diffuse reflectance spectra and transmission spectra were obtained by using an UV-vis spectrophotometer (UV-3600, Shimadzu). Dye loading was quantified based on desorption of dye molecules in 0.1 M NaOH ethanol–water (1![[thin space (1/6-em)]](https://www.rsc.org/images/entities/char_2009.gif) :
:![[thin space (1/6-em)]](https://www.rsc.org/images/entities/char_2009.gif) 1) solution as measured by an UV-vis spectrophotometer. The current–voltage (J–V) characteristics of the devices were measured in the dark and under simulated AM 1.5G (100 mW cm−2 irradiance), using a solar simulator (Oriel, model 91192-1000) and a source meter (Keithley 2400, USA), respectively. Electrochemical impedance spectroscopy (EIS) was performed using an electrochemical workstation (Zennium, IM6, Germany) over the frequency range of 10 mHz to 0.1 MHz under simulated AM 1.5G (mW cm−2 irradiance).
1) solution as measured by an UV-vis spectrophotometer. The current–voltage (J–V) characteristics of the devices were measured in the dark and under simulated AM 1.5G (100 mW cm−2 irradiance), using a solar simulator (Oriel, model 91192-1000) and a source meter (Keithley 2400, USA), respectively. Electrochemical impedance spectroscopy (EIS) was performed using an electrochemical workstation (Zennium, IM6, Germany) over the frequency range of 10 mHz to 0.1 MHz under simulated AM 1.5G (mW cm−2 irradiance).
Results and discussion
FE-SEM analysis of the samples
Fig. 2(A) and (C) show the cross-sectional FE-SEM images of NP/NF and NP/NF–ZnO (immersed in 3.5 M Zn(NO3)2 solution), Fig. 2(B) and (D) are the corresponding amplification SEM images. Comparing the SEM images of the bare TiO2 confirmed that the ZnO impregnated TiO2 (Fig. 2(A) and (C)). Fig. 2(A) showed that the TiO2 NP/NF formed a compact structure with a thickness of approximately 12.8 μm thick. TiO2 particles infiltrated the gaps between fibers and formed a dense film. Fig. 2(C) showed that the thickness of the NP/NF–ZnO was approximately 10.1 μm. In addition, the film became thinner, and formed some obvious gaps, which is good for dye absorbance. The reason for this formation is that the density of the film decreased after immersion in zinc nitrate solution, and the ZnO nanoparticles are attached to the TiO2 NF.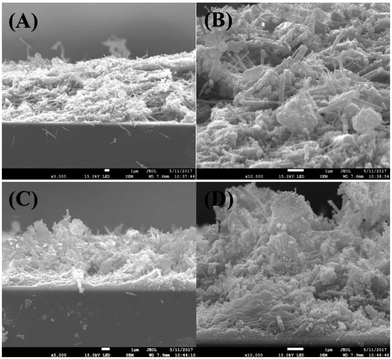 | ||
| Fig. 2 (A), (C) The cross-sectional SEM images of NP/NF and NP/NF–ZnO; (B), (D) the corresponding local amplification SEM images. | ||
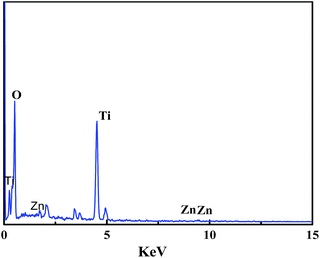
Chemical composition cannot be extrapolated from FE-SEM images. Thus, the elemental compositions of the samples were investigated via FE-SEM-EDX. The results of EDX analysis are shown in Fig. 3 and confirmed the presence of Zn over the surface of TiO2. The results also showed the existence of the characteristic peaks of Zn and TiO2. The presence of Ti was confirmed based on the peaks present at 0.5 keV, 4.5 keV and 4.9 keV, whereas the peaks at 9.6 keV, 8.6 keV and 1.0 keV were associated with Zn.
TEM analysis of the samples
To elucidate the structure of NP/NF–ZnO, TEM measurements were taken and are shown in Fig. 4. As shown in Fig. 4(A), the optical fiber has a diameter of 245.7 nm and a length of several micrometers. As in the FE-SEM analysis, not all of the values of the fibers were obtained. Fig. 4(B) and (C) shows HR-TEM images of the same fiber in the prepared material. The regular atomic formation of the atomic planes confirmed the crystalline structure of the prepared samples. The clear lattice fringes with a d-spacing of 2.57 Å corresponded to the (002) planes of the hexagonal wurtzite ZnO. The edge of the anatase TiO2 molecule had a crystalline spacing of 3.4 Å assigned to the (101) plane. The result confirmed the growth of high-quality TiO2 nanoparticles, as shown in Fig. 5 by XRD analysis.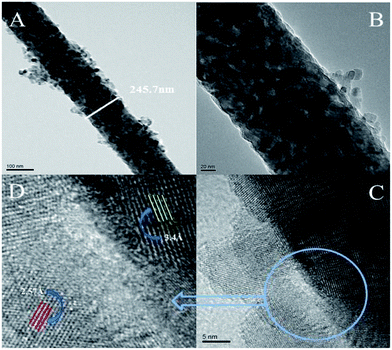 | ||
| Fig. 4 (A) TEM image of the surface morphology of the NP/NF–ZnO nanocomposite and (B–D) HRTEM images with different morphologies of the sample. | ||
XRD analysis of the samples
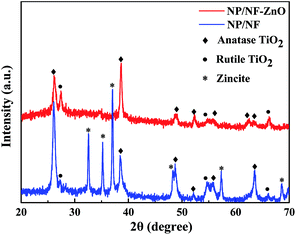
The results of the XRD analysis of the NP/NF and NP/NF–ZnO composites are provided in Fig. 5. The diffraction peaks of the two samples were identified as anatase TiO2 [JCPDS card no. 21-1272] based on the diffraction peaks obtained at 26.1°, 38.7°, 48.8°, 52.3°, 55.8°, and 63.3°, and as rutile TiO2 [JCPDS card no. 21-1276] based on the peaks at 27.4°, 54.7°, 66.3°. The diffraction peaks appeared at 32.5°, 35.2°, 37.1°, 48.3°, 57.3°, and 68.6° corresponded to the (100), (002), (101), (102), (110), and (112) planes, respectively, of hexagonal wurtzite ZnO [JCPDS card no. 36-1451]. Based on XRD analysis, the composite samples were mainly composed of anatase TiO2 and zincite ZnO.X-ray photoemission spectroscopy analysis of the samples
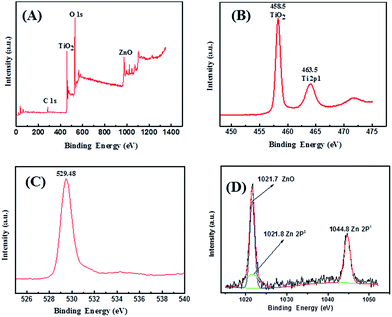
X-ray photoemission spectroscopy (XPS) was performed to further investigate the composition of NP/NF–ZnO. The results are shown in Fig. 6. Fig. 6(A) shows Ti 2p, O 1s and Zn 2p peaks exist in the full XPS spectra of the NP/NF–ZnO nanocomposite. As shown in Fig. 6(B), two peaks exist in the Ti 2p region, a peak with the binding energy of 458.28 eV attributable to the Ti 2p3/2, and a second peak at 464.18 eV that corresponded to Ti 2p1/2. In addition, the splitting between Ti 2p1/2 and Ti 2p3/2 was 5.90 eV, indicating a normal state of Ti(IV) in the as-synthesized NP/NF–ZnO nanocomposite. As shown in Fig. 6(C), the O 1s peak from the composite materials is located at about 529.48 eV and is attributable to the composite materials. As shown in Fig. 6(D), the binding energy of ZnO is located at 1021.7 eV and an additional two peaks with the binding energy of 1021.8 eV and 1044.8 eV correspond to Zn 2p3 and Zn 2p1, respectively.Photovoltaic efficiency of the fabricated DSSCs
We first investigated some optical properties of the DSSC films with different ZnO contents (zinc salt concentration). Fig. 7 depicts the J–V characteristics of the DSSCs based on NP/NF immersed in 2.0 M, 2.5 M, 3.0 M, 3.5 M, or 4.0 M of Zn(NO3)2 solutions. The photovoltaic parameters, like Jsc, Voc, fill factor (FF), and PCE are listed in Table 1. The results indicated that the Jsc, Voc, FF and PCE of DSSCs are dependent on the ZnO content of the photoanodes. Experimental results showed that Jsc increased in the order of 3.5 M (12.83 mA cm−2) > 3.0 M (10.74 mA cm−2) > 2.5 M (9.91 mA cm−2) > 2.0 M (9.65 mA cm−2) > 4.0 M (4.51 mA cm−2). The increase in photocurrent can be attributed to rapid electron transport and the shortened electron-transfer distance that both resulted from ZnO contents. Moreover, the Voc improved with the addition of ZnO owing to the suppression of electron recombination, consequently improving the conversion efficiency. However, when a higher ZnO concentration was introduced, Jsc decreased because higher ZnO concentrations formation of the Zn2+/dye complexes,31 which hinder dye absorption, electron transport, and electrolyte penetration. Consequently, the DSSCs that used NP/NF–ZnO photoanodes prepare with 3.5 M exhibited the highest PCE of 6.54%.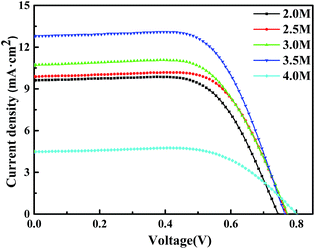 | ||
| Fig. 7 J–V curves of the fabricated DSSCs based on NP/NFs in 2.0 M, 2.5 M, 3.0 M, 3.5 M, and 4.0 M, Zn(NO3)2 solutions. | ||
| Concentration | Jsc (mA cm−2) | Voc (V) | FF (%) | PCE (%) | Dye loading (10−7 mol cm−2) |
|---|---|---|---|---|---|
| 2.0 M | 9.65 | 0.744 | 66.44 | 4.77 | 1.84 |
| 2.5 M | 9.91 | 0.774 | 68.05 | 5.22 | 2.31 |
| 3.0 M | 10.74 | 0.774 | 65.2 | 5.42 | 2.39 |
| 3.5 M | 12.83 | 0.765 | 66.69 | 6.45 | 2.79 |
| 4.0 M | 4.51 | 0.795 | 66.94 | 2.4 | 1.46 |
The UV-vis spectra of dye adsorption on different composite films are shown in Fig. 8. The amounts of N719 loaded on the photoanodes are provided in Table 1, which illustrates that the absorbance of photoanode films first increases with the ZnO content of composite films and then decreased. The maximum absorption value was 3.5 M and the amount of dye adsorbed was 2.79 × 10⁻⁷ mol cm−2. This result is consistent with the results of the above analysis and further confirmed that a high electron injection efficiency and light capture efficiency improve Jsc.
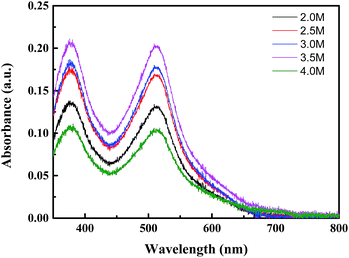 | ||
Fig. 8 UV-vis spectra of desorbed dye (N719) in 5 mL of NaOH (ethanol![[thin space (1/6-em)]](https://www.rsc.org/images/entities/char_2009.gif) : :![[thin space (1/6-em)]](https://www.rsc.org/images/entities/char_2009.gif) deionized water = 1 deionized water = 1![[thin space (1/6-em)]](https://www.rsc.org/images/entities/char_2009.gif) : :![[thin space (1/6-em)]](https://www.rsc.org/images/entities/char_2009.gif) 1) on NP/NF immersed in 2.0 M, 2.5 M, 3.0 M, 3.5 M, or 4.0 M Zn(NO3)2 solutions. 1) on NP/NF immersed in 2.0 M, 2.5 M, 3.0 M, 3.5 M, or 4.0 M Zn(NO3)2 solutions. | ||
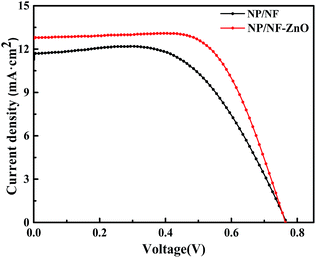
Based on the above conclusions, we compared the structure of the NP/NF–ZnO immersed in 3.5 M Zn(NO3)2 with that of NP/NF. We also compared the optical properties of NP/NF and NP/NF–ZnO. These photoanodes have different structures. The photocurrent–photovoltage characteristics of the DSSCs based on the two photoanodes are shown in Fig. 9, and the corresponding photovoltaic performance parameters of the photoanodes are summarized in Table 2. The UV-vis spectra of dye adsorption by the different composite films are shown in Fig. 10.
| Sample | Jsc (mA cm−2) | Voc (V) | FF (%) | PCE (%) | Dye loading (10−7 mol cm−2) | Rs (Ohm) | Rct1 (Ohm) | Rct2 (Ohm) |
|---|---|---|---|---|---|---|---|---|
| NP/NF | 11.66 | 0.764 | 58.03 | 5.17 | 2.13 | 16.57 | 22.17 | 101.2 |
| NP/NF–ZnO | 12.83 | 0.764 | 66.72 | 6.54 | 2.79 | 17.57 | 18.55 | 57.21 |
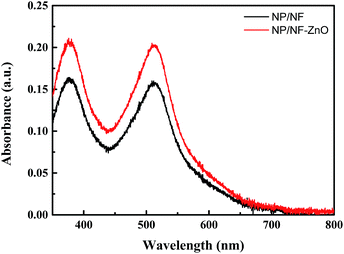 | ||
Fig. 10 UV-vis spectra of dye (N719) in 5 mL of NaOH (ethanol![[thin space (1/6-em)]](https://www.rsc.org/images/entities/char_2009.gif) : :![[thin space (1/6-em)]](https://www.rsc.org/images/entities/char_2009.gif) deionized water = 1 deionized water = 1![[thin space (1/6-em)]](https://www.rsc.org/images/entities/char_2009.gif) : :![[thin space (1/6-em)]](https://www.rsc.org/images/entities/char_2009.gif) 1) desorbed by NP/NF and NP/NF–ZnO. 1) desorbed by NP/NF and NP/NF–ZnO. | ||
The DSSCs with the NP/NF photoanode film had a Jsc of 11.66 mA cm−2, Voc of 0.764 V, and PCE of 5.17%. Compared with it, the DSSCs with the NP/NF–ZnO photoanode exhibited the highest Jsc of 12.83 mA cm−2 and Voc of 0.764 V. The NP/NF–ZnO photoanode also exhibited the maximum PCE of 6.54%, which was higher by 26.5% than that of NP/NF (5.17%) the same electrolyte. The significant enhancements in the PCE of the NP/NF–ZnO-based DSSC compared with that of the NP/NF-based DSSCs are mainly attributed to the remarkable enhancement in light scattering and the marked increase in Jsc.
The calculated amounts of dye adsorption on the membranes are listed in Table 2. The dye-loading amount of the NP/NF–ZnO (2.79 × 10⁻⁷ mol cm−2) photoanode was higher than that of NP/NF (2.13 × 10⁻⁷ mol cm−2) photoanodes. Based on the J–V curves shown in Fig. 10, the NP/NF–ZnO cell with higher dye loading amount possesses a higher Jsc.
To further understand the properties of electron transport and recombination in DSSCs, electrochemical impedance spectroscopy (EIS) measurements were taken at an applied bias of Voc and a frequency between 0.1 Hz and 100 kHz under one-sun illumination. The Nyquist plots of the EIS results are shown in Fig. 11(A). An equivalent circuit diagram, which defines the junction impedance in the tested system, is provided in Fig. 11(B). The EIS generally comprises three parts in the electrochemical system of DSSCs. Semicircles in the high-frequency range are assigned to the redox reaction at the platinum counter electrode/electrolyte interface at high frequencies (Rct1), whereas those in the middle frequency range represent electron transfer at the photoanode/dye/electrolyte interface (Rct2) and the Warburg diffusion process of I−/I3− in the electrolyte at low frequencies (Rdiff).36 The resistances in the photoanode/dye/electrolyte interface represent the electron transfer impedance in the excited state of the dye/photoanode interface, which is also equivalent to the relative barrier height of electron injection from the excited dye into the conduction band.37 Therefore the lower the electron transfer impedance, the greater the electron injection power, which can effectively increase Jsc.
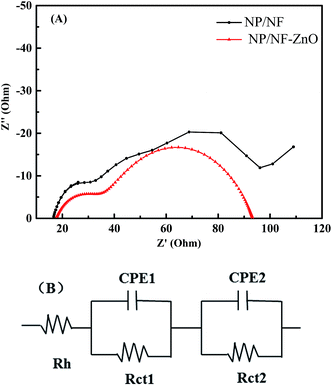 | ||
| Fig. 11 (A) Nyquist plots EIS spectra for DSSCs based on NP/NF and NP/NF–ZnO. (B) The lowest part of the scheme displays the corresponding equivalent circuit. | ||
As shown in Fig. 11(A), the Nyquist plots are composed of two semicircles, which indicates charge-transfer resistance at the counter electrode/electrolyte (Rct1) interface and at the TiO2/electrolyte interface (Rct2, wider semicircle). The greater the radius of Rct2, the greater the charge recombination resistance, and vice versa. All DSSCs based on NP/NF–ZnO (57.21 Ω) have considerably lower Rct2 values than the NP/NF-based DSSC (101.2 Ω), indicating the low electrical resistance of the hybrid films. This result confirms that the NF scaffolds can provide a direct electron pathway, shorten the electron-transfer distance, and inhibit charge recombination in the hybrid films. This result also confirms that the incorporation of ZnO particles in photoanodes provides fast electron transport, a direct electron pathway, and short electron-transfer distance. Consequently, the combined effect of fast electron transport, longer electron life time, and lower recombination rate collectively improve the Jsc of the DSSC.
Conclusions
We used an electrospinning technique to prepare TiO2 NFs. We then performed a simple impregnation technique to compound ZnO with TiO2 NFs to form ZnO/TiO2 composites. DSSCs based on the ZnO/TiO2 nanocomposite exhibited enhanced the conversion efficiency. The NP/NF immersed in 3.5 M Zn(NO3)2 aqueous solution showed the best electrochemical performance. The Jsc of the NP/NF–ZnO-based DSSC was higher by 32.6% and 10.03% than those of the NP- and NP/NF-based DSSCs, respectively, and PCE was greatly enhanced to 6.54%. The NP/NF–ZnO enhances dye adsorption, light absorption and electron transmission, consequently increasing conversion efficiency.Conflicts of interest
There are no conflicts to declare.Acknowledgements
The work was supported by the key projects of Department of Hubei Provincial Science and Technology (2016AAA034), Natural Science Foundation of Hubei Province (2016CFB507). This work was also supported by the National Natural Science Foundation of China (51572072, 51603063 and 21402045).Notes and references
- B. O'Regan and M. Grätzel, Nature, 1991, 353, 737–740 CrossRef.
- A. Hagfeldt, G. Boschloo, L. Sun, L. Kloo and H. Pettersson, Chem. Rev., 2010, 110, 6595–6663 CrossRef CAS PubMed.
- X. Huang, P. Shen, B. Zhao, X. Feng, S. Jiang, H. Chen, H. Li and S. Tan, Sol. Energy Mater. Sol. Cells, 2010, 94, 1005–1010 CrossRef CAS.
- Z. Chai, M. Wu, M. Fang, S. Wan, T. Xu, R. Tang, Y. Xie, A. Mei, H. Han, Q. Li and Z. Li, Adv. Energy Mater., 2015, 5(1500846), 1–10 Search PubMed.
- K. Kakiage, Y. Aoyama, T. Yano, K. Oya, J. I. Fujisawa and M. Hanaya, Chem. Commun., 2015, 51, 15894–15897 RSC.
- M. A. Al-Alwani, A. B. Mohamad, N. A. Ludin, A. A. H. Kadhum and K. Sopian, Renewable Sustainable Energy Rev., 2016, 65, 183–213 CrossRef CAS.
- L. Li, C. Xu, Y. Zhao and K. J. Ziegler, Sol. Energy, 2016, 132, 214–220 CrossRef CAS.
- Y. Yang, H. Wang, Q. Zhou, M. Kong, H. Ye and G. Yang, Nanoscale, 2013, 5, 10267–10274 RSC.
- M. Iraj, F. D. Nayeri, E. Asl-Soleimani and K. Narimani, J. Alloys Compd., 2016, 659, 44–50 CrossRef CAS.
- Q. Chen, H. Liu, Y. Xin and X. Cheng, Electrochim. Acta, 2013, 111, 284–291 CrossRef CAS.
- K. Zhu, N. R. Neale, A. Miedaner and A. J. Frank, Nano Lett., 2007, 7, 69–74 CrossRef CAS PubMed.
- J. Yu, J. Fan and K. Lv, Nanoscale, 2010, 2(10), 2144–2149 RSC.
- F. Sauvage, F. Di Fonzo, A. Li Bassi, C. S. Casari, V. Russo, G. Divitini, C. Ducati, C. E. Bottani, P. Comte and M. Graetzel, Nano Lett., 2010, 10, 2562–2567 CrossRef CAS PubMed.
- Z. Dong, S. J. Kennedy and Y. Wu, J. Power Sources, 2011, 196, 4886–4904 CrossRef CAS.
- S. So, I. Hwang and P. Schmuki, Energy Environ. Sci., 2015, 8, 849–854 CAS.
- B. Liu and E. S. Aydil, J. Am. Chem. Soc., 2009, 131, 3985–3990 CrossRef CAS PubMed.
- X. Huang, P. Shen, X. Feng, Z. Tan, B. Zhao and S. Tan, Nano, 2012, 7(1250010), 1–9 Search PubMed.
- P. Joshi, L. Zhang, D. Davoux, Z. Zhu, D. Galipeau, H. Fong and Q. Qiao, Energy Environ. Sci., 2010, 3, 1507–1510 CAS.
- B. Tan and Y. Wu, J. Phys. Chem. B, 2006, 110, 15932–15938 CrossRef CAS PubMed.
- E. Guillén, E. Azaceta, L. M. Peter, A. Zukal, R. Tena-Zaera and J. A. Anta, Energy Environ. Sci., 2011, 4, 3400–3407 Search PubMed.
- S. Gubbala, V. Chakrapani, V. Kumar and M. K. Sunkara, Adv. Funct. Mater., 2008, 18, 2411–2418 CrossRef CAS.
- J. Xia, N. Masaki, K. Jiang and S. Yanagida, J. Phys. Chem. C, 2007, 111, 8092–8097 CAS.
- C. Prasittichai and J. T. Hupp, J. Phys. Chem. Lett., 2010, 1, 1611–1615 CrossRef CAS.
- M. Law, L. E. Greene, J. C. Johnson, R. Saykally and P. Yang, Nat. Mater., 2005, 4, 455–459 CrossRef CAS PubMed.
- Q. Zhang, C. S. Dandeneau, X. Zhou and G. Cao, Adv. Mater., 2009, 21, 4087–4108 CrossRef CAS.
- T. Kavitha, A. I. Gopalan, K. P. Lee and S. Y. Park, Carbon, 2012, 50, 2994–3000 CrossRef CAS.
- Ü. Özgür, Y. I. Alivov, C. Liu, A. Teke, M. A. Reshchikov, S. Doğan, V. Avrutin, S. J. Cho and H. Morkoç, J. Appl. Phys., 2005, 98(041301), 1–11 Search PubMed.
- H. Tang, K. Prasad, R. Sanjines, P. E. Schmid and F. Levy, J. Appl. Phys., 1994, 75, 2042–2047 CrossRef CAS.
- Q. Zhang, T. P. Chou, B. Russo, S. A. Jenekhe and G. Cao, Angew. Chem., 2008, 120, 2436–2440 CrossRef.
- A. Yella, H. W. Lee, H. N. Tsao, C. Yi, A. K. Chandiran, M. K. Nazeeruddin, E. W. Diau, C. Yeh, S. M. Zakeeruddin and M. Grätzel, Science, 2011, 334, 629–634 CrossRef CAS PubMed.
- M. Law, L. E. Greene, A. Radenovic, T. Kuykendall, J. Liphardt and P. Yang, J. Phys. Chem. B, 2006, 110, 22652–22663 CrossRef CAS PubMed.
- S. Hernández, V. Cauda, A. Chiodoni, S. Dallorto, A. Sacco, D. Hidalgo, E. Celasco and C. F. Pirri, ACS Appl. Mater. Interfaces, 2014, 6, 12153–12167 Search PubMed.
- N. Wang, C. Sun, Y. Zhao, S. Zhou, P. Chen and L. Jiang, J. Mater. Chem., 2008, 18, 3909–3911 RSC.
- N. Memarian, I. Concina, A. Braga, S. M. Rozati, A. Vomiero and G. Sberveglieri, Angew. Chem., 2011, 123, 12529–12533 CrossRef.
- Y. Yang, J. Zhao and C. Cui, et al., Electrochim. Acta, 2016, 196, 348–356 CrossRef CAS.
- J. Qian, P. Liu, Y. Xiao, Y. Jiang, Y. Cao, X. Ai and H. Yang, Adv. Mater., 2009, 21, 3663–3667 CrossRef CAS.
- Z. S. Wang, C. H. Huang, Y. Y. Huang, Y. J. Hou, P. H. Xie, B. W. Zhang and H. M. Cheng, Chem. Mater., 2001, 13, 678–682 CrossRef CAS.
| This journal is © The Royal Society of Chemistry 2017 |

