 Open Access Article
Simultaneous degradation of tetracycline by a microbial fuel cell and its toxicity evaluation by zebrafish†
Ji Wangab,
Ming-Fang Heb,
Dalu Zhangc,
Ziyu Rend,
Tian-shun Song*ab and
Jingjing Xie *abe
*abe
aState Key Laboratory of Materials-Oriented Chemical Engineering, Nanjing Tech University, Nanjing 211816, PR China. E-mail: xiej@njtech.edu.cn; tshsong@njtech.edu.cn
bCollege of Biotechnology and Pharmaceutical Engineering, Nanjing Tech University, 30 South Puzhu Road, Nanjing 211816, PR China. Tel: +86 25 58139939
cInternational Cooperation Division, China National Center for Biotechnology Development, Beijing, PR China
dNanjing Foreign Language School, Nanjing, PR China
eJiangsu National Synergetic Innovation Center for Advanced Materials (SICAM), Nanjing 211816, PR China
First published on 14th September 2017
Abstract
Tetracycline (TC) is the second most commonly used antibiotic despite its high toxicity and persistence. In this study, a new approach for the anaerobic biodegradation of TC in a microbial fuel cell (MFC), with glucose–TC mixtures as the substrate, under gradient acclimation conditions was explored. Within 7 days, approximately 79.1% of TC was degraded by the MFC. This value was higher than that obtained through a traditional anaerobic method (14.9%). The TC degradation rates in MFCs with a closed circuit were 31.6% higher than those in MFCs with an open circuit. Furthermore, zebrafish assessment showed that no toxicity was observed after MFC treatment. Microbial community analysis was performed on the anode of the MFCs under gradient acclimation conditions, and the results showed that TC was effectively degraded by the synergy of fermentative bacteria, acid-producing bacteria and electrogenic bacteria. This work confirmed that the anaerobic biodegradation of TC by MFCs is a cost-effective and environmentally friendly method.
Introduction
Currently, the extensive use of pharmaceuticals is an environmental issue. Antibiotics are the most widely used in disease prevention and treatment.1 In addition, antibiotics can also be used as feed additives to promote the growth rate of livestock and poultry animals.2,3 As the largest producer and user of antibiotics in the world, China produces up to 210![[thin space (1/6-em)]](https://www.rsc.org/images/entities/char_2009.gif) 000 t of antibiotics annually, half of which are consumed by animals.4 Antibiotics are weakly absorbed and incompletely metabolized in the body of humans and animals, therefore approximately 40–90 percent of antibiotics consumed by humans or animals is excreted via urine and feces in the parent form or as metabolites.5 Furthermore, large amounts of antibiotics or their metabolites are released into the aquatic environment by leakage and wastewater discharge.6,7 Long-term exposure to antibiotic-contaminated environment not only increases the risk of harm to humans and animals, but also affects chlorophyll synthesis, enzyme secretion and root growth in plants.8 Thus, treating antibiotic-contaminated effluents before they are discharged into the aquatic environment is necessary.
000 t of antibiotics annually, half of which are consumed by animals.4 Antibiotics are weakly absorbed and incompletely metabolized in the body of humans and animals, therefore approximately 40–90 percent of antibiotics consumed by humans or animals is excreted via urine and feces in the parent form or as metabolites.5 Furthermore, large amounts of antibiotics or their metabolites are released into the aquatic environment by leakage and wastewater discharge.6,7 Long-term exposure to antibiotic-contaminated environment not only increases the risk of harm to humans and animals, but also affects chlorophyll synthesis, enzyme secretion and root growth in plants.8 Thus, treating antibiotic-contaminated effluents before they are discharged into the aquatic environment is necessary.
Given its the low cost and high efficiency, tetracycline (TC) is the second most commonly used antibiotics in human activities and livestock breeding.9,10 Typically, domestic waste water contains relatively low TC (1 μg L−1),11 whereas hospital waste water has TC concentration of more than 100 μg L−1.12 Traditional methods, such as advanced oxidation process,13,14 active carbon adsorption15 and membrane separation16 are frequently used to remove TC from aqueous solutions. However, these techniques present some shortcomings such as high operation costs, low efficiency, and generation of toxic by-products. Biological treatment remains the most common and economical approach for the treatment of TC contaminants in wastewater.17,18 However, absence or deficiency of the terminal electron acceptors may result in decreased removal rate for TC.
Using microbial fuel cells (MFCs) offers an environmentally friendly and promising method for converting organic matter into electrical energy.19 MFCs adopt the electrode as a continuous long-term electron acceptor for anaerobic microorganism, which enhances the degradation of organic matter under anaerobic conditions.20,21 Therefore, MFC can degrade a wide range of organic substrates, ranging from easily degradable organics22,23 to bio-refractory organics.24,25 Recently, some articles focused on assessing the ability of MFC to improve TC removal.26,27 However, its degradation products might be more toxic than the parent compounds during the degradation of antibiotics.28 Therefore, toxicity after MFC treatment needs to be further investigated.
In this study, a dual-chamber MFC inoculated with anaerobic microorganism was constructed to investigate the removal of TC in MFCs and the microbial activity of MFC with TC as substrate was analyzed. The toxicity of the TC degradation products after MFC treatment was then evaluated by using zebrafish (Danio rerio). These results are expected to provide an environmentally friendly method for the biodegradation of TC by MFC.
Materials and methods
MFC construction and operation
The dual-chamber MFC reactor was made of plexiglas material (net volume of 250 mL each). The two chambers were separated by a proton exchange membrane (Nafion117, Dupont Co., USA). The anode and cathode were made of graphite felt (50 mm × 50 mm × 5 mm, length × width × thickness). The anolyte used glucose medium (pH 7.0) consisting of 0.31 g L−1 NH4Cl, 11.53 g L−1 Na2HPO4·12H2O, 2.77 g L−1 NaH2PO4·2H2O, 0.13 g L−1 KCl and 1 g L−1 glucose. The catholyte containing 13.2 g L−1 K3Fe(CN)6, 2.77 g L−1 NaH2PO4·2H2O, 0.13 g L−1 KCl, 11.53 g L−1 Na2HPO4·12H2O were added to the cathode chamber of MFC. The MFCs were operated at a fixed external resistor of 1000 Ω and maintained at 25 °C. All the experiments were carried out in duplicate under each experimental condition.During the startup stage, the anode chamber of the MFC was inoculated with 5 mL anaerobic activated sludge and 245 mL glucose culture medium. When the performance of the MFC stabilized, the substrate was replaced with glucose–TC mixtures containing glucose mixed with different concentrations of TC under a gradient acclimation as shown in Table 1. After the startup and gradient acclimation stage, the 50 mg L−1 TC without glucose was used as substrate, and the performance of the MFC with closed circuit (CC) and MFC with open circuit (OC) was studied, respectively. In addition, 5 mL anaerobic activated sludge with 245 mL anolyte containing 50 mg L−1 TC with non-gradient acclimation (NA) was also studied as control group.
| Acclimation stage | A | B | C | D | E | F | G |
| Glucose (mg L−1) | 1000 | 1000 | 1000 | 1000 | 1000 | 500 | 0 |
| Tetracycline (mg L−1) | 10 | 20 | 30 | 40 | 50 | 50 | 50 |
The CC had a fixed external resistor of 1000 Ω, whereas the OC groups had none. Moreover, the CC and OC groups had domestication cycle of five weeks, but NA group lacked five cycles and directly used activated sludge to degrade tetracycline.
Analyses
The concentrations of TC were measured using Agilent 1200 infinity series high-performance liquid chromatography (HPLC), with an Agilent Eclipse Plus C18 column (4.6 × 100 mm, 3.5 μm) at a flow rate of 1.0 mL min−1 and the column temperature was 25 °C. The mobile phase consisted of 0.03% oxalic acid solution (A), methanol solution (B) and acetonitrile solution (C). The flow phase gradient used to obtain the measurements is shown in Table 2. The voltages were collected every 10 min with a precision multimeter with a data acquisition system (Keithley 2700, USA). In order to get the polarization curves, the external resistance ranged from 5000 Ω to 100 Ω. When the voltage output reached a steady value, current density and power density were calculated according to the projected anodic surface area. Current (I) was calculated according to Ohm's law: U = IR, where U is the voltage and R is the external resistance. Power (P) was calculated according to P = IU.| Elution time/min | 0 | 2 | 2.1 | 6 |
| A/% | 8 | 18 | 20 | 8 |
| B/% | 0 | 0 | 5 | 0 |
| C/% | 92 | 82 | 75 | 92 |
Zebrafish maintenance and embryo collection
Wild-type zebrafish (Tubingen line) were obtained from the Model Animal Research Center of Nanjing University. According to Truong et al.,29 zebrafish should be kept at 28.5 °C, with a 14:10 h light-dark photoperiod. The embryo medium was composed of 0.2 g L−1 of Instant Ocean® salt in distilled water with 0.01% methylene blue.The authors declare that all procedures performed in studies involving live subjects were in accordance with the ethical standards of the institutional and national research committee and with the 1964 Helsinki declaration and its later amendments or comparable ethical standards. Authors also state that all the zebrafish studies performed were approved by the Institutional Animal Care and Use Committee (IAUC) of Nanjing Tech University.
Embryo toxicity experiments
The normal embryos were selected and placed in 48-well plates. Each well contained 10 embryos. The embryos were exposed to control, 50 mg L−1 TC, CC, OC or NA group at 28.5 °C. The control group contained anodic liquid without TC. The 50 mg L−1 TC group contained anodic liquid and 50 mg L−1 TC. For the accuracy of the experiment, each group was carried out in three replicates. At 72 hours post fertilization (hpf), the development of zebrafish embryos was monitored with a dissecting microscope (Nikon, SMZ745T). The measured data mainly included heart rate, hatching rate, survival rate, length of body and malformations. The heart rate was measured by counting the heart beating every 60 seconds under a dissecting microscope (Nikon, SMZ745T). The size of hydatoncus was measured with Photoshop CS5 (Adobe Systems, USA) for calculation of the pixels of the hydatoncus area. Dead zebrafish embryo was discarded every 12 h.Isolation and identification of bacterial strains
For the isolation and purification of the TC-degrading microorganisms, an agar medium consisting of 0.3 g L−1 beef extract, 1 g L−1 peptone, 1.5 g L−1 of sodium chloride and 2% (w/v) agar was prepared. The enriched sample was obtained from the biofilm on the anode surfaces in MFC under the 50 mg L−1 TC. The anode-associated biofilms were acquired by scraping the electrodes vigorously with a sterile razor blade. Then, 100 μL of liquid samples were streaked on the fresh agar medium with 50 mg L−1 TC. Single colonies were picked up and then transferred to the fresh agar medium. Bacterial genomic DNA was extracted, according to Jiang et al. reported.30 For bacterial 16S rRNA gene, PCR reaction was carried out and the primers were 27F and 1492R. The products were sequenced by GENEWIZ (Suzhou, China). Sequencing results were compared with data in the NCBI database (http://ncbi.nlm.nih.gov/BLAST) by BLAST.DNA extraction for 16S rDNA illumina sequencing, and microbial community structure analysis
The microbial community in the biofilm was analyzed by using bacterial 16S rDNA sequence analysis on an Illumina platform. Anodic biofilm samples were collected from MFC at the end of the experiment. Genomic DNA was extracted using the PowerSoil® DNA Isolation Kit (MO BIO Laboratories Inc., Carlsbad, CA, USA), according to the manufacturer's protocol. DNA quality was assessed, at the ratios of 260/280 nm, using a Nano Drop ND-2000 Spectrophotometer (NanoDrop Technologies Inc., Wilmington, USA), and a highly pure genomic DNA (A260/A280 ≈ 1.8) was used, only, for Illumina high-throughput sequencing by GENEWIZ (Suzhou, China). Richness and biodiversity indices were obtained via the Mothur software package. Similar sequences were clustered into operational taxonomic units (OTUs), on the basis of 3% dissimilarity. Based on these clusters, rarefaction curves, OTUs, Chao1 richness estimations, Shannon diversity indexes and Good's coverages were generated, in MOTHUR version 1.30.0, for each sample (http://www.mothur.org/wiki/Main Page), at a cutoff of 0.03, through the random selection of the minimum sequences of all our samples. The BLAST reports, of taxonomic classification, down to the phylum, class, order, family and genus levels were performed, using Mothur, based on the sequences from the Ribosomal Database Project (RDP), with a bootstrap cutoff of 50%. An OTU table was generated and a heatmap, showing relative abundances, was created by HemI 1.0 (http://hemi.biocuckoo.org/index.php).31Results and discussion
Voltage production
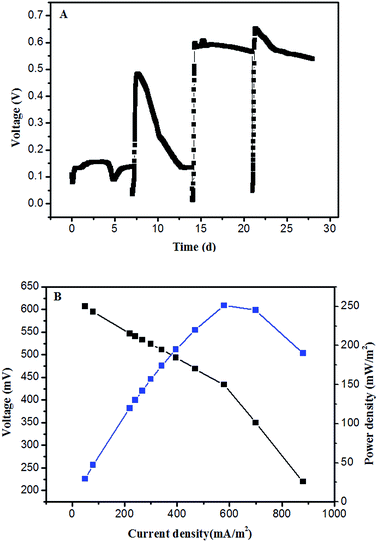
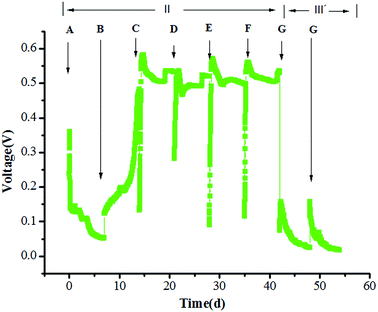
The experiment was divided into three stages. At stage I (start-up phase), the anode in the MFC was colonized using a glucose solution (1000 mg L−1). The MFC generated an initial circuit voltage of 150 mV when 1000 mg L−1 glucose was immediately introduced (Fig. 1a). When the voltage decreased below 50 mV, the substrate was replaced and a second cycle was initiated, the maximum voltage of 483 mV was obtained. In the third cycle, the maximum voltage was 606 mV, and the voltage reached a relatively stable level (600 mV) in the fourth cycle, the MFC generated the maximum power density of 251.14 mW m−2 at a current density of 578.7 mA m−2 (Fig. 1b). It indicated that the exoelectrogenic biofilm was formatted and the start-up of MFC had been completed.At stage II (gradient acclimation), glucose–TC mixtures were introduced into the MFC with TC concentration of 10–50 mg L−1 (Fig. 2). Voltages were obviously decreased when glucose–TC mixtures were added into the MFC at first. The initial voltage was 360 mV and continued to decline. The result implied that TC might reduce the electrochemical activity of bacteria on the anode in MFC. After 7 day acclimation, the substrate was changed to 1 g L−1 glucose with 20 mg L−1 TC. The voltage of MFC started to rise slowly and the maximum voltage was 482 mV on the 14th day. Further, the maximum voltage of MFC was 582 mV at stage C and 536 mV at stage D, indicating that the microorganisms on the anode slowly adapted to the TC environment. As the concentration of TC further increased to 50 mg L−1, the voltage of MFC became stable at stage E, and the duration of electricity production was also prolonged. It demonstrated that microorganisms on the anode can be acclimated and is suitable for generating electricity in the presence of TC. At stage F, the concentration of TC remained 50 mg L−1 and the concentration of glucose decreased to 500 mg L−1, the maximum voltage was 561 mV, which was slightly less than the voltage at stage E. This also proved that the microorganisms on the anode has adapted in the presence of high TC concentrations, even in the case of reducing easily degradable organics. At stage III, 50 mg L−1 TC was used as the sole substrate for the MFC. After running two cycles in the presence of 50 mg L−1 TC, the voltage of MFC rapidly decreased and the maximum voltage was respectively 157 ± 2 mV, the generated voltage indicated that TC can be used as sole substrate to generate electricity by microorganisms on the anode.
Degradation of TC
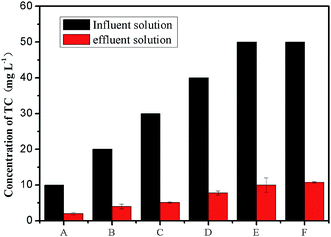
The change in TC concentration at stage II is shown in Fig. 3. During the acclimation stage, the concentration of TC reduced from 10 mg L−1 to 1.9 mg L−1 at stage A. When the initial TC concentration was 20 mg L−1, the effluent concentration of TC was 4.0 mg L−1. As the TC concentration further increased to 40 mg L−1, the removal rates of TC in both cycles was similar and nearly reached to 80%. When the TC was 50 mg L−1 at stages E and F, the effluent concentrations of TC was 9.9 mg L−1 and 10.7 mg L−1, respectively. This result showed that the removal of TC cannot be affected along with the glucose reduction, as the biofilm on anode adapted with the presence of the TC in gradient acclimation.As was shown in Fig. 4a, the removal efficiency in the CC group was the highest. Approximately 53% of TC was removed in CC group within 12 h. After 3 days, the removal efficiency of TC in CC group was more than 70%. After 7 days running, TC concentration was only 10.5 mg L−1, and the removal efficiency of TC reached up to 79.1%. For the OC group, 39.9% of TC concentration was removed within 12 h, and the removal efficiency of TC in the MFC was nearly constant in the subsequent days, and the final removal efficiency of TC was 47.5% within 7 days. On the contrary, no significant change was observed in the TC concentration of the NA group. Only 6.4% TC was removed within 12 h, and the removal efficiency of TC in the NA reactors was 14.9% within 7 days. This phenomenon may also emphasize the importance of gradient acclimation in the process of TC removal by MFC.
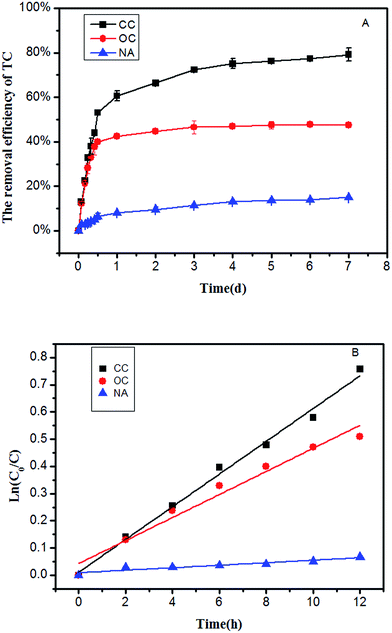 | ||
| Fig. 4 (A) Removal efficiency of TC (B) kinetics curve of TC degradation in the CC, OC and NA groups when 50 mg L−1 TC was fed as sole substrate. | ||
To investigate the TC degradation capability among different groups, a degradation kinetics model was established within 12 h. The substrate biodegradation was described with the following first-order kinetic model:
| ln(C0/C) = k × t | (1) |
Among all three groups, the CC group showed the highest TC removal rate, followed by OC and NA, which showed the lowest removal rate. It might be attributed to the enhanced phenol by MFC. Under the closed circuit, the current generated by the oxidation of TC on the anode was able to be transferred to the terminal electron acceptor oxygen through the external circuit, thereby completing the redox reaction and accelerating the degradation rate of TC. Although no current was present in the OC and NA groups, the final removal efficiency of TC for the OC group was 47.5%, and that for NA group was 14.9%. This huge difference might be mainly attributed to the differences between microbial activities with acclimation and those without. Notably, the removal rates can be distinguished as two different stages in all three groups. The first stage might be defined within 12 h, while the remaining time during the entire process might be defined as stage two. In all three groups, the removal rate of TC at stage one was higher than that at stage two. At the first stage, the high removal rate might be attributed to the combined effects of both absorption and degradation on this TC removal process by MFC. However, at the second stage, the adsorption sites on the biofilm might have been gradually occupied, and the effect of electrode as a continuous long-term electronic acceptor might have been the main factor.
Zebrafish embryos toxicity assessment
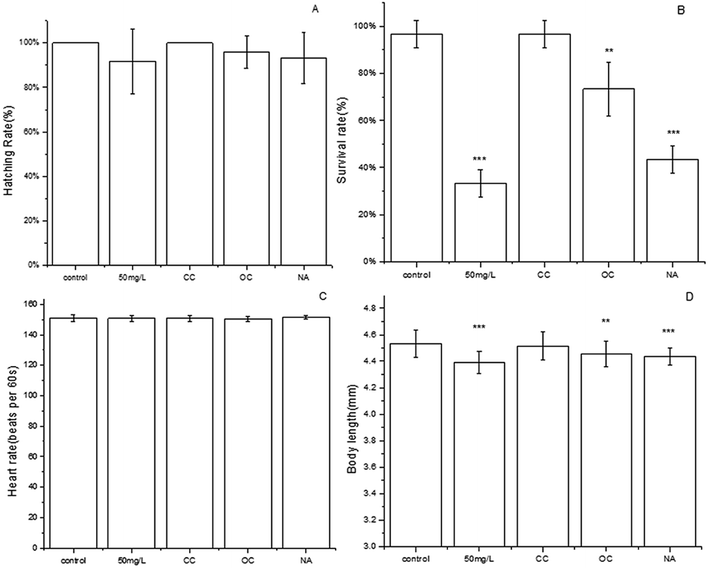
Zebrafish is a model vertebrate that has high homology with the human genome. Thus, it is an excellent model organism in various biomedical fields, especially for toxicity assessment, developmental biology32 and drug screening.33 Besides, compared with the traditional model animals such as mouse, zebrafish is lower in cost and has shorter cycle time and lower compound requirements.34 Although TC can be effectively degraded by MFC, the toxicity of the degradation products is unknown. The degradation products might be more toxic than the parent compounds during antibiotics degradation. Therefore, the toxicity of the effluent in each group was evaluated by zebrafish.The hatching of the embryos seemed to display the different hydatoncus status in the different treatment groups among all the toxicity tests (Fig. 5). The size of hydatoncus in the embryo under 50 mg L−1 tetracycline was the highest, followed by those in the NA and OC group. The CC and control groups had the smaller size of hydatoncus. The area of hydatoncus in the control group was similar to that of the CC group, which were 2.1 and 2.2 (×104 pixels), respectively. However, compared with the control and CC groups, the NA, OC, and 50 mg L−1 groups had larger yolk sac edema areas at 3.0, 3.1, and 3.7 (×104 pixels), respectively. The intuitionistic images results showed that the effluent did not cause any malformation after the MFC treatment. Further, some other important parameters of zebrafish were determined. Hatching rate is an important indicator for toxicity. As shown in Fig. 6a, the hatching rate of the CC group was the highest (100%) similar to the control, followed by the OC (95.8%) and NA (93.3%), which was slightly higher than the 50 mg L−1 TC. The results showed that the effluent in the CC group had no effect on the hatching rate of zebrafish.
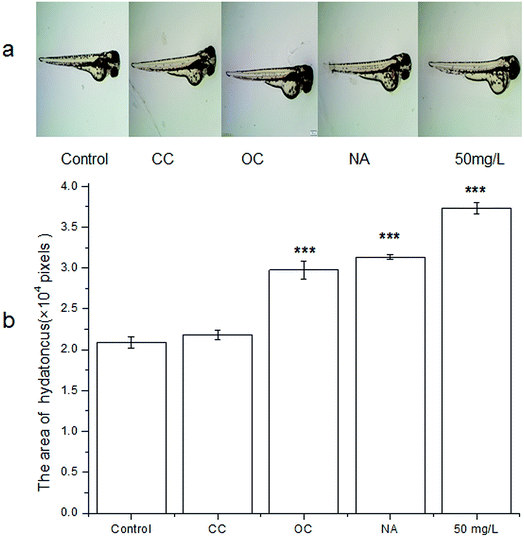 | ||
| Fig. 5 (a) The photos of zebrafish embryos with exposure to different treatment group; (b) measurement of hydatoncus area value in different groups. | ||
Survival rate is considered to be an important event within the course of embryogenesis and thus is a key endpoint for the embryo toxicity test. As shown in Fig. 6b, only 33.3% of the zebrafish survived in 50 mg L−1 TC. However, the survival rate of embryos treated by the CC, OC and NA groups were 96.7%, 73.3% and 43.3%, respectively. The effluent in the CC group showed no effect on the survival of zebrafish embryos in contrast to that of the control (96.7%).
The heart rate of zebrafish embryos reveals cardiovascular toxicity. Fig. 6C showed that the heart rates of the zebrafish embryos were exposed to the different treatment groups at 72 hpf. The normal heartbeat of the control group was 151 times per minute. However, the heartbeats of the other groups were the same as those of the control in all cases. TC had no obvious effect on the heart rate at all test conditions.
Body length is a significant indicator of zebrafish embryo growth (Fig. 6d). In the control group, the body length of healthy zebrafish embryo in the control group was 4.53 mm at 72 hpf. The body length of zebrafish embryos exposed to CC, OC, NA and 50 mg L−1 TC were 4.39 mm, 4.51 mm, 4.45 mm and 4.43 mm. This phenomenon indicated that TC could shorten the body length of zebrafish, especially in the 50 mg L−1 group. However, compared with the OC and NA groups, the CC group had a better effect on the recovery of the body length of zebrafish.
The survival rate of the zebrafish seemed to display the most sensitivity to the TC with different treatment groups among the toxicity test parameters. The differences among the effects of these treatment groups attributed to some malformations caused by TC during embryogenesis. According to our zebrafish toxicity assessments, the CC group showed less toxicity than the other groups. The result showed that TC was effectively degraded by MFC with closed circuit and the resulting degradation products showed nontoxicity on zebrafish embryogenesis.
Bacterial community composition
As shown in Fig. 7a, the dominant phyla in the bacterial communities on anode was Proteobacteria, accounting for 62.4% of the total bacteria sequence, followed by the Firmicutes (26.1%) in the microbial community. Bacteroidetes was also detected, in the biofilm on anode with an abundance of approximately 8.1%. Additionally, the bacterial communities were also identified at genus level (Fig. 7b). The highest relative-abundance group in the microbial community of the inoculum was Achromobacter, with an abundance of 14.9%, followed by Burkholderia–Paraburkholderia (12.3%) and Alcaligenes (9.4%), Geobacter (5.01%), Stenotrophomonas (4.4%) and Enterobacter (4%). Achromobacter, which belongs to Proteobacteria, was reported to have the capability to degrade aromatic compounds, such as benzene, toluene, ethylbenzene and xylene.35,36 Burkholderiales, was reported to use organic carbon as an electron donor and to be capable of denitrification37 and production of nitrogen gas for the maintenance of anaerobic environment in an anode region. Alcaligenes,38 and Geobacter,39 which belongs to Proteobacteria, is an electrochemically active bacterium, responsible for electron transfer via an electrode. Stenotrophomonas is an acid-producing bacterium40 that can ferment carbohydrates to produce organic acid. Enterobacter has a certain drug-resistance,41 and further research was found that Enterobacter from drinking and recreational water sources exhibited varying antibiotic sensitivity.42 Correspondingly, one Enterobacter strain was isolated with TC as the sole carbon substrate from the anode at the end of our experiment (Fig. S1†). The results demonstrated that the Enterobacter in bacterial communities was most likely responsible for the biodegradation of TC in our MFC anodic region. In summary, the removal of TC might be the synergistic action of fermentative bacteria, acid-producing bacteria and electrogenic bacteria on the anode. Given the limited understanding of the function of each strain in bacterial communities of TC removal in MFC system, future research should be focus on the understanding of the synergistic TC degradation mechanism of bacterial communities on the anode.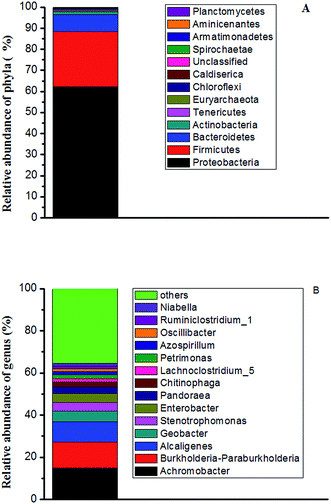 | ||
| Fig. 7 At the end of the experiment, (A) relative abundance of bacterial phyla communities (B) genus communities in anode after MFC treatment TC. | ||
Conclusion
TC can be rapidly degraded in MFC reactors and the degradation rate of TC with different concentrations was basically stable at 80%. The removal efficiency for TC by MFC with closed circuit was higher than that of MFC with opened circuit, and the traditional anaerobic method showed the lowest removal efficiency for TC. The results emphasized the importance of electron transport and the necessity of domestication for TC biodegradation. Zebrafish experiments illustrated that the effluent after MFC treatment was biocompatible and the degradation products showed no toxicity on zebrafish embryogenesis. This work confirmed that anaerobic biodegradation of TC by MFCs is a cost-effective and environmentally friendly method.Conflicts of interest
There are no conflicts to declare.Acknowledgements
The National Science Fund of China (Grant No. 21390201); the Major projects of natural science research in Jiangsu Province (Grant No. 15KJA530002); Fund from the State Key Laboratory of Materials-Oriented Chemical Engineering (ZK201605, KL15-07), CAS Key Laboratory of Bio-based Materials (No. KLBM2016009) and the Priority Academic Program from Development of Jiangsu Higher Education Institutions.References
- M. Seifrtová, L. Nováková, C. Lino, A. Pena and P. Solich, Anal. Chim. Acta, 2009, 649, 158–179 CrossRef PubMed.
- K. Kummerer, Chemosphere, 2009, 75, 417–434 CrossRef PubMed.
- N. Le-Minh, S. J. Khan, J. E. Drewes and R. M. Stuetz, Water Res., 2010, 44, 4295–4323 CrossRef CAS PubMed.
- L. J. Zhou, G. G. Ying, S. Liu, J. L. Zhao and B. Yang, Sci. Total Environ., 2013, 452, 365–376 CrossRef PubMed.
- K. Kumar, S. C. Gupta, Y. Chander and A. K. Singh, Adv. Agron., 2005, 87, 1–54 CAS.
- N. H. Tran, J. Li, J. Hu and S. L. Ong, Environ. Sci. Pollut. Res., 2014, 21, 4727–4740 CrossRef CAS PubMed.
- Y. Luo, W. Guo, H. H. Ngo, L. D. Nghiem, F. I. Hai, J. Zhang, S. Liang and X. C. Wang, Sci. Total Environ., 2014, 473–474, 619–641 CrossRef CAS PubMed.
- M. Crane, C. Watts and T. Boudard, Sci. Total Environ., 2006, 367, 23–41 CrossRef CAS PubMed.
- S. Yahiat, F. Fourcade, S. Brosillon and A. Amrane, Int. Biodeterior. Biodegrad., 2011, 65, 997–1003 CrossRef CAS.
- P. Mahamallik, S. Saha and A. Pal, Chem. Eng. J., 2015, 276, 155–165 CrossRef CAS.
- S. Yang, J. Cha and K. Carlson, J. Chromatogr. A, 2005, 1097, 40–53 CrossRef CAS PubMed.
- A. Pena, M. Paulo, L. Silva, M. Seifrtová, C. Lino and P. Solich, Anal. Bioanal. Chem., 2010, 396, 2929–2936 CrossRef CAS PubMed.
- M. H. Khan, H. Bae and J. Y. Jung, J. Hazard. Mater., 2010, 181, 659–665 CrossRef CAS PubMed.
- Y. Wang, H. Zhang, J. H. Zhang, L. Chen, Q. Q. Huang, J. Wu and F. Liu, J. Hazard. Mater., 2011, 192, 35–43 CAS.
- R. Acosta, V. Fierro, D. Y. A. Martinez, D. Nabarlatz and A. Celzard, Chemosphere, 2016, 149, 168–176 CrossRef CAS PubMed.
- T. T. Lu, X. X. Xu, X. X. Liu and T. Sun, Chem. Eng. J., 2017, 30, 8151–8159 Search PubMed.
- P. Nolwenn, O. Juan and A. Abdeltif, Bioresour. Technol., 2009, 100, 3769–3774 CrossRef PubMed.
- K. L. Yang, Q. Y. Yue, J. J. Kong, P. Zhao, Y. Gao, K. F. Fu and B. Y. Gao, Chem. Eng. J., 2016, 285, 319–330 CrossRef CAS.
- B. E. Logan and J. M. Regan, Trends Microbiol., 2006, 14, 512–518 CrossRef CAS PubMed.
- D. R. Lovley and K. P. Nevin, Curr. Opin. Biotechnol., 2011, 22, 441–448 CrossRef CAS PubMed.
- L. Wang, Y. L. Liu, J. Ma and F. Zhao, Water Res., 2016, 88, 322–328 CrossRef CAS PubMed.
- H. Liu, S. Cheng and B. E. Logan, Environ. Sci. Technol., 2005, 39, 658–662 CrossRef CAS PubMed.
- Y. J. Feng, X. Wang, B. E. Logan and H. Lee, Appl. Microbiol. Biotechnol., 2008, 78, 873–880 CrossRef CAS PubMed.
- T. S. Song, X. Y. Wu and C. C. Zhou, Bioprocess Biosyst. Eng., 2014, 37, 133–138 CrossRef CAS PubMed.
- Y. Luo, G. L. Liu, R. D. Zhang and C. P. Zhang, J. Power Sources, 2010, 195, 190–194 CrossRef CAS.
- S. Zhang, H. L. Song, X. L. Yang, K. Y. Yang and X. Y. Wang, Chemosphere, 2016, 164, 113–119 CrossRef CAS PubMed.
- S. Zhang, H. L. Song, X. L. Yang, K. Y. Yang and X. Y. Wang, RSC Adv., 2016, 6, 95999–96005 RSC.
- M. Pérez-Moya, M. Graells, G. Castells, J. Amigó, E. Ortega, G. Buhigas, L. M. Pérez and H. D. Mansilla, Water Res., 2010, 44, 2533–2540 CrossRef PubMed.
- L. Truong, S. L. Harper and R. L. Tanguay, Methods Mol. Biol., 2011, 691, 271–279 CAS.
- H. L. Jiang, J. H. Tay, A. M. Maszenan and S. T. L. Tay, Appl. Environ. Microbiol., 2004, 70, 6767–6775 CrossRef CAS PubMed.
- W. K. Deng, Y. B. Wang, Z. X. Liu, H. Cheng and Y. Xue, PLoS One, 2014, 9, 111988 Search PubMed.
- A. F. Schier, Nature, 2013, 496, 443–444 CrossRef CAS PubMed.
- A. J. Peterson and R. T. Curr, Curr. Opin. Chem. Biol., 2014, 24, 58–70 Search PubMed.
- P. McGrath and C. Q. Li, Drug Discovery Today, 2008, 13, 394–401 CrossRef CAS PubMed.
- D. R. Nielsen, P. J. McLellan and A. J. Daugulis, Biotechnol. Lett., 2006, 16, 1293–1298 CrossRef PubMed.
- M. Ahmed and D. D. Focht, Can. J. Microbiol., 1973, 19, 47–52 CrossRef CAS PubMed.
- L. Gumaelius, G. Magnusson, B. Pettersson and G. Dalhammar, Int. J. Syst. Evol. Microbiol., 2001, 51, 999–1006 CrossRef CAS PubMed.
- K. Rabaey, N. Boon, S. D. Siciliano, M. Verhaege and W. Verstraete, Appl. Environ. Microbiol., 2004, 70, 5373–5382 CrossRef CAS PubMed.
- D. R. Bond and D. R. Lovley, Appl. Environ. Microbiol., 2003, 691, 548–1555 Search PubMed.
- R. P. Ryan, S. Monchy, M. Cardinale, S. Taghavi, L. Crossman, M. B. Avison, G. Berg, D. V. D. Lelie and J. M. Dow, Nat. Rev. Microbiol., 2009, 7, 514–525 CrossRef CAS PubMed.
- E. S. Anderson, Br. Med. J., 1965, 27, 1289–1291 CrossRef.
- S. Kumar, V. R. Tripathi and S. K. Garg, J. Environ. Sci. Technol., 2013, 10, 789–798 CAS.
Footnote |
| † Electronic supplementary information (ESI) available. See DOI: 10.1039/c7ra07799h |
| This journal is © The Royal Society of Chemistry 2017 |

