 Open Access Article
Creative Commons Attribution 3.0 Unported Licence
Study on the properties of Pb–Co3O4–PbO2 composite inert anodes prepared by vacuum hot pressing technique
Jingshi Zhang ab,
Ruidong Xu*ab,
Bohao Yu
 a,
Yunlong Hea,
Yiyang Lia and
Ziyang Qina
aFaculty of Metallurgical and Energy Engineering, Kunming University of Science and Technology, Kunming 650093, China. E-mail: rdxupaper@aliyun.com
bState Key Laboratory of Complex Nonferrous Metal Resources Clean Utilization, Kunming 650093, China
First published on 20th October 2017
Abstract
Pb–PbO2, Pb–Co3O4 and Pb–Co3O4–PbO2 composite inert anodes were prepared by vacuum hot pressing technique from the mixtures of lead powders, Co3O4 and PbO2 particles in a fixed mould. The influences of heating temperatures and particles doping on the properties of the composite inert anodes were researched. The surface microstructures, phase structures and electrochemical properties were measured by X-ray diffraction (XRD), scanning electronic microscopy (SEM), energy dispersive spectrometer (EDS), anodic polarization curves (AP), cyclic voltammetry curves (CV), Tafel polarization curves and electrochemical impedance spectroscopy (EIS). The results showed that the uniform distributions of Co3O4 and PbO2 as the second phase particles in the composite inert anodes have been obtained by the vacuum hot pressing technique. The lead powders were melted and formed a uniform and compact matrix, in which the morphologies and properties of Co3O4 and PbO2 particles were kept. The electrochemical property and corrosion resistance of the composite inert anodes in a zinc electrowinning simulation solution were improved with the rise of heating temperatures during the vacuum hot pressing, and those were also enhanced by the doping of Co3O4 and PbO2 particles. This method solved the problems of the lower dispersion uniformity of the composite inert anodes prepared by composite electrodeposition or traditional casting technique.
1. Introduction
Composite inert anodes used in zinc electrowinning have been studied widely for many years. The direction of reaction, kinetics of electrode course, structure patterns of the electrolytic cell and electric energy consumption are not only related to the electrolyte characteristics, but also related to the performance of anode materials in zinc electrowinning.1,2 The Pb–Ag (0.75–1.0 wt%) and Pb–Ag (0.2–0.3 wt%)–Ca (0.06–0.1 wt%) alloy anodes are widely used in zinc electrowinning industry in view of their good stability and high corrosion resistance in acid solution. However, they have some shortcomings such as poor conductivity, high overpotential of oxygen evolution, and dissatisfactory mechanical performance.3–5 In order to solve shortcomings, precious metal or other metal (i.e. silver, calcium and thallium in lead alloy) has added in inert anodes by R. H. Newnham.6 Active particles such as tungsten carbide and cobalt oxide have been doped in Al/Pb/α-PbO2 inert anodes by S. He et al.7 The Al/Pb–Ag alloy anodes were studied by Y. Zhang et al. which were obtained by electrodeposition on aluminum matrix.8In order to solve the above problems, there are two main optimization routes by researchers.9–14 (i) The electrocatalytic activity, corrosion resistance and mechanical properties are improved by binary alloy and multi-component alloy base on Pb substrate such as Pb–Ag, Pb–Sn, Pb–Ca, Pb–Ba, Pb–Cd, Pb–Ag–Ca, Pb–Ag–Ti and Pb–Ag–Sn.15–18 But there are still some defects such as high energy consumption and short service life. (ii) The electrocatalytic activity, corrosion resistance and mechanical properties are improved by the metal substrate film anodes such as MnO2, PbO2 and platinum group oxide prepared by composite electrodeposition and other methods, and Ti, Al, Pb and stainless steel can be used as main substrates. However, there are still some deficiencies of short service life and lower dispersion uniformity.19
Co3O4 particle as a metal oxide catalytic agent has extensive applications for catalyst to electrode.20 It is widely used in the fields of super capacitor, ceramic and catalyst, and has shown excellent electrochemical properties such as electrocatalytic capacity, electrocatalytic activity of oxygen evolution.21,22 In order to obtain Pb–Co3O4–PbO2 composite inert anodes used in zinc electrowinning, the molten metal (traditional casting) method was used firstly, But Co3O4 and PbO2 particles could not be wetted into molten lead, leading that the blending homogeneity of particles in the composite inert anodes could not controlled. The vacuum hot pressing method as a kind of powder metallurgy process can be carried out under low-temperature condition, which reduces diffusion rates and controls the interface reaction kinetics.23–25 It has been used to prepare diamond/Al, diamond/Si–Cu and Al–Cu–Fe composites.26–28
In this research, Pb–Co3O4–PbO2 composite inert anodes were prepared by vacuum hot pressing technique from the mixtures of Pb powders, Co3O4 and PbO2 particles in a fixed mould, which solved the problems of the failure and lower blending homogeneity of the composite inert anodes prepared by composite electrodeposition or traditional casting technique, and a better electrochemical property has been obtained in a zinc electrowinning simulation solution. During the vacuum hot pressing, the influences of the heating temperatures and particles doping on the preparation and properties of the composite inert anodes were investigated. The surface morphologies, phase structures and electrochemical properties of the composite inert anodes were measured by scanning electronic microscopy, X-ray diffractometer and electrochemical workstation.
2. Experimental
2.1 Preparation of the composite inert anodes
Lead powder (Pb, purity: 99.9%), cobalt oxide (Co3O4, purity: 99.9%) and lead dioxide (PbO2, purity ≥ 97.0%) were used in the experiments. The molar ratio of Pb/PbO2 or Pb/Co3O4 was 10![[thin space (1/6-em)]](https://www.rsc.org/images/entities/char_2009.gif) :
:![[thin space (1/6-em)]](https://www.rsc.org/images/entities/char_2009.gif) 1, and that of Pb/PbO2/Co3O4 was 10
1, and that of Pb/PbO2/Co3O4 was 10![[thin space (1/6-em)]](https://www.rsc.org/images/entities/char_2009.gif) :
:![[thin space (1/6-em)]](https://www.rsc.org/images/entities/char_2009.gif) 1
1![[thin space (1/6-em)]](https://www.rsc.org/images/entities/char_2009.gif) :
:![[thin space (1/6-em)]](https://www.rsc.org/images/entities/char_2009.gif) 1. Firstly, the mixtures of Pb, Co3O4 and PbO2 powders were blended homogeneously by using agate mortar for 30 minutes. Then, the blended powders were placed into graphite mould with inner and outer diameters of 30 and 85 mm respectively in the vacuum hot press furnace. Thereafter, the furnace was vacuumized to 10−3 Pa, a pressure of 65 MPa and a heating rate of 10 °C min−1 were provided. The heating temperatures were controlled ranges of 260 °C to 340 °C, 260, 280, 300, 320, 340 °C respectively, and the heating time was controlled at 45 min. And then, furnace was begun to cool. When furnace temperature was cooled down to 80 °C, the air would be pumped in the furnace, and when furnace temperature was cooled down to 60 °C, the graphite mould would be brought out. Finally, Pb–PbO2, Pb–Co3O4 and Pb–Co3O4–PbO2 composite inert anodes were obtained by vacuum hot pressing method in ZT-30-16Y vacuum hot press furnace.
1. Firstly, the mixtures of Pb, Co3O4 and PbO2 powders were blended homogeneously by using agate mortar for 30 minutes. Then, the blended powders were placed into graphite mould with inner and outer diameters of 30 and 85 mm respectively in the vacuum hot press furnace. Thereafter, the furnace was vacuumized to 10−3 Pa, a pressure of 65 MPa and a heating rate of 10 °C min−1 were provided. The heating temperatures were controlled ranges of 260 °C to 340 °C, 260, 280, 300, 320, 340 °C respectively, and the heating time was controlled at 45 min. And then, furnace was begun to cool. When furnace temperature was cooled down to 80 °C, the air would be pumped in the furnace, and when furnace temperature was cooled down to 60 °C, the graphite mould would be brought out. Finally, Pb–PbO2, Pb–Co3O4 and Pb–Co3O4–PbO2 composite inert anodes were obtained by vacuum hot pressing method in ZT-30-16Y vacuum hot press furnace.
2.2 Measurements of the composite inert anodes
All electrochemical measurements in the zinc electrowinning simulated electrolyte were carried out by a PARATAT2273 electrochemical workstation with a standard three-electrode system. The composite inert anode was employed as the working electrode and its active area was 1 cm2, the reference electrode was a saturated calomel electrode (SCE) and the counter electrode was a graphite electrode. The reference electrode and working electrode were linked by a Luggin capillary filled with agar and potassium chloride. In addition, the distance between the capillary and working electrode surface was about 2d (d is the diameter of capillary), and d was 0.5 mm. The compositions of the zinc electrowinning simulated electrolyte solution were as follows: 50 g L−1 Zn2+ and 150 g L−1 H2SO4, the test temperature was controlled at 35 °C. Anodic polarization curves (AP), cyclic voltammetry curves (CV), Tafel polarization curves and electrochemical impedance spectroscopy (EIS) were obtained in the zinc electrowinning simulated electrolyte system. In addition, phase structures of the composite inert anodes were measured by D/Max-2200 X-ray diffractometer, the surface morphologies and the chemical compositions of the composite inert anodes were measured by VEGA3-SBH scanning electronic microscopy with UltroDry energy dispersive spectrometer.3. Results and discussion
3.1 Anodic polarization curves of the composite inert anodes
Anodic polarization curves of Pb–Co3O4 composite inert anodes obtained at different heating temperatures were measured in the zinc electrowinning simulated solution, and the results were shown in Fig. 1. The inset is the Tafel lines (η = a + b![[thin space (1/6-em)]](https://www.rsc.org/images/entities/char_2009.gif) lg
lg![[thin space (1/6-em)]](https://www.rsc.org/images/entities/char_2009.gif) i) of the oxygen evolution reaction.29–31 The kinetic parameters of Tafel linear fitting and oxygen evolution overpotentials of the composite inert anodes obtained at different heating temperatures were shown in Table 1.
i) of the oxygen evolution reaction.29–31 The kinetic parameters of Tafel linear fitting and oxygen evolution overpotentials of the composite inert anodes obtained at different heating temperatures were shown in Table 1.
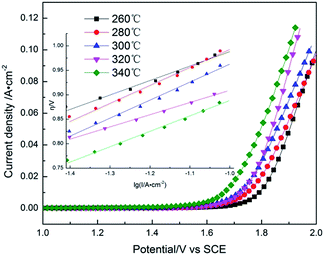 | ||
| Fig. 1 Anodic polarization curves of Pb–Co3O4 composite inert anodes obtained at different heating temperatures (scanning rate: v = 5 mV s−1). | ||
| Heating temperature/°C | Oxygen evolution overpotential η/V | Tafel formula and related parameters | ||||||
|---|---|---|---|---|---|---|---|---|
| 400 A m−2 | 500 A m−2 | 600 A m−2 | a | b | α | β | i0/A cm−2 | |
| a Where, η is the oxygen evolution overpotential. a and b are constants, i0 is the exchange current density, α and β are transfer coefficient.32–34 | ||||||||
| 260 | 0.878 | 0.900 | 0.917 | 1.283 | 0.295 | 0.207 | 0.793 | 4.519 × 10⁻⁵ |
| 280 | 0.857 | 0.882 | 0.906 | 1.360 | 0.378 | 0.161 | 0.839 | 2.004 × 10⁻⁴ |
| 300 | 0.825 | 0.852 | 0.876 | 1.330 | 0.368 | 0.166 | 0.834 | 2.417 × 10⁻⁴ |
| 320 | 0.813 | 0.833 | 0.851 | 1.158 | 0.249 | 0.245 | 0.755 | 2.262 × 10⁻⁵ |
| 340 | 0.768 | 0.792 | 0.817 | 1.203 | 0.315 | 0.194 | 0.806 | 1.508 × 10⁻⁴ |
As shown in Fig. 1 and Table 1, the oxygen evolution potentials or overpotentials decreased with the rise of heating temperatures from 260 °C to 340 °C, displaying that increasing heating temperature was favourable to the reduction of oxygen evolution potentials or overpotentials of the composite inert anodes in the zinc electrowinning simulated solution. The composite inert anodes obtained by the heating temperature of 340 °C possessed the lowest oxygen evolution overpotentials with 0.768, 0.792 and 0.817 V at the current densities of 400, 500 and 600 A m−2, displaying that the electrocatalytic activity of Pb–Co3O4 composite inert anode was the best in the zinc electrowinning simulation solution.
Pb–Co3O4 composite inert anode obtained at 340 °C possessed the lowest oxygen evolution overpotentials and the best electrocatalytic activity, while it was very difficult to prepare the composite inert anodes because of the precipitation of molten lead from the graphite mould at a pressure of 65 MPa. Thus, the heating temperature was more appropriate to be controlled at 320 °C.
Anodic polarization curves of Pb–PbO2, Pb–Co3O4, Pb–Co3O4–PbO2 composite inert anodes obtained at the heating temperature of 320 °C in the zinc electrowinning simulated solution, were shown in Fig. 2. The kinetic parameters of Tafel linear fitting and oxygen evolution overpotentials of the composite inert anodes were shown in Table 2.
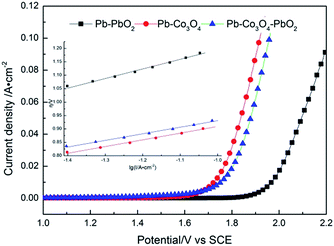 | ||
| Fig. 2 Anodic polarization curves of Pb–PbO2, Pb–Co3O4, Pb–Co3O4–PbO2 composite inert anodes obtained at the heating temperature of 320 °C (scanning rate: v = 5 mV s−1). | ||
| Anodes types | Oxygen evolution overpotential η/V | Tafel formula and related parameters | ||||||
|---|---|---|---|---|---|---|---|---|
| 400 A m−2 | 500 A m−2 | 600 A m−2 | a | b | α | β | i0/A cm−2 | |
| Pb–PbO2 | 1.062 | 1.086 | 1.112 | 1.553 | 0.358 | 0.170 | 0.830 | 4.592 × 10⁻⁵ |
| Pb–Co3O4 | 0.813 | 0.833 | 0.851 | 1.158 | 0.249 | 0.245 | 0.755 | 2.262 × 10⁻⁵ |
| Pb–Co3O4–PbO2 | 0.838 | 0.858 | 0.876 | 1.262 | 0.308 | 0.198 | 0.802 | 7.951 × 10⁻⁵ |
As shown in Fig. 2 and Table 2, at the current densities of 400, 500 and 600 A m−2, the oxygen evolution potentials or overpotentials of Pb–Co3O4 composite inert anodes were lower than those of Pb–PbO2 and Pb–Co3O4–PbO2 composite inert anodes obtained at the heating temperature of 320 °C. It can be concluded that Co3O4 particles improve the electrocatalytic activity obviously better than PbO2 particles in the zinc electrowinning simulation solution. The good electro-catalytic capability of Co3O4 may be the main reason for the decreasing of the oxygen overpotential.35–39
The value of (a) closely associated with the initial oxygen evolution overpotential, which is the oxygen evolution overpotential of composite anode at 1 A m−2. The value of (b) is directly relative to the transfer coefficient, whose relationship was shown by equations (b = 2.303RT/αF, α + β = 1). According to compare with Tafel formula and related parameters, there is not obviously changing. It indicates that microcosmic electrochemical reaction is stable.40
3.2 Cyclic voltammetry curves of the composite inert anodes
Cyclic voltammetry is one of the most simple and effective method of electrochemical test, which can control the change of electrode potential at a constant rate in the form of a triangular wave and measure one or more times for current of the electrode. Therefore, the redox reaction in the potential range of electrode can be observed and the limit and reversibility of electrode reaction can be determined.41,42 The voltammetry charge q* reflects the amounts of the surface active sites of the electrode, and it is an important parameter to evaluate the electrochemical active surface area.43,44The cyclic voltammetry curves of Pb–Co3O4 composite inert anodes obtained at different heating temperatures were shown in Fig. 3, and its voltammetry charge q* was exhibited in Table 3.
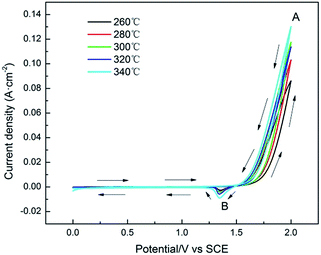 | ||
| Fig. 3 Cyclic voltammetry curves of Pb–Co3O4 composite inert anodes obtained at different heating temperatures (scanning rate: v = 50 mV s−1). | ||
| Heating temperature/°C | Voltammetry charge, q*/C cm−2 |
|---|---|
| 260 | 0.548 |
| 280 | 0.643 |
| 300 | 0.730 |
| 320 | 0.787 |
| 340 | 0.856 |
As shown in Fig. 3, it was obvious that the redox reaction occurring on the surface of Pb–Co3O4 composite inert anodes was an irreversible. There were one oxidation peak A and one reduction peak B, in which peak A was produced by oxygen evolution reaction, and peak B was taken place by the reduction reaction of PbO2 → Pb2+. In addition, the peak values of oxidation peak A increased gradually with the rise of heating temperatures. It can be seen in Table 3 that the voltammetry charge q* of Pb–Co3O4 composite inert anodes increased with the rise of heating temperatures, the main reason is that a part of lead powders were oxidized by residual air during the vacuum hot pressing process, and some lead dioxides were formed. According to the results in Fig. 3, the peak values of PbO2 reduction peak B increased with the rise of heating temperatures, which reflects the increasing of the amounts of lead dioxides on the surface of the composite inert anodes, leading to the increasing of the surface active sites amounts and voltammetry charge q*.45 Above research results display that the values of voltammetry charge q* were increased with the raise of treated temperatures from 260 °C to 340 °C and the electrocatalytic activity of Pb–Co3O4 composite inert anodes were improved with increasing heating temperatures from 260 °C to 340 °C.
The cyclic voltammetry curves and voltammetry charge q* of Pb–PbO2, Pb–Co3O4 and Pb–Co3O4–PbO2 composite inert anodes were shown in Fig. 4 and Table 4, respectively.
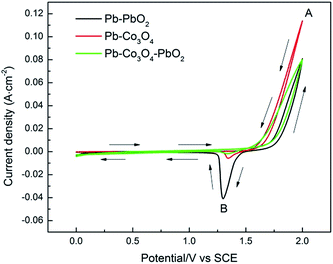 | ||
| Fig. 4 Cyclic voltammetry curves Pb–PbO2, Pb–Co3O4 and Pb–Co3O4–PbO2 composite inert anodes obtained at the heating temperature of 320 °C (scanning rate: v = 50 mV s−1). | ||
| Anode types | Voltammetry charge, q*/C cm−2 |
|---|---|
| Pb–PbO2 | 0.325 |
| Pb–Co3O4 | 0.787 |
| Pb–Co3O4–PbO2 | 0.530 |
As shown in Fig. 4, there were also one oxidation peak A and one reduction peak B. The peak value of oxidation peak A of Pb–Co3O4 composite inert anode was the maximum, that of Pb–Co3O4–PbO2 composite inert anode was in the middle and that of Pb–PbO2 composite inert anode was the minimum. It can be seen in Table 4 that the voltammetry charge q* of Pb–PbO2, Pb–Co3O4, Pb–Co3O4–PbO2 composite inert anodes were 0.787C cm−2, 0.530C cm−2 and 0.325C cm−2. To compare with doping level, the values of voltammetry charge q* were increased obviously with doping Co3O4 particles than PbO2 particles. Therefore, it can be concluded that the electrocatalytic activity of the composite inert anodes is related with particle types, the electrocatalytic activity of Pb–Co3O4 composite inert anode was higher than that of Pb–PbO2 composite inert anode, displaying that Co3O4 particles improved the electrochemical performance obviously better than that of PbO2 particles, this research result was consistent with that of Fig. 2 and Table 2.
3.3 Corrosion resistance of the composite inert anodes
Tafel polarization is a fast and effective technique to characterize the corrosion resistance of materials, which has been widely used in the field of the corrosion science.46 The self-corrosion potential and the self-corrosion current density of the working electrode can be obtained. The value of self-corrosion potential (Ecorr) expresses the self-corrosion ability of material without any external electric source, and the value of self-corrosion current density (icorr) represents the corrosion rate of materials at the same potential.The Tafel polarization curves of Pb–Co3O4 composite inert anodes obtained at different heating temperatures from 260 °C to 340 °C were shown in Fig. 5, Ecorr and icorr were shown in Table 5.
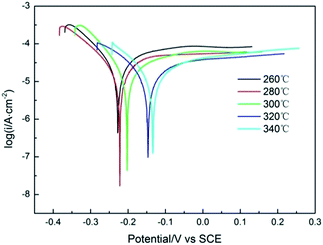 | ||
| Fig. 5 Tafel polarization curves of Pb–Co3O4 composite inert anodes obtained at different heating temperatures (scanning rate: v = 1 mV s−1). | ||
| Heating temperature/°C | Self-corrosion potential Ecorr/V (vs. SCE) | Self-corrosion current density icorr/A cm−2 |
|---|---|---|
| 260 | −0.227 | 7.298 × 10⁻⁵ |
| 280 | −0.222 | 6.183 × 10⁻⁵ |
| 300 | −0.203 | 5.797 × 10⁻⁵ |
| 320 | −0.146 | 5.461 × 10⁻⁵ |
| 340 | −0.134 | 2.305 × 10⁻⁵ |
As shown in Fig. 5 and Table 5, the value of Ecorr of Pb–Co3O4 composite inert anodes increased with the rise of the heating temperature from 260 °C to 340 °C and that of icorr decreased with the rise of the heating temperatures, showing that the corrosion resistance of the composite inert anodes in the zinc electrowinning simulated electrolyte solution was enhanced with the rise of the heating temperatures. Pb–Co3O4 composite inert anode obtained at 340 °C possessed the highest Ecorr (−0.134 V) and the lowest icorr (2.305 × 10⁻⁵ A cm−2), displaying that its corrosion resistance was best.
The Tafel polarization curves, Ecorr, icorr of Pb–PbO2, Pb–Co3O4, Pb–Co3O4–PbO2 composite inert anodes obtained at the heating temperature of 320 °C, were shown in Fig. 6 and Table 6. The Ecorr value of Pb–Co3O4–PbO2 composite inert anode was the highest (−0.125 V), and its icorr value was the lowest (2.034 × 10⁻⁵ A cm−2), displaying that the corrosion resistance of Pb–Co3O4–PbO2 composite inert anodes obviously better than that of Pb–PbO2 and Pb–Co3O4 composite inert anodes in the zinc electrowinning simulated electrolyte solution.
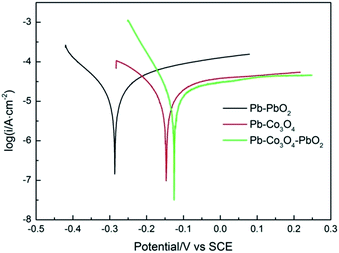 | ||
| Fig. 6 Tafel polarization curves of Pb–PbO2, Pb–Co3O4 and Pb–Co3O4–PbO2 composite inert anodes obtained at the heating temperature of 320 °C (scanning rate: v = 1 mV s−1). | ||
| Anode types | Self-corrosion potential Ecorr/V (vs. SCE) | Self-corrosion current density icorr/A cm−2 |
|---|---|---|
| Pb–PbO2 | −0.286 | 7.298 × 10⁻⁵ |
| Pb–Co3O4 | −0.146 | 5.461 × 10⁻⁵ |
| Pb–Co3O4–PbO2 | −0.125 | 2.034 × 10⁻⁵ |
The corrosion resistance the composite inert anodes is affected by particle property and of preparation process temperature. On the one hand, more lead powders were melted and recrystallized with the rise of heating temperatures, and then a more compact matrix was formed, in which it decreased the structure defects of Pb–Co3O4 composite inert anodes.47–49 Therefore, the corrosion resistance of Pb–Co3O4 composite inert anodes was improved with increasing heating temperatures from 260 °C to 340 °C. On the other hand, PbO2 and Co3O4 powders are insoluble particles in the zinc electrowinning simulated electrolyte solution, the simultaneous doping of Co3O4 and PbO2 particles in the lead matrix improved the corrosion resistance more obviously than the individual doping of Co3O4 or PbO2 particle. Thus, the corrosion resistance of Pb–Co3O4–PbO2 composite inert anode was better than that Pb–PbO2 or Pb–Co3O4 composite inert anode in the zinc electrowinning simulated electrolyte solution.
3.4 Electrochemical impedance spectroscopy of the composite inert anodes
In the case of electrochemical impedance spectroscopy (EIS) measurements, the working electrode potential was performed at 1.6 V potential chosen from the oxygen reaction controlled region over a frequency range of 100 kHz to 0.1 Hz with a signal amplitude perturbation of 10 mV.40 Nyquist plots before and after cycle of Pb–Co3O4 composite inert anodes obtained at different heating temperatures were shown in Fig. 7, equivalent circuit of that was shown in Fig. 8, Bode plots before and after cycle of Pb–Co3O4 composite inert anodes were shown in Fig. 9 and EIS simulating parameters before and after cycle of equivalent circuit element of Pb–Co3O4 composite inert anodes were shown in Tables 7 and 8.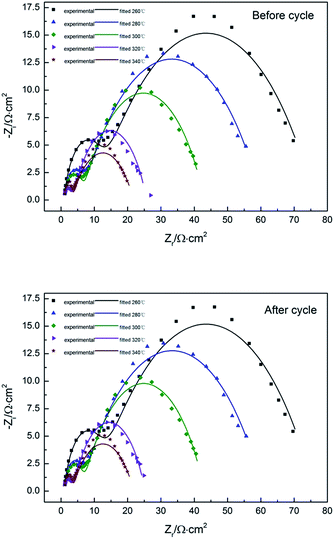 | ||
| Fig. 7 Nyquist plots before and after cycle of Pb–Co3O4 composite inert anodes obtained at different heating temperatures. | ||
 | ||
| Fig. 8 Equivalent circuit of Pb–Co3O4 composite inert anodes obtained at different heating temperatures. | ||
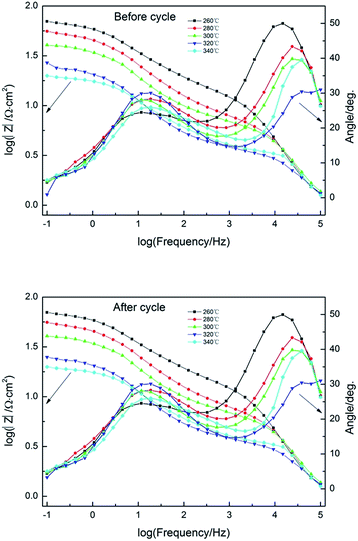 | ||
| Fig. 9 Bode plots before and after cycle of Pb–Co3O4 composite inert anodes obtained at different heating temperatures. | ||
| Heating temperature/°C | Rs/Ω cm−2 | Q/S cm−2 s−n | n | Rct/Ω cm−2 | Q1/S cm−2 s−n | n1 | R1/Ω cm−2 | Chi squared |
|---|---|---|---|---|---|---|---|---|
| 260 | 0.8178 | 2.747 × 10⁻⁵ | 0.5586 | 64.57 | 2.178 × 10⁻⁵ | 0.8535 | 10.640 | 9.620 × 10⁻⁴ |
| 280 | 0.8678 | 3.305 × 10⁻³ | 0.5662 | 53.78 | 1.417 × 10⁻⁵ | 0.8783 | 5.505 | 9.894 × 10⁻⁴ |
| 300 | 0.8747 | 3.802 × 10⁻³ | 0.6233 | 36.48 | 2.566 × 10⁻⁵ | 0.8142 | 5.619 | 1.426 × 10⁻³ |
| 320 | 0.4866 | 5.591 × 10⁻³ | 0.6640 | 21.97 | 1.094 × 10⁻⁴ | 0.6789 | 3.229 | 1.845 × 10⁻³ |
| 340 | 0.8685 | 7.662 × 10⁻³ | 0.5541 | 18.44 | 3.211 × 10⁻⁶ | 0.9944 | 2.460 | 5.998 × 10⁻³ |
| Heating temperature/°C | Rs/Ω cm−2 | Q/S cm−2 s−n | n | Rct/Ω cm−2 | Q1/S cm−2 s−n | n1 | R1/Ω cm−2 | Chi squared |
|---|---|---|---|---|---|---|---|---|
| 260 | 0.8936 | 2.724 × 10⁻⁵ | 0.5595 | 64.47 | 1.865 × 10⁻⁵ | 0.8935 | 10.550 | 1.206 × 10⁻³ |
| 280 | 0.8822 | 3.354 × 10⁻³ | 0.5587 | 54.42 | 1.138 × 10⁻⁵ | 0.8822 | 5.298 | 1.061 × 10⁻³ |
| 300 | 0.8801 | 3.753 × 10⁻³ | 0.6295 | 36.30 | 2.650 × 10⁻⁵ | 0.8107 | 5.823 | 1.719 × 10⁻³ |
| 320 | 0.4827 | 5.405 × 10⁻³ | 0.6707 | 21.46 | 1.130 × 10⁻⁴ | 0.6758 | 3.252 | 1.320 × 10⁻³ |
| 340 | 0.8393 | 7.670 × 10⁻³ | 0.5532 | 18.50 | 4.786 × 10⁻⁶ | 0.9581 | 2.507 | 5.704 × 10⁻³ |
As shown in Fig. 7, the similar two profiles of the Nyquist plots reveal that the electrode oxygen evolution reaction mechanism does not change with the raise of heating temperatures. According to the calculation from Zsimp-win software, circuit R(QR)(QR) was selected as equivalent circuit to simulate Nyquist plots. The values of Chi squared are close to 10−3 shown in Tables 7 and 8, which indicates the equivalent circuit can reflect oxygen evolution reaction more accurately on the surface of Pb–Co3O4 composite inert anodes. In present circuit, Rs is the solution resistance and Q1 is adsorption charge capacitance. R1 and Rct represent adsorption resistance and interfacial charge transfer resistance respectively. Q is corresponding to interfacial charge transfer. The values of Rs are all identical with each other, which show that the solutions have good conductivity. The charge transfer resistance Rct can reflect difficulty of oxygen evolution reaction as an important parameter. The values of Rct decreased with the raise of heating temperatures.50 It reveals that the oxygen evolution reaction would be easy and the electro-catalytic capability can be improved by the raise of heating temperatures, this research result was consistent with analysis of anodic polarization curves and cyclic voltammetry curves. In addition, there are two peaks in Bode plots, and the number of peaks in the phase angle Bode plot equals the number of (CPE) elements in circuit.51 It was consistent with analysis of Nyquist plots. To compare with the Nyquist and Bode plots before and after cycle of Pb–Co3O4 composite inert anodes, it shows that Pb–Co3O4 composite inert anodes have stable electrochemical performance.
Nyquist plots and Bode plots before and after cycle of Pb–PbO2, Pb–Co3O4 and Pb–Co3O4–PbO2 composite inert anodes obtained at the heating temperature of 320 °C were shown in Fig. 10, Tables 9 and 10 respectively. The circuit R(QR)(QR) was selected as equivalent circuit due to values of Chi squared are close to 10−3 shown in Tables 9 and 10. As shown in Table 8, the Rct value of Pb–Co3O4 and Pb–PbO2 composite inert anode are the minimum and maximum respectively. It shows that the oxygen evolution reaction would be easy by the doping of Co3O4. The Co3O4 particles improved the electrochemical performance obviously better than that of PbO2 particles, this research result was consistent with analysis of anodic polarization curves and cyclic voltammetry curves. There are also two peaks in Bode plots, which displays that analysis of Nyquist plots is correct (Fig. 11).
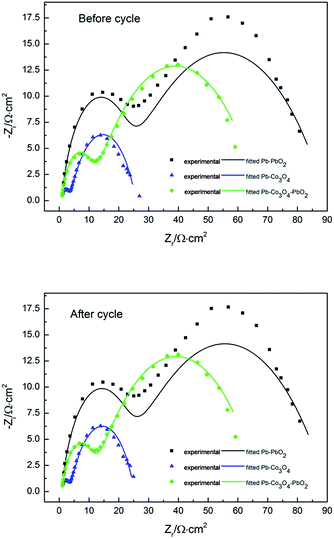 | ||
| Fig. 10 Nyquist plots before and after cycle of Pb–PbO2, Pb–Co3O4 and Pb–Co3O4–PbO2 composite inert anodes obtained at the heating temperature of 320 °C. | ||
| Heating temperature/°C | Rs/Ω cm−2 | Q/S cm−2 s−n | n | Rct/Ω cm−2 | Q1/S cm−2 s−n | n1 | R1/Ω cm−2 | Chi squared |
|---|---|---|---|---|---|---|---|---|
| Pb–PbO2 | 0.6430 | 2.491 × 10⁻³ | 0.4990 | 68.30 | 7.337 × 10⁻⁶ | 0.8541 | 20.780 | 3.230 × 10⁻³ |
| Pb–Co3O4 | 0.4866 | 5.591 × 10⁻³ | 0.6640 | 21.97 | 1.094 × 10⁻⁴ | 0.6789 | 3.229 | 1.845 × 10⁻³ |
| Pb–Co3O4–PbO2 | 0.7844 | 5.663 × 10⁻³ | 0.5416 | 56.79 | 3.058 × 10⁻⁵ | 0.8430 | 9.897 | 5.109 × 10⁻⁴ |
| Heating temperature/°C | Rs/Ω cm−2 | Q/S cm−2 s−n | n | Rct/Ω cm−2 | Q1/S cm−2 s−n | n1 | R1/Ω cm−2 | Chi squared |
|---|---|---|---|---|---|---|---|---|
| Pb–PbO2 | 0.6560 | 2.534 × 10⁻³ | 0.4972 | 68.42 | 8.095 × 10⁻⁶ | 0.8431 | 21.080 | 3.587 × 10⁻³ |
| Pb–Co3O4 | 0.4827 | 5.405 × 10⁻³ | 0.6707 | 21.46 | 1.130 × 10⁻⁴ | 0.6758 | 3.252 | 1.320 × 10⁻³ |
| Pb–Co3O4–PbO2 | 0.8150 | 3.942 × 10⁻³ | 0.5475 | 56.31 | 3.942 × 10⁻⁵ | 0.8132 | 10.370 | 6.854 × 10⁻⁴ |
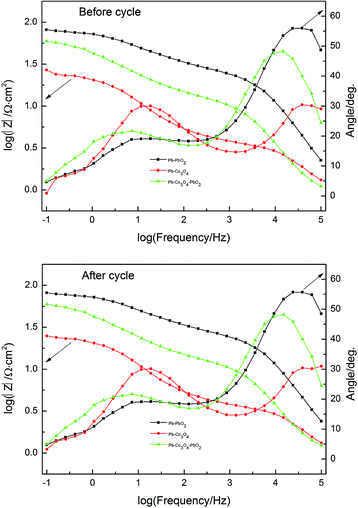 | ||
| Fig. 11 Bode plots before and after cycle of Pb–PbO2, Pb–Co3O4 and Pb–Co3O4–PbO2 composite inert anodes obtained at the heating temperature of 320 °C. | ||
3.5 The phase structures and surface microstructures of the composite inert anodes
XRD patterns of Pb–PbO2, Pb–Co3O4 and Pb–Co3O4–PbO2 composite inert anodes obtained under the optimum preparation conditions, were shown in Fig. 12.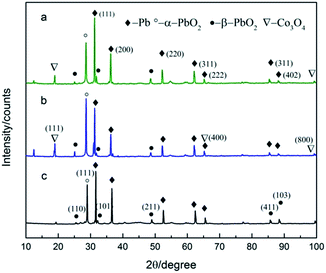 | ||
| Fig. 12 XRD patterns of Pb–PbO2, Pb–Co3O4 and Pb–Co3O4–PbO2 composite inert anodes with (a) Pb–Co3O4–PbO2, (b) Pb–Co3O4 and (c) Pb–PbO2. | ||
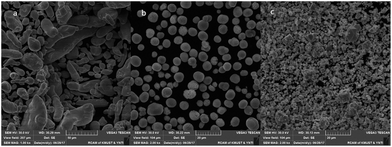
The surface microstructures of Pb, Co3O4 and PbO2 powders were shown in Fig. 13, and those of Pb–PbO2, Pb–Co3O4 and Pb–Co3O4–PbO2 composite inert anodes were shown in Fig. 14.
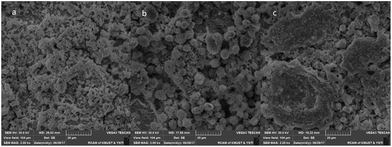 | ||
| Fig. 14 Surface microstructures of Pb–PbO2 (a), Pb–Co3O4 (b) and Pb–Co3O4–PbO2 (c) composite inert anodes. | ||
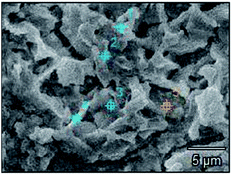
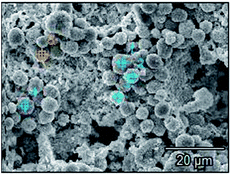
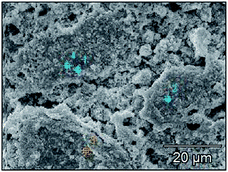
The energy spectrum analysis of Pb–PbO2 composite inert anode was shown in Fig. 15 and Table 11, that of Pb–Co3O4 composite inert anode was shown in Fig. 16 and Table 12, and that of Pb–Co3O4–PbO2 composite inert anode was shown in Fig. 17 and Table 13.
| Points | at% of O | at% of Pb | wt% of O | wt% of Pb |
|---|---|---|---|---|
| pt1 | 41.19 | 58.81 | 10.43 | 89.57 |
| pt2 | 40.42 | 59.58 | 11.81 | 88.19 |
| pt3 | 36.69 | 63.31 | 11.92 | 88.08 |
| pt4 | 36.09 | 63.91 | 10.51 | 89.49 |
| pt5 | 34.64 | 65.36 | 6.96 | 93.04 |
| Points | at% of O | at% of Co | at% of Pb | wt% of O | wt% of Co | wt% of Pb |
|---|---|---|---|---|---|---|
| pt1 | 59.71 | 21.53 | 18.76 | 25.51 | 34.46 | 40.03 |
| pt2 | 37.07 | 20.82 | 42.11 | 5.62 | 11.64 | 82.74 |
| pt3 | 18.50 | 8.50 | 73.00 | 3.58 | 6.07 | 90.35 |
| pt4 | 36.69 | 57.75 | 5.56 | 11.41 | 66.19 | 22.40 |
| pt5 | 30.60 | 6.24 | 63.16 | 5.18 | 4.11 | 90.71 |
| Points | at% of O | at% of Co | at% of Pb | wt% of O | wt% of Co | wt% of Pb |
|---|---|---|---|---|---|---|
| pt1 | 26.46 | 14.70 | 58.84 | 4.23 | 8.82 | 86.95 |
| pt2 | 24.79 | 33.10 | 42.09 | 5.95 | 17.99 | 76.06 |
| pt3 | 34.21 | 27.91 | 37.88 | 9.94 | 17.76 | 72.30 |
| pt4 | 31.41 | 34.02 | 34.57 | 10.25 | 22.77 | 66.98 |
As can be seen in Fig. 13, lead powders were irregular elliptical, Co3O4 particles were spherical, and PbO2 particles were tetragonal. As shown in Fig. 14(a) and (c), 15, 17, Tables 11 and 13, it can be seen that a part of lead powers were melt to the recrystallized lead with compact microstructures during the vacuum hot pressing, and thereafter, some lead powders and recrystallized lead were also oxidized to PbO2. Therefore, the characteristics of Pb and PbO2 powder mixtures occurred in the microstructures of Pb–PbO2 and Pb–Co3O4–PbO2 composite inert anodes. As shown in Fig. 14(b) and (c), 16, 17, Tables 12 and 13, Co3O4 and PbO2 particles were distributed uniformly in Pb–Co3O4 or Pb–Co3O4–PbO2 composite inert anodes, which solved the problems of lower dispersion uniformity for the composite inert anodes prepared by composite electrodeposition or traditional casting technique. Above research results show that the morphologies and properties of Co3O4 and PbO2 particles in the composite inert anodes were kept during the vacuum hot pressing.
3.6 The performance of current inert anodes compared with others
The performance of inert anodes compared with other related inert anodes in the literatures were show in Table 14.| Anode types | Oxygen evolution overpotential η/V | Self-corrosion potential Ecorr/V (vs. SCE) | Self-corrosion current density icorr/A cm−2 | ||
|---|---|---|---|---|---|
| 400 A m−2 | 500 A m−2 | 600 A m−2 | |||
| Pb–Co3O4 | 0.813 | 0.833 | 0.851 | −0.146 | 5.461 × 10⁻⁵ |
| Al/Pb/α-PbO2–WC | 0.807 | 0.839 | 0.866 | 1.186 | 9.045 × 10⁻⁶ |
| Al/Pb–PANI–WC | — | 0.941 | — | −0.470 | 4.506 × 10⁻³ |
| Pb-0.3% Ag/Pb–WC | — | 0.926 | 0.940 | −0.522 | 9.500 × 10⁻³ |
| Pb–1% Ag | — | 1.171 | 1.182 | −0.505 | 5.170 × 10⁻³ |
There are five types of inert anodes in the table. The Pb–Co3O4 inert anodes were obtained by vacuum hot pressing technique in our research. The Al/Pb/α-PbO2–WC inert anodes were studied by S. W. He et al.7 The performance of Al/Pb–PANI–WC inert anodes was studied by R. D. Xu. et al.52 The electrochemical properties of Pb-0.3% Ag/Pb–WC and Pb–1% Ag inert anodes were measured by S. He et al.53 It can be seen from the table above that the oxygen evolution overpotential of Pb–Co3O4 inert anodes were obviously lower than other inert anodes. According to the experimental data of different types of inert anodes, the Pb–Co3O4 inert anodes showed better electrochemical performance than other inert anodes.
4. Conclusions
Pb–PbO2, Pb–Co3O4 and Pb–Co3O4–PbO2 composite inert anodes were prepared by vacuum hot pressing technique from the mixtures of lead powders, Co3O4 and PbO2 particles in a fixed mould, and the uniform distributions of Co3O4 and PbO2 particles in the composite inert anodes have been obtained.Increasing heating temperatures from 260 °C to 340 °C was favourable to the reduction of oxygen evolution potentials or overpotentials of Pb–Co3O4 composite inert anodes. Co3O4 particles improved the electrocatalytic activity obviously better than PbO2 particles in the zinc electrowinning simulated solution.
The corrosion resistance of Pb–Co3O4 composite inert anodes was enhanced with the rise of the heating temperatures from 260 °C to 340 °C. The simultaneous doping of Co3O4 and PbO2 particles in the lead matrix improved the corrosion resistance more obviously than the individual doping of Co3O4 or PbO2 particle.
The vacuum hot pressing technique solved the problem of lower dispersion uniformity for the composite inert anodes prepared by composite electrodeposition or traditional casting technique.
Conflicts of interest
There are no conflicts to declare.Acknowledgements
Authors gratefully acknowledge the financial supports of the Specialized Research Fund for the Doctoral Program of the Ministry of Education of China (Project No. 20125314110011); the Key Project of Yunnan Province Applied Basic Research Plan of China (Project No. 2014FA024); the National Natural Science Foundation of China (Project No. 51004056).References
- M. Bestetti, U. Ducati, G. H. Kelsall, G. Li and E. Guerra, Can. Metall. Q., 2013, 40, 451–458 CrossRef.
- R. D. Xu, L. P. Huang, J. F. Zhou, P. Zhan, Y. Y. Guan and Y. Kong, Hydrometallurgy, 2012, 125, 8–15 CrossRef.
- A. Felder and R. D. Prengaman, JOM, 2006, 58, 28–31 CrossRef CAS.
- H. T. Yang, H. R. Liu, Y. C. Zhang, B. M. Chen, Z. C. Guo and R. D. Xu, Int. J. Miner., Metall. Mater., 2013, 20, 986–993 CrossRef CAS.
- M. Petrova, Z. Noncheva, T. Dobrev, N. Kounchev, D. Petrov, V. Mihnev and D. Buttinelli, Hydrometallurgy, 1996, 40, 293–318 CrossRef CAS.
- R. H. Newnham, J. Appl. Electrochem., 1992, 22, 116–124 CrossRef CAS.
- S. W. He, R. D. Xu and G. Hu, RSC Adv., 2016, 6, 3362–3371 RSC.
- Y. C. Zhang, B. M. Chen, H. T. Yang and Z. C. Guo, Trans. Nonferrous Met. Soc. China, 2014, 21, 83–88 CAS.
- A. H. Ras and J. F. van Staden, J. Appl. Electrochem., 1999, 29, 313–319 CrossRef CAS.
- A. B. Velichenko, V. A. Knysh, T. V. Luk'yanenko, Y. A. Velichenko and D. Devilliers, Mater. Chem. Phys., 2012, 131, 686–693 CrossRef CAS.
- Y. Dan, H. Lu, X. Liu, H. Lin and J. Zhao, Int. J. Hydrogen Energy, 2011, 36, 1949–1954 CrossRef CAS.
- X. Li, X. Li, S. Tang, J. Yang, W. Li, B. Luo and S. Li, Appl. Surf. Sci., 2014, 311, 357–361 CrossRef CAS.
- N. E. Bagshaw, J. Power Sources, 1995, 53, 25–30 CrossRef CAS.
- R. D. Prengaman, J. Power Sources, 1997, 67, 267–278 CrossRef CAS.
- H. Okamoto, ASM International, 2000.
- S. Venugopalan, J. Power Sources, 1994, 48, 371–384 CrossRef CAS.
- B. Panda, S. C. Das and R. K. Panda, Hydrometallurgy, 2009, 95, 87–91 CrossRef CAS.
- E. Rocca and J. Steinmetz, Electrochim. Acta, 1999, 44, 4611–4618 CrossRef CAS.
- D. Velayutham and M. Noel, J. Appl. Electrochem., 1993, 23, 922–926 CrossRef CAS.
- A. Hrussanova, L. Mirkova and T. Dobrev, Hydrometallurgy, 2001, 60, 199–213 CrossRef CAS.
- S. K. Meher and G. R. Rao, J. Phys. Chem. C, 2011, 115, 15646–15654 CAS.
- Y. Liang, Y. Li, H. Wang, J. Zhou and J. Wang, Nat. Mater., 2011, 10, 780–786 CrossRef CAS PubMed.
- F. Tang, I. E. Anderson, T. Gnaupel-Herold and H. Prask, Mater. Sci. Eng. A, 2004, 383, 362–373 CrossRef.
- D. L. McDanels, Metall. Trans. A, 1985, 16, 1105–1115 CrossRef.
- R. J. Arsenault, L. Wang and C. R. Feng, Acta Metall. Mater., 1991, 39, 47–57 CrossRef CAS.
- Z. Tan, Z. Li and G. Fan, et al., Diam. Relat. Mater., 2013, 31, 1–5 CrossRef CAS.
- Z. Tan, Z. Li and G. Fan, et al., Compos. B Eng., 2013, 47, 173–180 CrossRef CAS.
- W. Shen, W. Shao and Q. Wang, et al., Fusion Eng. Des., 2010, 85, 2237–2240 CrossRef CAS.
- E. E. Abd El Aal, J. Power Sources, 1998, 75, 36–43 CrossRef CAS.
- V. Otieno-Alego, G. A. Hope, H. J. Flitt, G. A. Cash and D. P. Schweinsberg, Corros. Sci., 1992, 33, 1719–1734 CrossRef CAS.
- Y. Q. Lai, Y. Li, L. X. Jiang, W. Xu and X. J. Lv, J. Electroanal. Chem., 2012, 671, 16–23 CrossRef CAS.
- K. C. Neyerlin, W. Gu, J. Jorne and H. A. Gasteiger, J. Electrochem. Soc., 2007, 154, B631–B635 CrossRef CAS.
- J. Zhou, R. Xu and B. Chen, Adv. Sci. Lett., 2011, 4, 1225–1229 CrossRef CAS.
- I. Ivanov, Y. Stefanov, Z. Noncheva, M. Petrova and T. Dobrev, Hydrometallurgy, 2000, 57, 125–139 CrossRef CAS.
- Z. Y. Li, P. T. Bui, D. H. Kwak, M. S. Akhtar and O. B. Yang, Ceram. Int., 2016, 42, 1879–1885 CrossRef CAS.
- X. Wang, X. Y. Chen, L. S. Gao, H. G. Zheng, Z. D. Zhang and Y. T. Qian, J. Phys. Chem. B, 2004, 108, 16401–16404 CrossRef CAS.
- F. Wang, C. C. Lu, Y. F. Qin, C. C. Liang, M. S. Zhao, S. C. Yang, Z. B. Sun and X. P. Song, J. Power Sources, 2013, 235, 67–73 CrossRef CAS.
- V. H. Nguyen and J. J. Shim, Mater. Lett., 2015, 157, 290–294 CrossRef CAS.
- X. W. Wang, M. X. Li, Z. Chang, Y. Q. Yang, Y. P. Wu and Z. Liu, ACS Appl. Mater. Interfaces, 2015, 7, 2280–2285 CAS.
- Q. Zhang and Y. Hua, Acta Phys.–Chim. Sin., 2011, 27, 149–155 CrossRef CAS PubMed.
- K. Polat, M. L. Aksu and A. T. Pekel, J. Appl. Electrochem., 2002, 32, 217–223 CrossRef CAS.
- R. Wartena, J. Winnick and P. H. Pfromm, J. Appl. Electrochem., 2002, 32, 415–424 CrossRef CAS.
- H. Vogt, Electrochim. Acta, 1994, 39, 1981–1983 CrossRef CAS.
- K. W. Kim, E. H. Lee, J. S. Kim, K. H. Shin and K. H. Kim, Electrochim. Acta, 2002, 46, 915–921 CrossRef.
- M. Clancy, C. J. Bettles, A. Stuart and N. Birbilis, Hydrometallurgy, 2013, 131–132, 144–157 CrossRef CAS.
- K. V. Subramaniam and M. Bi, Corros. Sci., 2010, 52, 2725–2735 CrossRef CAS.
- R. A. Johns and D. A. Blackburn, Thin Solid Films, 1975, 25, 291–300 CrossRef CAS.
- G. F. Bolling and W. C. Winegard, Acta Metall., 1958, 6, 283–287 CrossRef CAS.
- J. H. P. Watson, Phys. Rev. B: Condens. Matter Mater. Phys., 1970, 2, 1282–1286 CrossRef.
- S. R. Mellsop, A. Gardiner and A. T. Marshall, Electrocatalysis, 2014, 5, 445–455 CrossRef CAS.
- J. Huang, Z. Li, B. Y. Liaw and J. Zhang, J. Power Sources, 2016, 309, 82–98 CrossRef CAS.
- R. D. Xu, L. P. Huang, J. F. Zhou, P. Zhan and Y. Y. Guan, Hydrometallurgy, 2012, 125, 8–15 CrossRef.
- S. He, R. Xu, J. Wang, S. Han and B. Chen, J. Wuhan Univ. Technol., 2016, 31, 811–817 CrossRef CAS.
| This journal is © The Royal Society of Chemistry 2017 |

