 Open Access Article
Origin of the efficient catalytic thermal decomposition of ammonium perchlorate over (2−1−10) facets of ZnO nanosheets: surface lattice oxygen†
Haitao Liab,
Kun Zhaoac,
Shouqin Tiand,
Dawen Zeng *ab,
Aimin Pange,
Xiaoxia Wanga and
Changsheng Xiea
aState Key Laboratory of Materials Processing and Die & Mould Technology, Nanomaterials and Smart Sensors Research Lab (NSSRL), Department of Materials Science and Engineering, Huazhong University of Science and Technology (HUST), No. 1037, Luoyu Road, Wuhan 430074, People's Republic of China. E-mail: dwzeng@mail.hust.edu.cn
bHubei Collaborative Innovation Center for Advanced Organic Chemical Materials, Hubei University, Wuhan 430062, People's Republic of China
cCollege of Chemical Engineering and Food Science, Hubei Key Laboratory of Low Dimensional Optoelectronic Materials and Devices, Hubei University of Arts and Science, Xiang Yang 441053, People's Republic of China
dState Key Laboratory of Silicate Materials for Architectures, Wuhan University of Technology, No. 122, Luoshi Road, Wuhan 430070, People's Republic of China
eHubei Institute of Aerospace Chemotechnology, Xiangyang 441003, Hubei, People's Republic of China
First published on 17th August 2017
Abstract
ZnO nanocrystals as catalysts have been widely employed in the catalytic thermal decomposition of ammonium perchlorate (AP). However, the catalytic mechanism is still controversial and the role of surface lattice oxygen is always ignored. Herein, a classical catalytic mechanism based on the surface lattice oxygen was proposed to reveal AP decomposition promoted by ZnO nanosheets. ZnO and ZnS nanosheets, both of which have the same wurtzite structure and the same (2−1−10) exposed facets, have been synthesized by the calcination of a ZnS(en)0.5 precursor in different conditions. ZnO nanosheets with a smaller surface area showed a better catalytic activity than ZnS nanosheets because the surface lattice oxygen of the ZnO nanosheets can react with NH3 (an intermediate of AP thermal decomposition) to generate oxygen vacancies that can subsequently be recovered, while the surface lattice sulfur of the ZnS nanosheets did not react with NH3. The generation and replenishment of oxygen vacancies on the (2−1−10) exposed facets of the ZnO nanosheets were confirmed by XPS and FTIR results, and thus revealed the origin of the efficient catalytic AP decomposition over (2−1−10) facets of ZnO nanosheets as surface lattice oxygen. Therefore, this work could provide a new insight into the catalytic mechanism of metal oxides to promote AP decomposition.
Introduction
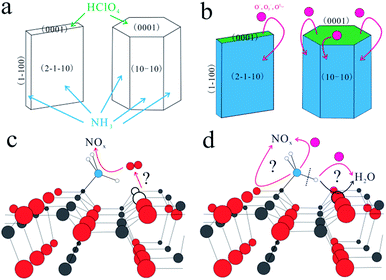
Ammonium perchlorate is a traditional oxidizer in composite solid propellant, and its thermal decomposition highly influences the combustion properties of rocket composite solid propellants.1,2 To enhance its thermal decomposition properties, various kinds of metal oxides, such as Fe2O3, CoO, Co3O4, CuO, NiO, and ZnO,3–12 have been used to catalyze its thermal decomposition. The catalytic mechanism has also been investigated and two assumptions are proposed. The first one is the formation of easily melting eutectics between metal oxides and AP because of the transition from the solid state into liquid.5 The other assumption is attributed to VO-related defects and the release of oxygen.8 However, the two assumptions lack solid and direct evidence, and thus it is difficult to further reveal the catalytic mechanism of metal oxides for AP decomposition. This is probably because that the surface atomic structure of metal oxides will play a critical role in the catalytic decomposition of AP. Therefore, it is of great significance to understand the catalytic mechanism of metal oxides in the AP decomposition from atomic insights.Among these metal oxides, ZnO is considered as one of the best single metal oxide catalyst and thus used indispensably in the photochemical industry and chemical industry, due to its excellent reactivity, non-toxicity and stability.8,10 In addition, the morphology and structures of ZnO can be tuned more easily by simple methods.13 In this sense, ZnO is the best model material to investigate the underlying relationship between its surface structure and its catalytic performance for AP decomposition. In our previous work, the ZnO nanosheets exposed with more (0001) facets exhibited a better catalytic property than other structures.13 Also, it is found that HClO4 gas (one intermediate of AP decomposition) is preferentially adsorbed on ZnO (0001) facets and NH3 gas (the other intermediate of AP decomposition) preferentially adsorbed on the non-polar facets,14–16 such as (2−1−10) and (10−10), with hydrogen bonds forming between H atoms and the adjacent O atoms as shown in Scheme 1(a). It is traditionally considered that NH3 gas is oxidized by the active oxygen anions17–21 which are diffused from the (0001) facets as shown in Scheme 1(b). However, the oxidation path of the adsorbed NH3 gas is still unclear. Here, two possible oxidation paths are proposed. On one hand, lattice oxygen and interstitial oxygen are possibly transformed to oxygen vacancies and release oxygen to oxidize NH3 as shown in Scheme 1(c). On the other hand, the N atom is adsorbed on the Zn atom and a H atom can form a hydrogen bond with an O atom.15 And a N–H bond can break to form –NH2.13,14,21 Thus, the released H atom will combine with adjacent lattice oxygen atoms or diffused active oxygen anions. That is shown in Scheme 1(d), and the remaining –NH2 bond is faced with the same situation. It can be seen obviously that the two paths are deeply related with surface lattice oxygen. Therefore, a reasonable mechanism (either classical or novel) based on the surface lattice oxygen will be proposed to further reveal the oxidation path of NH3.
Herein, a classical catalytic mechanism was employed to further reveal AP decomposition in the presence of ZnO nanosheets exposed with (2−1−10) facets. ZnO and ZnS nanosheets, both of which had the same wurtzite structure and exposed (2−1−10) facets, were prepared by calcinations of ZnS(en)0.5 precursor with different conditions.20–23 The obtained ZnO nanosheets showed a better catalytic performance than the ZnS nanosheets in the AP decomposition. This indicates that the surface lattice oxygen on ZnO (2−1−10) facets plays a positive role in the catalyst, while the surface lattice sulfur on ZnS (2−1−10) facets cannot do the same. NH3 could be possibly oxidized by the surface lattice oxygen. To prove this view, ZnO and ZnS nanosheets were reacted with NH3 on the same condition that they were used to promote AP decomposition. The concentration of surface lattice oxygen on ZnO (2−1−10) facets was highly decreased, while that of surface lattice sulfur was almost unchanged. Oxygen vacancies were formed due to the reaction and consumption of surface lattice oxygen. But after AP decomposition catalyzed by ZnO, the concentration of the surface lattice oxygen on ZnO was recovered to a normal extent, indicating that the formed oxygen vacancies were replenished subsequently. In this sense, NH3 oxidation by surface lattice oxygen is another path of NH3 oxidation during the catalytic decomposition of AP, compared to the NH3 oxidation by active oxygen anions. This work shows a great significance in the introduction of a catalytic mechanism based on the surface lattice oxygen into the field of the catalytic decomposition of AP.
Experimental
Preparation
ZnS and ZnO nanosheets were prepared by heat treatment of the precursor ZnS(en)0.5. To prepare the ZnS(en)0.5 precursor, ZnCl2 (2.5 mmol, 0.34 g), NH2CSNH2 (5 mmol, 0.38 g), and ethylenediamine (75 mL) were added to a commercial Teflon-lined autoclave with a capacity of 100 mL. Then it was put into an oven at 180 °C for 12 h. When this solvothermal reaction finished, it was cool down to room temperature naturally. The product was filtered, washed with deionized water and ethanol, and dried overnight in an oven at 80 °C. This ZnS(en)0.5 precursor was calcinated at 400 °C in air atmosphere for 2 h to obtain ZnS nanosheets and at 550 °C in air atmosphere for 1 h to obtain ZnO nanosheets.Characterization
The phase identification was carried out on an X-ray diffractometer (X'pert PRO; PANalytical B.V.) using Cu Kα1 radiation in the range from 20° to 80°. The morphologies of samples were observed using a field emission scanning electron microscope (FSEM, FEI Sirion 200). Transmission electron microscopy (TEM) and high resolution transmission electron microscopy (HRTEM) were performed on a Tecnai G2F20 U-TWIN microscope operated at 200 kV. The specific surface area and the pore size were determined from N2 adsorption–desorption isotherms at 77 K, obtained using a BRLSORP analyzer. The specific surface area was calculated from the multipoint adsorption data within the linear segment of the N2 adsorption isotherms, using Brunauer–Emmett–Teller theory. The pore size distribution was determined from the isotherms by using nonlocal density functional theory. The surface compositions and the chemical state were examined by X-ray photoelectron spectroscopy (XPS, VG Multilab 2000X).Catalytic activity
Their catalytic activities for thermal decomposition of AP (AR, d50: 140 μm) were characterized by thermogravimetry-differential thermal analysis (TG-DTA) tests using Diamond TG/DTA test at various heating rates from 2 K min−1 to 20 K min−1 in N2 atmosphere over the temperature range of 30–500 °C. The final products of AP thermal decomposition with and without ZnS and ZnO catalysts were characterized by thermogravimetry-infrared spectra-mass spectra (TG-IR-MS) tests using PerkinElmer TGA-FTIR-GCMS at 20 K min−1. ZnO and ZnS nanosheets were heating at NH3 atmosphere with 10 mL min−1 in the flow rate from room temperature to 500 °C with heating rate of 10 K min−1, respectively.Results and discussion
Structure and morphology
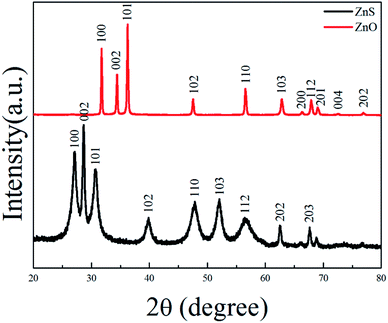
ZnS(en)0.5 is orthorhombic structure with Zn atoms tetrahedrally coordinated by three sulfurs and one nitrogen of the ethylenediamine (en) molecule24 as shown in its XRD pattern in Fig. S1.† Fig. 1 shows the XRD patterns of ZnS and ZnO nanosheets. All the diffraction peaks of ZnS belonged to hexagonal wurtzite ZnS (JCPDS card no. 36-1450), indicating that the product obtained at 400 °C was pure ZnS. All the diffraction peaks of ZnO were indexed as hexagonal ZnO (JCPDS card no. 36-1451), indicating that the product obtained at 550 °C was pure ZnO. This result was in good agreement with the previous work.20–23Fig. 2 shows the SEM images, TEM images, HRTEM images and SAED patterns of ZnS and ZnO nanosheets, respectively. They were similar size about 0.1 × 1 × 2 μm like ZnS(en)0.5 precursor (as shown in Fig. S2†) with a little porous for ZnS and highly porous for ZnO. The facet spacing of 0.31 nm in Fig. 2(c) was the (001) facet of wurtzite ZnS, and that of 0.26 nm in Fig. 2(d) was the (001) facet of wurtzite ZnO. And their SAED patterns show their diffraction spots both were (010) and (002) facets. These results indicated that the facets perpendicular to the incident direction of electrons were (100) i.e. (2−1−10) facets as shown in Fig. 2(d) and (h), and this facet relationship had been demonstrated in the previous work.25 Obviously, these (2−1−10) facets were the exposed facets which were facing us in Fig. 2(a), (b), (e) and (f). Therefore, these ZnO and ZnS nanosheets showed the same exposed (2−1−10) facet, which agreed well with the previous work.20
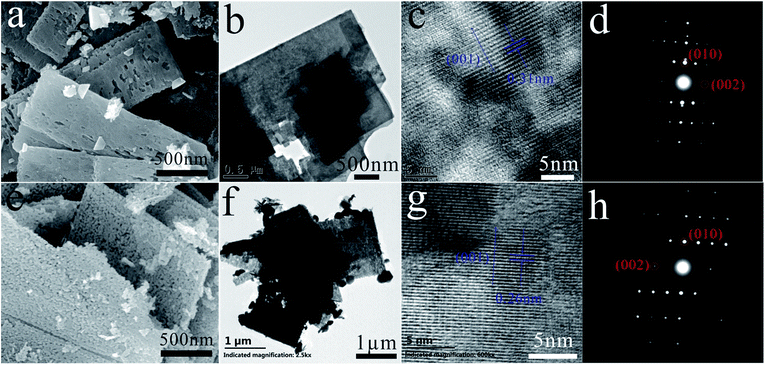 | ||
| Fig. 2 (a) SEM, (b) TEM, (c) HRTEM images and (d) SAED pattern of ZnS; (e) SEM, (f) TEM, (g) HRTEM images and (h) SAED pattern of ZnO. | ||
To further investigate the porous structures of ZnO and ZnS nanosheets, BET method was employed and the results are shown in Fig. 3. The N2 adsorption–desorption isotherms were displayed in Fig. 3(a), indicating that the BET surface areas of ZnO and ZnS nanosheets were 8.1 and 43.7 m2 g−1, respectively. It can be seen that ZnS nanosheets exhibited a larger surface area than ZnO nanosheets. In addition, ZnO nanosheets presented a wider pore size distribution and a larger average pore size than ZnS nanosheets in Fig. 3(b).
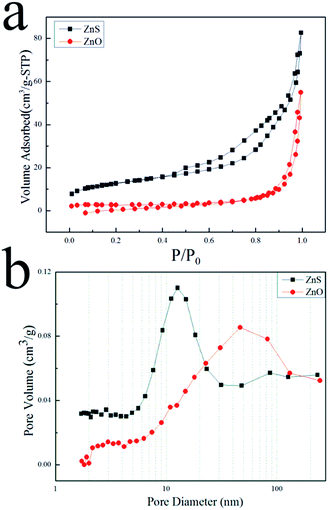 | ||
| Fig. 3 (a) N2 adsorption–desorption isotherms and (b) pore size distributions for ZnS (■) and ZnO (●). | ||
Catalytic activities
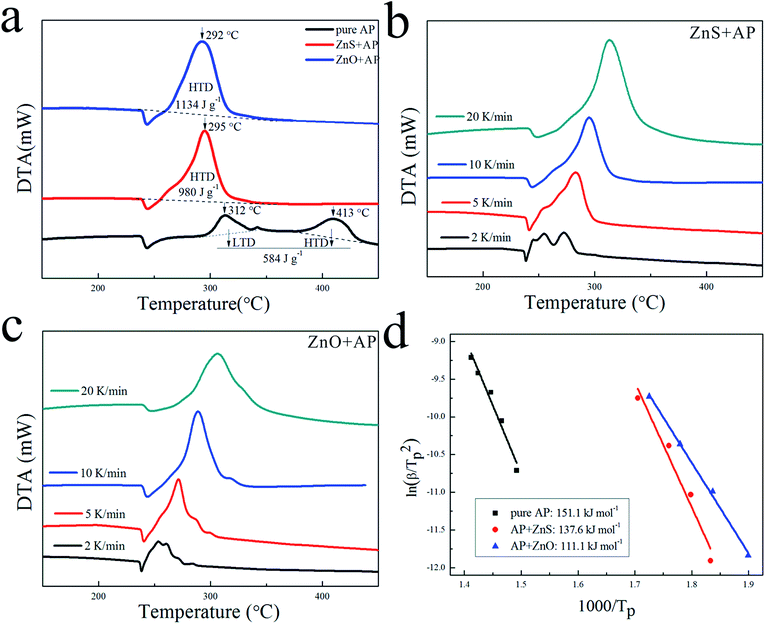
Due to their porous structures and large surface areas, ZnO and ZnS nanosheets were employed as catalysts to promote AP decomposition and investigated in parallel. Fig. 4(a) shows DTA curves of pure AP and AP with ZnS or ZnO nanosheets in mass ratio 4% at a heating rate of 10 K min−1. They dramatically decreased HTD of pure AP from 413 °C to 295 °C and 292 °C, and increased the heat release of pure AP from 584 J g−1 to 980 J g−1 and 1134 J g−1, respectively. To investigate their kinetic process for AP decomposition, AP with ZnS or ZnO nanosheets were characterized by DTA measurement at different heating rates from 2 to 20 K min−1 as shown in Fig. 4(b) and (c), respectively. The decomposition temperatures of AP with the catalysts were increased slightly with increasing the heat rate. Their catalytic energy activations (Ea) were calculated by Kissinger correlation18,19 as follows:| ln(β/Tp2) = ln(AR/Ea) − Ea/RTp. | (1) |
In this correlation, β was the heating rate, Tp was the peak decomposition temperature, R was the ideal gas constant, Ea was the activation energy, and A is the pre-exponential factor. ln(β/Tp2) varied linearly with 1/Tp, and yielded the kinetic parameters of activation energy from the slope of the straight line and of pre-exponential factor from the intercept. As shown in Fig. 4(d), the Ea of AP decomposition was reduced from 151.1 kJ mol−1 to 137.6 kJ mol−1 with ZnS and 111.1 kJ mol−1 with ZnO, respectively. Their N-containing gaseous products, which were discussed in the ESI,† also reflected the differences in their catalytic properties.
Based on the above results, their specific catalytic activities are summarized in Table 1. ΔsT, ΔsH and ΔsEa denote their HTD temperature decreases, heat release increases and activation energy decreases per unit of surface area of catalyst, respectively.26 Obviously, ZnO nanosheets showed a better specific catalytic activity than ZnS nanosheets. It can be seen that the surface area cannot play a critical role in the catalytic activities because that ZnS nanosheets exhibited a larger surface area but a poorer catalytic performance. This was probably related with their other different structures. The obvious difference between ZnO nanosheets and ZnS nanosheets was the surface atoms which can put important effects on the catalytic properties. Thus, the difference of their catalytic activities was probably caused by their different surface atoms (the surface lattice oxygen existed in ZnO nanosheets while the surface lattice sulfur existed in ZnS nanosheets). More experiments were needed to investigate this issue.
| ZnO | ZnS | |
|---|---|---|
| Surface area (m2 g−1) | 8.1 | 43.7 |
| ΔsT (K m−1) | 14.94 | 2.70 |
| ΔsH (J g−1 m−1) | 67.90 | 9.06 |
| ΔsEa (kJ mol−1 m−1) | 4.94 | 0.31 |
Catalytic mechanism based on the surface lattice oxygen
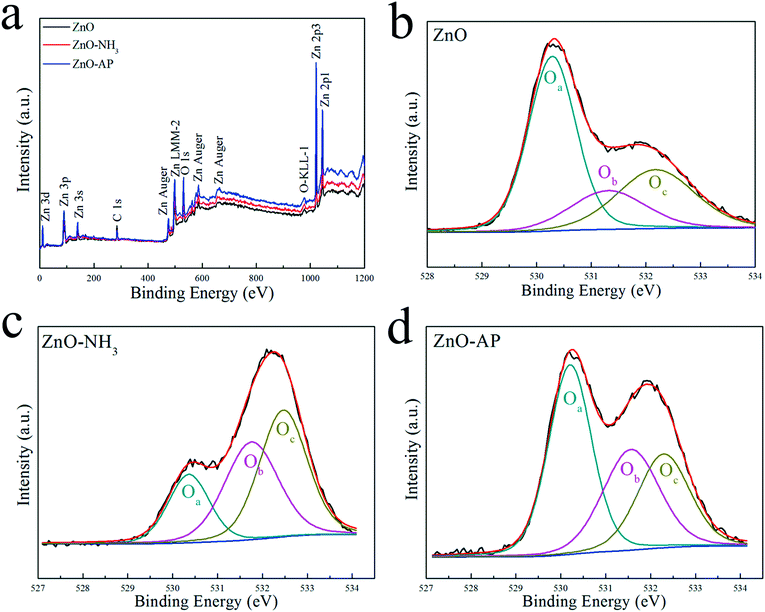
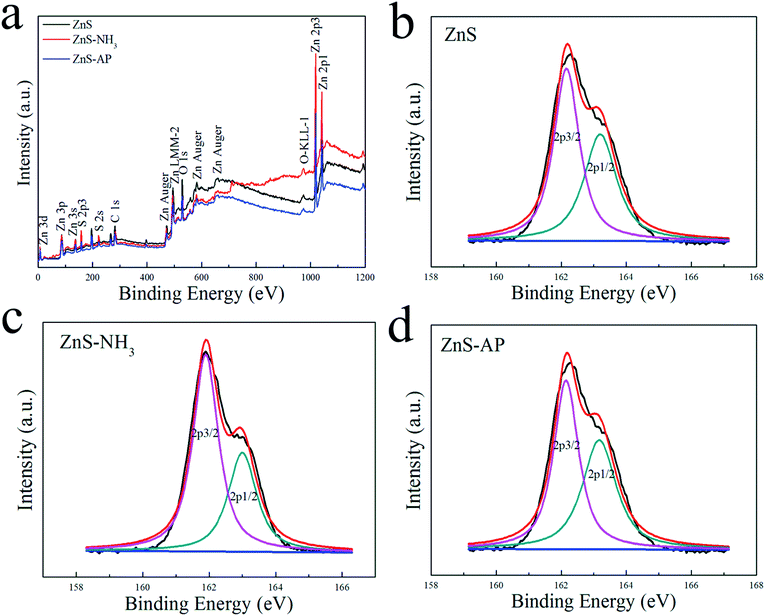
It is well known that AP was decomposed into HClO4 and NH3 in the first stage. In the presence of catalyst, HClO4 and NH3 can be adsorbed on the surface of catalyst and then be decomposed completely, thus promoting AP decomposition at lower temperatures. However, the underlying catalytic mechanism cannot be revealed clearly. Possibly, NH3 can be oxidized completely by the active oxygen species which can be produced from the adsorbed HClO4 on the surface of metal oxide nanoparticles. However, the adsorbed NH3 can also be oxidized directly by the active surface lattice oxygen atoms of catalysts. The oxygen vacancies resulted from the consumed surface lattice oxygen atoms can be refilled by the adsorbed HClO4. In this work, the surface lattice oxygen atoms on (2−1−10) facets of ZnO nanosheets could oxidize adsorbed NH3 in AP thermal decomposition. Generally, the adsorbed NH3 will be oxidized to form NOx and H2O products.13,17–19,27 Therefore, the experiments were designed to simulate the process of NH3 oxidation on the surface of ZnO nanosheets as follows. ZnO and ZnS nanosheets were heated at NH3 atmosphere with a flow rate of 10 mL min−1 from room temperature to 500 °C with heating rate of 10 K min−1, respectively. After heating, ZnO and ZnS nanosheets were noted as ZnO–NH3 and ZnS–NH3, respectively. After catalyzing AP decomposition, ZnO and ZnS nanosheets were noted as ZnO–AP and ZnS–AP, respectively.To investigate the surface structures of ZnO and ZnS nanosheets after the oxidization of NH3 and decomposition of AP, XPS method was employed. Fig. 5 and 6 shows their XPS results. As shown in Fig. 5, the peak of surface lattice oxygen (Olattice noted as Oa) was at 530 eV, the peak at 531.4 eV was associated with the O2− ions in the oxygen-deficient regions within the ZnO matrix (noted as Ob), and the peak at 532.3 eV was usually attributed to chemisorbed oxygen on the surface of the ZnO, such as –CO3, adsorbed H2O or adsorbed O2 (noted as Oc).28 And as shown in Fig. 6, the peak of Slattice can be divided in two peaks, S 2p3/2 at 162.2 eV and S 2p1/2 at 163.4 eV.29 Their atomic concentrations of Zn, Olattice and Slattice were listed in Table 2. The Zn/Olattice ratio of ZnO–NH3 was as high as 4.31, which indicated a lot of surface lattice oxygens indeed were consumed to oxidize the NH3 as our assumption, leading to the formation of abundant surface oxygen vacancies. Whether these oxygen vacancies can exist until the total catalytic reaction or not? The Zn/Olattice ratio of ZnO–AP was 1.39 which is close to that of ZnO before reaction (1.38). This result indicated that the formed oxygen vacancies were replenished to be surface lattice oxygen and ZnO (2−1−10) facets were recovered. As a comparison, Zn/Slattice ratios of ZnS nanosheets were almost unchanged during the whole catalytic reaction. These results solidly suggested that the surface lattice oxygens on ZnO (2−1−10) facets can oxidize NH3 to form oxygen vacancies and then they were replenished subsequently.
| Concentration | Zn | Olattice | Slattice | Zn/Olattice (Slattice) |
|---|---|---|---|---|
| ZnO | 57.92% | 42.08% | N/A | 1.38 |
| ZnO–NH3 | 81.16% | 18.84% | N/A | 4.31 |
| ZnO–AP | 58.16% | 41.84% | N/A | 1.39 |
| ZnS | 59.39% | N/A | 40.61% | 1.46 |
| ZnS–NH3 | 59.53% | N/A | 40.47% | 1.47 |
| ZnS–AP | 58.95% | N/A | 41.05% | 1.44 |
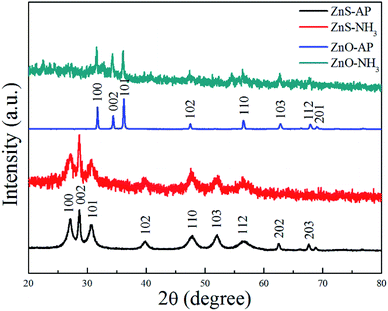
To further confirm the generation of oxygen vacancies on the ZnO (2−1−10) facets, ZnO and ZnS nanosheets were used to catalyze NH3 or AP, respectively, and then subjected to the XRD characterization. The results were shown in Fig. 7. Obviously, it can be seen that the phase structure of ZnO and ZnS nanosheets cannot be changed, indicating that ZnO and ZnS nanosheets can be used as catalyst to promote AP decomposition and NH3 oxidation. Interestingly, ZnO and ZnS nanosheets after NH3 oxidation exhibited wider and lower diffraction peaks in the XRD patterns than that after AP decomposition. The change was more obvious for ZnO nanosheets. The wide and low diffraction peak usually means a lower crystallinity, also indicating that more surface defects existed on the nanocrystals.30–33 In this sense, ZnO nanosheets after NH3 oxidation showed more surface defects than that after AP decomposition and the surface defect here is probably oxygen vacancy. The result is in good agreement with the above XPS results.
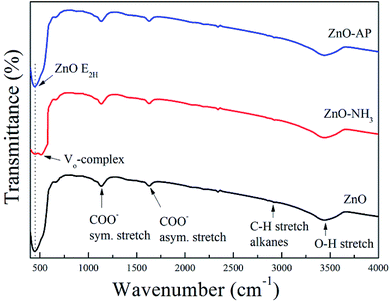
FTIR spectra of ZnO, ZnO–NH3 and ZnO–AP are shown in Fig. 8, in order to identify the generation of oxygen vacancies on the ZnO (2−1−10) facets further more. According to the previous work,34,35 there were several peaks in all the samples including the peaks at 437 cm−1 associated to the E2 mode of hexagonal ZnO (Raman active), the peaks at 1630 and 1384 cm−1 due to the asymmetrical and symmetrical stretching of the zinc carboxylate, peaks between 2830 and 3000 cm−1 due to C–H stretching vibration of alkane groups, a broad band at 3500 cm−1 assigned to the O–H stretching mode of hydroxyl group. There was only one special peak in ZnO–NH3 sample at 505 cm−1 associated with oxygen deficiency and/or oxygen vacancy (VO) defect complex in ZnO.34,35 This was another evidence for the generation of oxygen vacancies on the ZnO (2−1−10) facets.
Conclusions
A catalytic mechanism based on the surface lattice oxygen revealed a ZnO catalyst to promote AP thermal decomposition in this work. Herein, ZnO and ZnS nanosheets with the same wurtzite structure and exposed (2−1−10) facets were employed as catalysts to promote AP decomposition. ZnO nanosheets exhibited a better catalytic activity to promote AP decomposition than ZnS nanosheets because the surface lattice oxygen of ZnO (2−1−10) facets would oxidize NH3 gas while the surface lattice sulfur would not. After the oxidation of NH3 by the surface lattice oxygen, oxygen vacancies were produced on the ZnO (2−1−10) facets, which can be characterized by XPS results. Interestingly, these oxygen vacancies were replenished subsequently if ZnO was used to catalyze the decomposition of AP. This was confirmed by the FTIR results of ZnO nanosheets after the oxidation of NH3 and promoting AP decomposition. Therefore, this work provided a significant insight into the catalytic mechanism of metal oxides to promote AP decomposition.Conflicts of interest
There are no conflicts to declare.Acknowledgements
This work was supported by the Nature Science Foundation of China (No. 51572075). Authors also thanked the technology support including XRD, SEM and TEM carried out by the Analytic Testing Centre of HUST, and BET, TG-DTA and TG-IR-MS carried out by Material Analysis Lab C307 of State Key Laboratory of Materials Processing and Die & Mould Technology.Notes and references
- S. Chaturvedi and P. N. Dave, J. Saudi Chem. Soc., 2013, 17, 135–149 CrossRef CAS.
- V. V. Boldyrev, Thermochim. Acta, 2006, 443, 1–36 CrossRef CAS.
- L.-N. Jin, Q. Liu and W.-Y. Sun, CrystEngComm, 2012, 14, 7721 RSC.
- L.-J. Chen, G.-S. Li, P. Qi and L.-P. Li, J. Therm. Anal. Calorim., 2008, 92, 765 CrossRef CAS.
- L. Li, X. Sun, X. Qiu, J. Xu and G. Li, Inorg. Chem., 2008, 47, 8839–8846 CrossRef CAS PubMed.
- Z. Ma, F. Li and H. Bai, Propellants, Explos., Pyrotech., 2006, 31, 447 CrossRef CAS.
- D. L. Reid, A. E. Russo, R. V. Carro, M. A. Stephens, A. R. LePage, T. C. Spalding, E. L. Petersen and S. Seal, Nano Lett., 2007, 7, 2157–2161 CrossRef CAS.
- X. Sun, X. Qiu, L. Li and G. Li, Inorg. Chem., 2008, 47, 4146–4152 CrossRef CAS PubMed.
- Y. Wang, J. Zhu, X. Yang, L. Lu and X. Wang, Thermochim. Acta, 2005, 437, 106 CrossRef CAS.
- J. Yin, Q. Lu, Z. Yu, J. Wang, H. Pang and F. Gao, Cryst. Growth Des., 2010, 10, 40–43 CAS.
- Y. Zhang, X. Liu, J. Nie, L. Yu, Y. Zhong and C. Huang, J. Solid State Chem., 2011, 184, 387 CrossRef CAS.
- J. Zhu, G. Zeng, F. Nie, X. Xu, S. Chen, Q. Han and X. Wang, Nanoscale, 2010, 2, 988–994 RSC.
- G. Tang, S. Tian, Z. Zhou, Y. Wen, A. Pang, Y. Zhang, D. Zeng, H. Li, B. Shan and C. Xie, J. Phys. Chem. C, 2014, 118, 11833–11841 CAS.
- T. Hasegawa, Y. Shirotori, K. Ozawa, K. Edamoto and K. Takahashi, Appl. Surf. Sci., 2004, 237, 352–357 CrossRef CAS.
- K. Ozawa, T. Hasegawa, K. Edamoto, K. Takahashi and M. Kamada, J. Phys. Chem. B, 2002, 106, 9380–9386 CrossRef CAS.
- K. Ozawa and K. Edamoto, Surf. Rev. Lett., 2002, 9, 717–722 CrossRef CAS.
- Y. Yan, Q. Liu, J. Wang, L. Ji, X. Jing, R. Li and L. Liu, Powder Technol., 2012, 232, 134–140 CrossRef CAS.
- G. Tang, Y. Wen, A. Pang, D. Zeng, Y. Zhang, S. Tian, B. Shan and C. Xie, CrystEngComm, 2014, 16, 570–574 RSC.
- S. Tian, N. Li, D. Zeng, H. Li, G. Tang, A. Pang, C. Xie and X. Zhao, CrystEngComm, 2015, 17, 8689–8696 RSC.
- J. Jang, C. Yu, S. Choi, S. Ji, E. Kim and J. Lee, J. Catal., 2008, 254, 144–155 CrossRef CAS.
- J. Liu, Z. Guo, F. Meng, T. Luo, M. Li and J. Liu, Nanotechnology, 2009, 20, 125501 CrossRef PubMed.
- L. Nasi, D. Calestani, T. Besagni, P. Ferro, F. Fabbri, F. Licci and R. Mosca, J. Phys. Chem. C, 2012, 116, 6960–6965 CAS.
- Y. Ni, X. Cao, G. Hu, Z. Yang, X. Wei, Y. Chen and J. Xu, Cryst. Growth Des., 2007, 7, 280–285 CAS.
- X. Ouyang, T.-Y. Tsai, D.-H. Chen, Q.-J. Huang, W.-H. Cheng and A. Clearfield, Chem. Commun., 2003, 886–887 RSC.
- S. Cho, J.-W. Jang, J. S. Lee and K.-H. Lee, Langmuir, 2010, 26, 14255–14262 CrossRef CAS PubMed.
- L. Ren, Y. Li, J. Hou, X. Zhao and C. Pan, ACS Appl. Mater. Interfaces, 2014, 6, 1608–1615 CAS.
- Z.-u.-d. Babar and A. Q. Malik, Combust. Sci. Technol., 2015, 187, 1295–1315 CrossRef CAS.
- Q. Zhu, C. Xie, H. Li, C. Yang, S. Zhang and D. Zeng, J. Mater. Chem. C, 2014, 2, 4566–4580 RSC.
- N. Huo, Y. Li, J. Kang, R. Li, Q. Xia and J. Li, Appl. Phys. Lett., 2014, 104, 202406 CrossRef.
- Z. Zhang, C. Bao, S. Ma and S. Hou, Appl. Surf. Sci., 2011, 257, 7893–7899 CrossRef CAS.
- J. C. Hughes, R. J. Gilkes and R. D. Hart, Appl. Clay Sci., 2009, 45, 24–35 CrossRef CAS.
- J. H. Ma, X. J. Meng, J. L. Sun, T. Lin, F. W. Shi, G. S. Wang and J. H. Chu, Appl. Surf. Sci., 2005, 240, 275–279 CrossRef CAS.
- W.-T. Jiang, D. R. Peacor, P. Arlai, M. Toth and J. W. Kim, J. Metamorph. Geol., 1997, 15, 267–281 CrossRef CAS.
- L. Li, X. Liu, S. Zhou, S. Liu and D. Jia, Chin. J. Inorg. Chem., 2016, 32, 241–249 CAS.
- G. Xiong, U. Pal, J. G. Serrano, K. B. Ucer and R. T. Williams, Phys. Status Solidi C, 2006, 3, 3577–3581 CrossRef CAS.
Footnote |
| † Electronic supplementary information (ESI) available. See DOI: 10.1039/c7ra07906k |
| This journal is © The Royal Society of Chemistry 2017 |

