 Open Access Article
Creative Commons Attribution 3.0 Unported Licence
Luminescence properties and energy transfer behavior of colour-tunable white-emitting Sr4Al14O25 phosphors with co-doping of Eu2+, Eu3+ and Mn4+
Ziyao Wang,
Xifeng Hou*,
Yangai Liu *,
Zhuang Hui,
Zhaohui Huang
 ,
Minghao Fang and
Xiaowen Wu
Beijing Key Laboratory of Materials Utilization of Nonmetallic Minerals and Solid Wastes, National Laboratory of Mineral Materials, School of Materials Science and Technology, China University of Geosciences, Beijing 100083, P. R. China. E-mail: liuyang@cugb.edu.cn; houxifeng3204114@126.com; Fax: +86-10-82322186; Tel: +86-10-82322186
First published on 15th November 2017
Abstract
Eu2+, Eu3+ and Mn4+ co-doped Sr4Al14O25 phosphors were synthesized in air by high temperature solid-state reaction. The coexistence of Eu2+, Eu3+ and Mn4+ in Sr4Al14O25 was detected and verified from X-ray photoelectron spectra (XPS), photoluminescence (PL)/photoluminescence excitation (PLE) spectra and diffuse reflection spectra. The crystal structure, luminescence properties and energy transfer between Eu2+ and Mn4+ were investigated scientifically. Under ultraviolet excitation, a broad emission band with peak at 496 nm was ascribed to a 4f65d–4f7 transition of Eu2+, and another five narrow emission bands were attributed to 4f–4f transitions of Eu3+. The sharp emission band with peak at 659 nm was generated from the spin-forbidden electronic transition 2Eg–4T2 of Mn4+. The energy transfer between Eu2+ and Mn4+ was demonstrated following the nonradiative electric dipole–dipole interaction, and the energy transfer efficiency reached 58.16%. The emission colour of Sr4Al14O25:Eu,Mn4+ can be tuned from blue-green (0.2396, 0.3332) to white (0.3465, 0.2906) with increasing concentrations of Mn4+.
1 Introduction
With the ever-increasing demands of humankind for illumination quality, white light-emitting diodes (WLEDs) are replacing the incandescent and fluorescent lamps gradually and becoming a new generation of solid state lighting sources for buildings and scenery lighting, LCD backlighting, interior lighting, automobiles, agriculture, medicine and aerospace.1–4 At present, the commercial method to generate white light emission is exciting the yellow-emitting Y3Al5O12:Ce3+ (YAG:Ce3+) with an InGaN light-emitting diode (LED) chip which emits blue light with the wavelength between 450 nm and 480 nm typically.5,6 Because of the emission deficiency in the red region, this WLED shows poor colour rendering and appears a simple cool white. Another feasible method is combining blue, green and red phosphors with a near-ultraviolet (n-UV) chip which emits ultraviolet with the wavelength between 380 nm and 420 nm.7–9 This combination improves the colour rendering performance, but poor chemical stability will be shown as it ages due to the different chemical properties of the three phosphors. Compared with other approaches, studies on the preparation of direct-white-emitting light phosphors have been carried out due to their excellent thermal stability and colour rendering properties.To the best of our knowledge, aluminate has becoming an important host material because of its excellent thermostability, non-poisonous and competitive price.10–13 Peng14 firstly found the coexistence of Eu2+ and Eu3+ in Sr4Al14O25 prepared in air. Two broad bands peaking at 400 nm and 490 nm attributed to the 4f–5d transition of Eu2+, and line emissions in the region of 550–700 nm belong to the f–f transitions of Eu3+. Xu15 reported the non-RE activated Sr4Al14O25:Mn4+ phosphor prepared by solid-state method in air. The Al3+ ions in the [AlO6] octahedral sites of Sr4Al14O25 were substituted by Mn4+ ions in the crystal lattice, and the emission spectrum measurement excited by 365 nm showed that the sharp emission peak at 651 nm was ascribed to the 2E–4A2 transition of Mn4+ ion, and a broad band at 662 nm was attributed to the phonon sideband transition. Based on the above experimental results, the authors believe that there should be an energy transfer between Eu2+ and Mn4+ in Sr4Al14O25. Meanwhile, there has been no one, by far, reporting its luminescence properties and potential applications. The previous studies provide the access to obtain direct white emission for WLED by the coexistence of Eu2+, Eu3+ and Mn4+ in Sr4Al14O25.
In our work, a series of Sr4Al14O25:xEu,Mn4+ phosphors were synthesized in air through the high temperature solid-state reaction. The coexistence of Eu2+, Eu3+ and Mn4+ was revealed by X-ray photoelectron spectroscopy (XPS), diffuse reflection spectra and photoluminescence (PL) spectra. The influences of Mn4+ on the luminescence properties were discussed in detail, and the fluorescence lifetime, energy transfer between Eu2+ and Mn4+ and applications in WLED were studied respectively.
2 Experimental
Series of Eu3+ ions single-doped Sr4Al14O25:xEu (x = 0.005, 0.01, 0.02, 0.04, 0.06, 0.08) and co-doped Sr4Al14O25:0.01Eu,yMn4+ (y = 0.0002, 0.0005, 0.001, 0.002, 0.003, 0.005, 0.01, 0.02) were synthesized by conventional solid-state reaction in air with SrCO3(A.R.), Al(OH)3(A.R.), MnCO3(A.R.), H3BO3(A.R.) and Eu2O3(4N). The stoichiometric amount of raw materials were well homogenized in an agate mortar, and the H3BO3 was added as a flux. All samples were pre-sintered in alumina crucibles in air at 700 °C for 2 h, and further heat-treated at 1400 °C for 5 h with sufficient grindings in the processes.The phase purity of synthesized phosphors were checked by X-ray diffraction (XRD) with a D8 Advance diffractometer with Cu Kα radiation (λ = 1.5406 Å) by the step of 4° min−1 at room temperature. The X-ray photoelectron spectroscopy (XPS) was obtained on an ESCALAB 250xi (ThermoFisher, England) electron spectrometer. The emission and excitation spectra were analyzed on a Hitachi F-4600 fluorescence spectrophotometer with a 400 nm cut-off filter. The diffuse reflection spectra were detected by a Shimadzu UV-3600 UV-vis-NIR spectrophotometer attached with an integral sphere. The photoluminescence decay curves were recorded on a Horiba JOBIN YVON FL3-21 spectrofluorometer.
3 Results and discussion
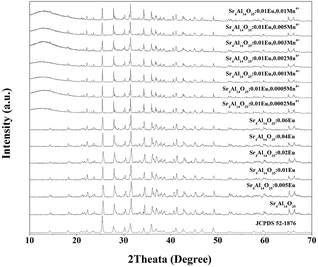
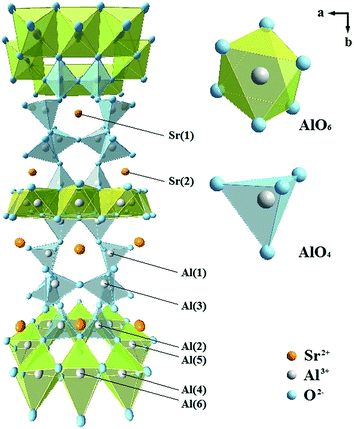
Fig. 1 shows the XRD patterns of Sr4Al14O25:xEu (x = 0, 0.005, 0.01, 0.02, 0.04, 0.06) and Sr4Al14O25:0.01Eu,yMn4+ (y = 0.0002, 0.0005, 0.001, 0.002, 0.003, 0.005, 0.01) synthesized at 1400 °C for 5 h in air. The reference pattern of the standard JCPDS Card no. 52-1876 for Sr4Al14O25 was also listed in Fig. 1 as a reference. It is observed that the samples synthesized in various conditions are all in pure Sr4Al14O25 phase, and the change of doping of Eu3+ and Mn4+ ions would not impact the host structure.It has been found that the Mn4+ ion is more likely to achieve stability once it is accommodated and stabilized in an octahedral site. Usually, there will be strong absorption and emission spanning from 250 nm to 500 nm and 630 nm to 735 nm respectively when Mn4+ substitutes an octahedral site.16,17 The fragments of Sr4Al14O25 unit cell are exhibited in Fig. 2. Sr4Al14O25 is orthorhombic structure with space group Pmma. The structure contains two Sr sites and six Al sites. Sr(1) and Sr(2) are both coordinated by ten oxygen atoms. Al(1), Al(2) and Al(3) form tetrahedrons with four coordinations, while Al(4), Al(5) and Al(6) are six-coordinated that form rigid octahedrons.18 Because the radius difference between Eu2+ and Sr2+ ions is much smaller than that of Eu2+ and Al3+, and the ionic size of Mn4+ is much smaller than that of Sr2+ but close to Al3+, it is reasonable to consider the Eu2+ ions are substituted in Sr2+ sites, while Mn4+ ions tend to occupy the octahedral sites of Al3+.
Fig. 3 shows the observed (black squares), calculated (red lines), and difference (bottom) XRD profiles for the Rietveld refinement of Sr3.96Al13.9972O25:0.04Eu2+,0.0028Mn2+ with λ = 1.5406 Å by TOPAS program. Almost all peaks can be indexed by hexagonal cell with parameters close to Sr4Al14O25, herein the structural parameters of Sr4Al14O25 are used as initial parameters in the Rietveld analysis. The final refinement is stable and convergent well with low residual factors Rexp = 6.281%, Rwp = 17.843%, Rp = 13.770% and χ2 = 2.841, indicating the single phase with no unidentified diffraction peaks from impurity. The final refined crystallographic data are listed in Table 1. The cell parameters are determined to be a = 24.7177 Å, b = 8.4810 Å, c = 4.8847 Å and V = 1026.22 Å3. The crystallographic site coordinates, occupancy factors, and equivalent isotropic displacement parameters are summarized in Table 2.
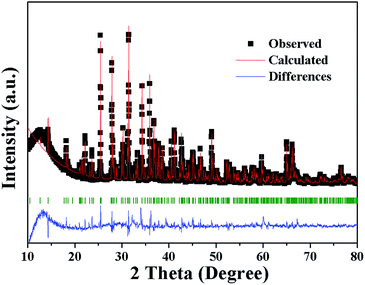 | ||
| Fig. 3 Power XRD pattern of Sr3.96Al13.9972O25:0.04Eu2+,0.0028Mn2+ with corresponding Rietveld refinement (red) and residuals (blue). | ||
| Sp.Gr. | Pmma |
| a, Å | 24.7177 (8) |
| B, Å | 8.4810 (3) |
| c, Å | 4.8847 (2) |
| V, Å3 | 1026.22 (6) |
| 2θ-interval, ° | 10–80 |
| No. of reflections | 313 |
| No. of refined parameters | 47 |
| Rwp, % | 17.843 |
| Rp, % | 13.770 |
| Rexp, % | 6.281 |
| χ2 | 2.841 |
| RB, % | 4.593 |
| Sr3.96Al13.9972O25:0.04Eu2+,0.0028Mn2+ | |||||
|---|---|---|---|---|---|
| x | y | z | Biso | Occ. | |
| Sr1 | 0.1387 | 1/2 | 0.0355 | 2.98 | 0.99 |
| Eu1 | 0.1387 | 1/2 | 0.0355 | 2.98 | 0.01 |
| Sr2 | 0.1204 | 0 | 0.1143 | 1.16 | 0.99 |
| Eu2 | 0.1204 | 0 | 0.1143 | 1.16 | 0.01 |
| Al1 | 0.1851 | 0.1956 | 0.6284 | 3.68 | 0.9998 |
| Mn1 | 0.1851 | 0.1956 | 0.6284 | 3.68 | 0.0002 |
| Al2 | 0.0677 | 0.3178 | 0.5066 | 0.35 | 0.9998 |
| Mn2 | 0.0677 | 0.3178 | 0.5066 | 0.35 | 0.0002 |
| Al3 | 1/4 | 0.2451 | 0.4131 | 1.38 | 0.9998 |
| Mn3 | 1/4 | 0.2451 | 0.4131 | 1.38 | 0.0002 |
| Al4 | 0 | 0.1671 | 0 | 2.21 | 0.9998 |
| Mn4 | 0 | 0.1671 | 0 | 2.21 | 0.0002 |
| Al5 | 0 | 0 | 1/2 | 2.98 | 0.9998 |
| Mn5 | 0 | 0 | 1/2 | 2.98 | 0.0002 |
| Al6 | 0 | 1/2 | 0 | 4.29 | 0.9998 |
| Mn6 | 0 | 1/2 | 0 | 4.29 | 0.0002 |
| O1 | 0.0462 | 0.1867 | 0.3054 | 1.10 | 1 |
| O2 | 0.1359 | 0.3187 | 0.5089 | 1.10 | 1 |
| O3 | 0.1904 | 0.2482 | 0.9582 | 1.10 | 1 |
| O4 | 1/4 | 0.2957 | 0.1281 | 1.10 | 1 |
| O5 | 0.0340 | 0 | 0.8224 | 1.10 | 1 |
| O6 | 0.0527 | 1/2 | 0.3277 | 1.10 | 1 |
| O7 | 0.1582 | 0 | 0.5656 | 1.10 | 1 |
| O8 | 0.0442 | 0.3234 | 0.8311 | 1.10 | 1 |
| O9 | 1/4 | 1/2 | 0.0580 | 1.10 | 1 |
To examine the valence state of europium and manganese in Sr4Al14O25, the XPS spectra of Sr4Al14O25:xEu (x = 0.01, 0.02, 0.06) and Sr4Al14O25:0.01Eu,yMn4+ (y = 0.005, 0.01, 0.02) is recorded in Fig. 4(a) and (b). It is evident from Fig. 4(a) that the broad bands peaking at 1136.5 eV ascribed to Eu3+ 3d5/2 are observed, and the bands peaking at 1127.5 eV consistent with Eu2+ 3d5/2 emerge gradually with the increasing doping of Eu3+ ions.19 The peak intensities of Mn4+ 2p3/2 and 2p1/2 at 642.5 eV and 654.5 eV, as shown in Fig. 4(b), increase with the increasing content of Mn2+ ions, and no Mn2+ peaks are observed as the value of y varies. We can deeply confirm that there is an coexistence of Eu2+, Eu3+ and Mn4+ in Sr4Al14O25 phosphors.
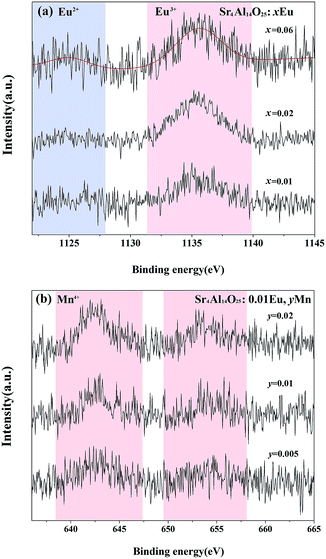 | ||
| Fig. 4 High-resolution Eu 3d XPS spectra of Sr4Al14O25:xEu (x = 0.01, 0.02, 0.06) (a) and Mn 2p XPS spectra of Sr4Al14O25:0.01Eu,yMn (y = 0.005, 0.01, 0.02) (b). | ||
Fig. 5 shows the excitation and emission spectra of Sr4Al14O25:Eu. We doped the Eu ions originally into the host in the form of Eu2O3, and we found that the trivalent and bivalent Eu ions co-existed in Sr4Al14O25:Eu prepared in air at 1400 °C for 5 h. Under 496 nm monitoring, as shown in Fig. 5(a), the broad excitation band from 250 nm to 450 nm with maximum at 362 nm originates from the f–d transition of Eu2+.20 The other excitation spectra monitored at 619 nm consists of the broad bands from 200 nm to 350 nm, which is generated from the charge-transfer band (CTB) between Eu3+ and O2− with the peak at 261 nm, and the series of narrow bands from 350 nm to 550 nm form from the f–f transition of Eu3+ within its 4f6 configuration.21 The PL spectra with different excitation factors are demonstrated in Fig. 5(b). The characteristic peaks of Eu2+ and Eu3+ are both observed in emission spectra with the change of excitation wavelength. The band emission peaking at 469 nm stems from 4f65d–4f7 transition of Eu2+, and the other five typical line emissions peaking at 596 nm, 620 nm, 652 nm, 688 nm and 707 nm are attributed to 4f–4f transition of 5d0–7fJ (J = 1, 2, 3, 4) of Eu3+.22,23 The strongest emission generated from the transition of 5d0–7f2 of Eu3+ belongs to the electric dipole transition, which reflects that the electric dipole transition is the dominant factor in the luminescence process of Eu3+.24
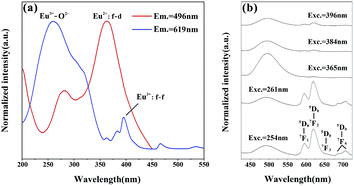 | ||
| Fig. 5 PLE spectra of Eu3+ (619 nm) and Eu2+ (496 nm) of Sr4Al14O25:0.01Eu (a) and PL spectra with different excitations (b). | ||
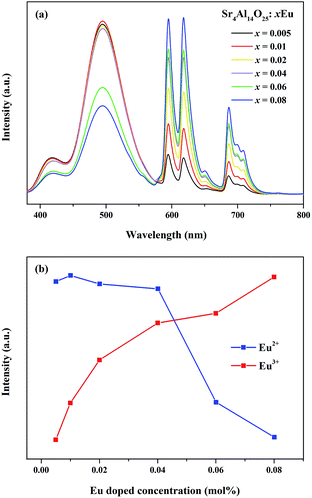
The PL spectra of Sr4Al14O25:xEu (x = 0.005, 0.01, 0.02, 0.04, 0.06, 0.08) prepared at 1400 °C for 5 h and the dependence of the relative emission intensities of Eu2+ (496 nm) and Eu3+ (594 nm) in the Sr4Al14O25 phosphors are labelled in Fig. 6. All investigated phosphors were monitored at an excitation wavelength of 325 nm. It is found that the PL intensities of red and blue emissions change obviously with the concentration variation of the Eu dopant. The emissions of Eu2+ and Eu3+ enhance with the increase of Eu3+ ions concentration, and the former reaches the maximum at 1 mol% due to the concentration quenching.25 This observation indicates that the increasing doping of Eu3+ ions spawn the V′′Sr and electrons which can combine with Eu3+ ions and promotes the self-reduction reaction in some extent. The self-reduction process can be presented in the following equations:26
| 3Sr2+ + 2Eu3+ → V′′Sr + 2Eu˙Sr | (1) |
| V′′Sr → VSrx + 2e | (2) |
| 2Eu˙Sr + 2e → 2EuSrx | (3) |
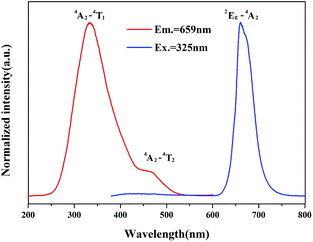
As the Mn2+ is singly doped in Sr4Al14O25 host, the PL and PLE spectra of synthesized phosphor (Sr4Al14O25:0.002Mn4+) are shown in the Fig. 7. It contains two excitation bands from 250 nm to 550 nm, which are due to the spin-allowed electronic transition 4A2–4T1 and 4A2–4T2 of Mn4+.27 The optimal excitation wavelength of Sr4Al14O25:0.002Mn4+ is 325 nm, and the half-band width is approximately 85 nm, much wider than the emission band of UV LED chips. It is indicated that the excitation wavelength at 325 nm can be an alternative for the typical commercial chips in the future market. The sharp emission band peaking at 659 nm generates from the spin-forbidden electronic transition 2Eg–4T2 of Mn4+.28
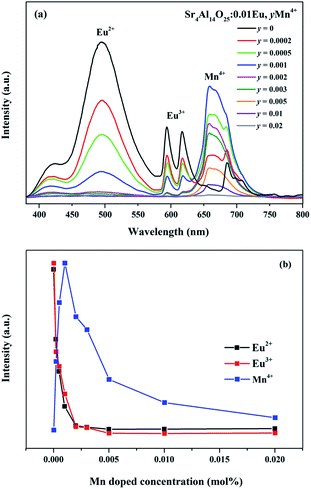
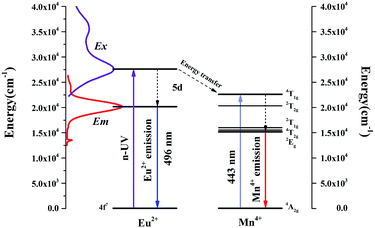
As revealed in Fig. 8, series of phosphors with varied Eu3+ and Mn4+ concentrations are synthesized and their PL spectra are recorded upon excitation of 325 nm for the investigation of the energy transfer(ET) between Eu2+ and Mn4+. We can see that the intensities of the Eu2+ and Eu3+ emissions are found to decrease monotonically with increasing Mn4+ content due to the conspicuous energy transfer between Eu2+ and Mn4+. The simplified diagram of the energy transfer process from Eu2+ to Mn4+ in Sr4Al14O25 phosphors is illustrated in Fig. 9. As indicated in this diagram, the relationship of energy transfer between Eu2+ and Mn4+ ions can be attributed to the similar energy level values between the excited 5d state of Eu2+ and the 4T1g levels of Mn4+ ions.29
Meanwhile, the PL intensity of the Mn4+ increases with the doping of Mn4+ ions, and comes to a maximum value at y = 0.001. Then the concentration quenching leads to the weakening of PL intensity. The synthesized phosphors can be tuned expediently from blue-green to white by the co-existence of Eu2+, Eu3+ and Mn4+. To observe the characteristic of change in colour after doping Mn4+ more visually, as shown in Table 3 and Fig. 10, the Commission Internationale de l'Eclairage (CIE) chromaticity coordinates, correlated colour temperature (CCT) and CIE chromaticity diagram of Sr4Al14O25:0.01Eu,yMn4+ (y = 0, 0.0002, 0.0005, 0.001) phosphors are calculated and plotted respectively. As summarized in Table 2, the series of chromaticity coordinates of the Sr4Al14O25:0.01Eu,yMn4+ are calculated from the corresponding datum of emission spectra. The phosphors can be regulated from blue-green (0.2396, 0.3332) to white (0.3465, 0.2906) with the increasing concentration of Mn4+, corresponding to the correlated colour temperature from 11![[thin space (1/6-em)]](https://www.rsc.org/images/entities/char_2009.gif) 489 K to 4554 K as listed in Table 3.
489 K to 4554 K as listed in Table 3.
| Sample no. | Composition (y) | CIE coordinates (x, y) | CCT (K) |
|---|---|---|---|
| 1(a) | 0 | (0.2396, 0.3332) | 11![[thin space (1/6-em)]](https://www.rsc.org/images/entities/char_2009.gif) 489 489 |
| 2(b) | 0.0002 | (0.2723, 0.3191) | 9380 |
| 3(c) | 0.0005 | (0.3266, 0.3040) | 5798 |
| 4(d) | 0.001 | (0.3465, 0.2906) | 4554 |
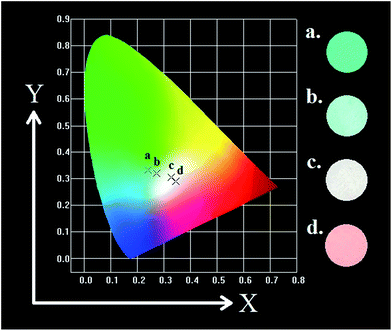 | ||
| Fig. 10 CIE chromaticity diagram of Sr4Al14O25:0.01Eu,yMn4+ (y = 0, 0.0002, 0.0005, 0.001) under 325 nm excitation and digital images in UV box. | ||
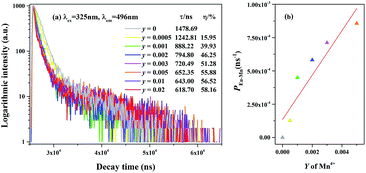
To further verify the existence of energy transfer between Eu2+ and Mn4+ in Sr4Al14O25:0.01Eu,yMn4+ (y = 0, 0.0005, 0.001, 0.002, 0.003, 0.005, 0.01, 0.02), we investigated the luminescence decay curves of Eu2+ 496 nm emission and the corresponding lifetimes of Eu2+ with the doping of Mn4+. Additionally, the energy transfer efficiency is also listed next to the lifetimes in Fig. 11(a). All the decay curves can be well fitted ground on the following non-exponential equation:30,31
 | (4) |
 | (5) |
 | (6) |
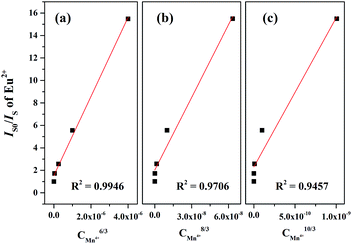
Generally, the energy transfer mechanism between the sensitizer (Eu2+) to activator (Mn4+) ions and the relation can be revealed by the Dexter's energy transfer theory:36–38
 | (7) |
Fig. 13 presents the diffuse reflection spectra of Sr4Al14O25, Sr4Al14O25:0.01Eu and Sr4Al14O25:0.01Eu,0.003Mn4+. It is observed that the energy absorption of Sr4Al14O25 host occurs in ultraviolet region, and the band gap is estimated to be 3.701 eV based on the fitting line of the absorption edge.39,40 A strong energy absorption band can be seen obviously in the 200–350 nm region from the host material. With the doping of Eu3+ ions, an obvious absorption appears around 200–300 nm in the near-UV region as a result of the 4f–5d transition of Eu2+, and the relatively weak absorption peaking at 391 nm results from the f–f transition of Eu3+, which is in accordance with the excitation spectra of Eu2+ and Eu3+. When the Mn4+ doped into the host, it exhibits an obvious absorption from 390 nm to 550 nm assigned to the spin-forbidden electronic transition of the Mn4+ ions. Above results indicates the potential of Sr4Al14O25:Eu,Mn4+ for solid-state lighting.
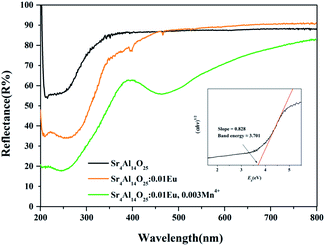 | ||
| Fig. 13 Diffuse reflectance spectra of Sr4Al14O25, Sr4Al14O25:0.01Eu and Sr4Al14O25:0.01Eu,0.003Mn4+. | ||
4 Conclusion
Series of colour-tunable direct-white-emitting phosphors Sr4Al14O25:Eu,Mn4+ were synthesized in air by conventional high temperature solid state reactions. The coexistence of Eu2+, Eu3+ and Mn4+ was proved, and the self-reduction process of Eu3+ was discussed. The luminescence properties were investigated, and three groups of emissions in Sr4Al14O25 ascribed to Eu2+, Eu3+ and Mn4+ were observed under ultraviolet excitation. The energy transfer between Eu2+ and Mn4+ originated from a nonradiative electric dipole–dipole interaction, and the energy transfer efficiency could reach 58.16%. The emission colour of Sr4Al14O25:0.01Eu,yMn4+ (y = 0, 0.0002, 0.0005, 0.001) could be modulated from blue-green (0.2396, 0.3332) to white (0.3465, 0.2906), corresponding to the colour temperature from 11![[thin space (1/6-em)]](https://www.rsc.org/images/entities/char_2009.gif) 489 K to 4554 K with the increasing concentration of Mn4+. These results manifest that the prepared Sr4Al14O25:Eu,Mn4+ phosphor can be regarded as a potential approach to obtain colour-tunable direct-white emissions through adjusting the content of Mn4+.
489 K to 4554 K with the increasing concentration of Mn4+. These results manifest that the prepared Sr4Al14O25:Eu,Mn4+ phosphor can be regarded as a potential approach to obtain colour-tunable direct-white emissions through adjusting the content of Mn4+.
Conflicts of interest
There are no conflicts to declare.Acknowledgements
We thank the National Natural Science Foundation of China (Grant No. 51472223) and the Fundamental Research Funds for Central Universities (Grant No. 2652015090).Notes and references
- B. Ma, Q. F. Guo and M. S. Molokeev, et al., Ceram. Int., 2016, 42, 5995–5999 CrossRef CAS.
- R. Y. Mi, C. L. Zhao and Z. G. Xia, J. Am. Ceram. Soc., 2014, 97, 1802–1808 CrossRef CAS.
- D. L. Geng, G. G. Li and M. M. Shang, et al., J. Mater. Chem., 2012, 22, 14262–14271 RSC.
- Z. Y. Wang, J. Chen and Y. G. Liu, et al., J. Adv. Ceram., 2017, 6, 81–89 CrossRef CAS.
- Y. T. Lin, Z. R. Niu and Y. Han, et al., J. Alloys Compd., 2017, 690, 267–273 CrossRef CAS.
- Y. F. Xia, J. Chen and Y. G. Liu, et al., Mater. Express, 2016, 6, 37–44 CrossRef CAS.
- M. Lee and W. Jung, Ceram. Int., 2016, 42, 3113–3120 CrossRef CAS.
- T. Arakawa and N. Nagata, J. Alloys Compd., 2006, 408–412, 864–866 CrossRef CAS.
- A. D. Deshmukh, S. J. Dhoble and N. S. Dhoble, Adv. Mater. Lett., 2011, 2, 38–42 CrossRef CAS.
- L. J. Xiao, M. R. He and Y. W. Tian, et al., J. Nanosci. Nanotechnol., 2010, 10, 2131–2134 CrossRef CAS PubMed.
- M. Y. Peng, J. R. Qiu and L. Y. Yang, et al., Opt. Mater., 2004, 27, 591–595 CrossRef CAS.
- M. Y. Peng and G. Hong, J. Lumin., 2007, 127, 735–740 CrossRef CAS.
- M. Rezende, M. Valerio and R. Jackson, Mater. Res. Bull., 2014, 61, 348–351 CrossRef.
- M. Y. Peng, Z. W. Pei and G. Hong, et al., Chem. Phys. Lett., 2003, 371, 1–6 CrossRef CAS.
- Y. D. Xu, D. Wang and L. Wang, et al., J. Alloys Compd., 2013, 550, 226–230 CrossRef CAS.
- M. Y. Peng, Z. W. Pei and G. Hong, et al., J. Mater. Chem., 2003, 13, 1202–1205 RSC.
- M. Y. Peng, X. W. Yin and P. Tanner, et al., Chem. Mater., 2015, 27, 2938–2945 CrossRef CAS.
- Y. H. Lin, Z. L. Tang and Z. T. Zhang, et al., Appl. Phys. Lett., 2002, 81, 996–998 CrossRef CAS.
- J. Chen, Y. G. Liu and H. K. Liu, et al., Opt. Mater., 2015, 42, 80–86 CrossRef CAS.
- Z. G. Xia, R. S. Liu and K. W. Huang, et al., J. Mater. Chem., 2012, 22, 15183–15189 RSC.
- R. Y. Mi, J. Chen and Y. G. Liu, et al., RSC Adv., 2016, 6, 28887–28894 RSC.
- H. K. Liu, Q. F. Guo and L. B. Liao, et al., Opt. Commun., 2013, 309, 64–67 CrossRef CAS.
- Z. G. Xia, J. Zhou and Z. Y. Mao, J. Mater. Chem. C, 2013, 1, 5917–5924 RSC.
- J. Chen, Y. G. Liu and L. F. Mei, et al., J. Mater. Chem. C, 2015, 3, 3451–3455 Search PubMed.
- H. K. Liu, Y. Y. Zhang and L. B. Liao, et al., J. Lumin., 2014, 156, 49–54 CrossRef CAS.
- Q. H. Zeng, Z. W. Pei and S. B. Wang, et al., J. Alloys Compd., 1998, 275–277, 238–241 CrossRef CAS.
- Y. Zhydachevskii, D. Galanciak and S. Kobyakov, et al., J. Phys.: Condens. Matter, 2006, 18, 11385 CrossRef CAS.
- S. Adachi and T. Takahashi, J. Appl. Phys., 2008, 104, 317 CrossRef.
- S. Adachi and T. Takahashi, J. Appl. Phys., 2009, 106, 339 CrossRef.
- R. J. Xie, N. Hirosaki and N. Kimura, et al., Appl. Phys. Lett., 2007, 90, 191101 CrossRef.
- Y. Y. Zhang, Z. G. Xia and H. K. Liu, et al., Chem. Phys. Lett., 2014, 593, 189 CrossRef CAS.
- M. Xie, T. Ye and Y. Huang, et al., ChemInform, 2011, 42 Search PubMed.
- D. Wen, J. Feng and J. Li, et al., J. Mater. Chem. C, 2015, 3, 2107–2114 RSC.
- J. Chen, C. H. Li and Z. Hui, et al., Inorg. Chem., 2017, 56, 1144–1151 CrossRef CAS PubMed.
- W. J. Yang, L. Y. Luo and T. M. Chen, et al., Chem. Mater., 2005, 17, 3883–3888 CrossRef CAS.
- D. L. Dexter and J. H. Schulman, J. Chem. Phys., 1954, 22, 1063–1070 CrossRef CAS.
- S. P. Lee, C. H. Huang and T. M. Chen, J. Mater. Chem. C, 2014, 2, 8925–8931 RSC.
- D. Y. Wang, C. H. Huang and B. M. Cheng, et al., RSC Adv., 2014, 4, 28632–28635 RSC.
- Y. F. Xia, Y. G. Liu and Z. H. Huang, et al., J. Mater. Chem. C, 2016, 4, 4675–4683 RSC.
- C. Zeng, H. W. Huang and Y. M. Hu, et al., RSC Adv., 2015, 5, 68099–68108 RSC.
| This journal is © The Royal Society of Chemistry 2017 |

