 Open Access Article
Simultaneous removal of phosphorus and dissolved organic matter from a sludge in situ reduction process effluent by coagulants
Ying Ana,
Zhen Zhou *a,
Weimin Qiaoa,
Wei Panb and
Zhihui Chenb
aCollege of Environmental and Chemical Engineering, Shanghai University of Electric Power, Shanghai 200090, China. E-mail: zhouzhen@shiep.edu.cn
bShanghai Municipal Sewerage Co., Ltd., Shanghai 200233, China
First published on 31st August 2017
Abstract
Owing to the long solids retention time and effective sludge decay, the increase in the amount of phosphorus and dissolved organic matter (DOM) in effluents is a major obstacle to the sludge in situ reduction process. In this study, the coagulants hydrated aluminum sulfate (Al2(SO4)3), ferric trichloride (FeCl3), and polyaluminum chloride (PAC) were applied for the simultaneous removal of phosphorus and DOM from the secondary effluent of a sludge process reduction-activated sludge wastewater treatment system. The results indicated that in most cases, Al2(SO4)3 exhibited the best coagulation performance, followed by FeCl3 and PAC. Three-dimensional excitation–emission matrix fluorescence spectroscopy and gel permeation chromatography (GPC) were used for the detailed characterization of the DOM after the coagulation treatment. Herein, two humic-like components and a protein-related component were identified in the wastewater samples by parallel factor (PARAFAC) analysis. The protein-related component was removed more effectively by FeCl3 and PAC, whereas Al2(SO4)3 was more effective for the removal of humic-like components. The GPC analysis showed that FeCl3 exhibited the best removal performance for large molecules with a MW > 1000 kDa, whereas Al2(SO4)3 showed a relatively good removal performance for small molecules with a MW < 2 kDa. The correlation analysis showed that for the Al2(SO4)3 samples, there were significant correlations (p < 0.01) between the total organic carbon, UV absorbance at 254 nm, total phosphorus, and maximum fluorescence intensity of the three PARAFAC components; on the other hand, for the FeCl3 and PAC samples, DOM removal was mostly correlated with the humic-like components, and the correlation coefficients among the seven variables were lower than those for the Al2(SO4)3 samples.
1. Introduction
With the dramatic increase in the size and number of wastewater treatment plants (WWTPs), the generation of large amounts of waste-activated sludge (WAS) in the activated sludge process has become a major problem.1 Conventional sludge treatment (e.g., thickening, dewatering, and incineration) and disposal (e.g., landfill and land utilization) strategies have become an economic and environmental burden for society because of their complex processes, high operational and transportation costs, land requirements, and strict regulations for the control of hazardous substances.2,3 In recent years, many sludge in situ reduction (SIR) approaches have been proposed to decrease the amount of sludge produced in the activated sludge process rather than struggling with its treatment and disposal.4,5 In recent years, some SIR processes, such as anaerobic side-stream reactor (ASSR) processes6 and the sludge process reduction activated sludge (SPRAS) technology, have been successfully applied in full scale WWTPs, and an efficient sludge reduction has been achieved. SIR usually influences pollutant removal in wastewater treatment processes; thus, effective measures should be investigated and employed to guarantee the effluent quality of the SIR process.During the SIR process, dissolved organic matter (DOM) is released from cell lysis and hydrolysis of particulate organic substances and then utilized by denitrifying biomass to improve nitrogen removal in both ASSR7,8 and the SPRAS system with a micro-aerobic tank and a settler for sludge reduction.9 The SIR process decreases the discharged amount of WAS, but it has been reported to hinder the removal of biological phosphorus,8–11 whose concentration depends on the amount of phosphorus-accumulating organisms discharged with WAS; furthermore, an increased amount of DOM in the effluents obtained by SIR has been reported, which is attributed to the release of secondary substrates after sludge reduction.7 DOM in the effluent is a heterogeneous mixture of various organic substances consisting of non-biodegradable soluble organic matter from influent wastewater and refractory soluble microbial products derived from pollutant degradation and sludge reduction.12,13 When subjected to disinfection, DOM is the primary source of trihalomethane precursors,14 which can cause the effluent to fall below the standards where stringent standards are in place for effluent discharges. For instance, the Grade IV requirement (COD < 30 mg L−1) of the Environmental Quality Standards for Surface Water (GB 3838-2002) has been proposed and is ready to be promulgated as a standard for effluent discharges to protect key water resources areas in China. Most of the existing WWTPs fall short of this requirement;15 therefore, simultaneous removal of phosphorus and DOM from effluents of the SIR process is necessary.
In this study, phosphorus and DOM in the secondary effluent of an SPRAS system were simultaneously removed by a coagulation treatment. The SPRAS technology was designed for SIR with a sludge process reduction (SPR) modulecomposed of a micro-aerobic tank and a settler, inserted upstream of the conventional AS process. This system performed well for pollutant removal and sludge reduction.9,16,17 A detailed characterization of the DOM following the coagulation treatment was carried out by three-dimensional excitation–emission matrix (EEM) fluorescence spectroscopy and gel permeation chromatography (GPC). Parallel factor analysis (PARAFAC) was employed to decompose EEM into individual fluorescent components, which were then correlated with DOM indices to elucidate the DOM removal mechanism by coagulation.
2. Materials and methods
2.1 Water samples and coagulants
The secondary effluent used in this study was obtained from a pilot-scale SPRAS system (200 L d−1) fed with wastewater from the Dongqu WWTP (Shanghai, China). The SPRAS system achieved a sludge reduction efficiency of 68.3%.9 The characteristics of the test effluent were as follows: pH = 7.22, total organic carbon (TOC) = 9.84 mg L−1, ammonia nitrogen = 0.17 mg L−1, nitrate nitrogen = 11.95 mg L−1, total nitrogen = 16.05 mg L−1, UV absorbance at 254 nm (UV254) = 0.182, total phosphorus (TP) = 2.87 mg L−1, soluble TP (STP) = 1.78 mg L−1, and orthophosphate phosphorus (OP) = 1.62 mg L−1.Aluminum sulfate (Al2(SO4)3·18H2O), ferric chloride (FeCl3·6H2O), and a commercial poly-aluminum chloride (PAC) were used as coagulants for phosphorus removal. Al2(SO4)3 and FeCl3 were of analytical grade. The Al2O3 content of PAC was 11%.
2.2 Batch tests
During each experiment, 600 mL of well-mixed secondary effluent was poured into an 800 mL glass beaker that was placed in a jar tester (ZR4-6, China). The coagulation process consisted of a fast agitation stage at 280 rpm for 0.5 min, followed by a slow agitation stage at 80 rpm for 15 min, and a 30 min sedimentation stage. A specified dosage of coagulant was added at the beginning of the fast agitation stage. The zeta potential (ζ-potential) and pH values were measured after the fast agitation stage. After the sedimentation stage, the supernatant was taken for TP analysis. Subsequently, the supernatant was filtered through a 0.45 μm membrane filter for STP, TOC, UV254, EEM fluorescence, and molecular weight (MW) distribution measurements.2.3 Analytical methods
TP and OP were analyzed following standard methods.18 TOC was determined using a multi N/C 3100 analyzer (Analytikjena, Germany). UV254 was measured via a 2802 UV/vis spectrometer (Unico, USA). The pH value was measured using an HQ30d portable pH-meter (Hach, USA), and ζ-potentials were determined using a Zetasizer nano Z 90 analyzer (Malvern, UK). The MW distribution of the DOM sample was measured using a GPC analyzer (1206, Agilent, USA). Polyethylene glycols were used as standards for calibration. At various time intervals, the eluate was obtained by an automatic fraction collector and automatically analyzed using a UV spectroscope and a TOC analyzer to obtain a MW distribution.The EEM fluorescence spectra were obtained using a luminescence spectrometer (RF-5301pc, Shimadzu, Japan). The EEM spectra were obtained using a scanning emission (Em) spectrometer from 220 to 500 nm at 5 nm intervals by varying the excitation (Ex) wavelengths from 220 to 500 nm at 5 nm sampling intervals. The Ex and Em slits were set at 5 nm and the scanning speed was set at super. To overcome the overlap problem, spectral data were analyzed using the PARAFAC algorithm to quantitatively determine the components of fluorophores. The PARAFAC analysis was conducted via MATLAB R2013a (Mathworks, MA) using DOMFluor, which contained Nway toolbox version 3.1 (http://www.models.life.ku.dk/).
3. Results and discussion
3.1 Phosphorus and DOM removal by coagulation
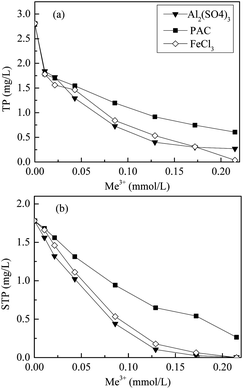
For comparison, chemical dosage was expressed as molar concentration of Al3+ or Fe3+. The influence of Al2(SO4)3, FeCl3, and PAC dosage on phosphorus removal from the secondary effluent is shown in Fig. 1. In the raw secondary effluent, STP was the predominant form (63.4%), whereas OP accounted for 89.6% of STP, which could quickly chemically precipitate with metal ions.As shown in Fig. 1, the trend for the TP and STP concentrations as a function of dosage with different coagulants was similar. The residual phosphorus in the treated effluent decreased as the dosage increased from 0 to 0.22 mmol L−1. Compared to the residual STP (Fig. 1b), TP in the treated effluent (Fig. 1a) showed higher removal efficiency at a low dosage of 0.01 mmol L−1, attributable to the removal of particulate phosphorus (PP) by coagulation. As shown in Fig. 1a, Al2(SO4)3 exhibited the highest phosphorus removal efficiency; TP in the treated effluent decreased to 0.39 mg L−1 at a dosage of 0.13 mmol L−1, which conformed to Grade 1A (<0.5 mg L−1) of the state discharge standard GB 18918-2002 of China. The residual TP concentration in the effluent treated with FeCl3 also conformed to Grade 1A of GB 18918-2002 at a dosage of 0.17 mmol L−1. PAC showed the lowest removal efficiency for TP, reaching only 0.61 mg L−1 in the treated effluent, even at a dosage of 0.22 mmol L−1. At the coagulation dosage of 0.22 mmol L−1, the chemical sludge production of PAC (39.0 ± 1.4 mg L−1) was higher than those of Al2(SO4)3 (16.0 ± 1.7 mg L−1) and FeCl3(16.5 ± 0.7 mg L−1).
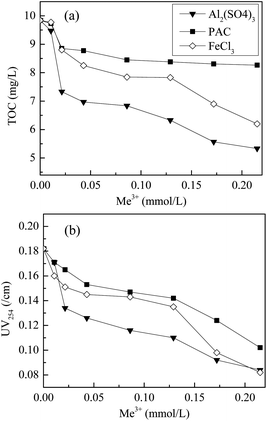
The dissolved organic matter (DOM) in the secondary effluent was partly removed by coagulants, accompanied by phosphorus removal. TOC and UV254 are two commonly used indices for evaluating DOM in wastewater;19 TOC represents the level of organic carbon in water and UV254 indicates the amount of aromatic organics, especially humic and fulvic acids.20 The results of coagulation on TOC and UV254 are shown in Fig. 2. The DOM removal efficiency increased sharply at low dosages and then reached a plateau as the coagulant dosage increased. Compared to PAC, the monomeric aluminum salt and iron salt coagulants demonstrated a better performance for DOM removal. At a dosage of 0.22 mmol L−1, the TOC removal efficiency was 45.8%, 37.0%, and 16.0% with Al2(SO4)3, FeCl3, and PAC as coagulants, respectively, whereas the respective efficiency for UV254 was 53.8%, 54.9%, and 44.0%, respectively. These results are consistent with previous studies stating that Al2(SO4)3 is the most efficient of all coagulants for the treatment of micro-polluted water21,22 and wastewater.23 Hu et al.24 also reported that the monomeric aluminum salt was more effective than PAC in removing turbidity and DOM in eutrophic water because aluminum ion not only generates Al3+ species, but also functions as a pH control agent in the coagulation process. Furthermore, investigations on DOM removal from leachate and drinking water also showed that sulfate-based coagulants exhibited a higher removal efficiency than chloride-based coagulants.25 These results suggest that the ability of metals to coagulate DOM may be related to the aggregation state of the coagulant and the affinity of the metal for organic matter.
The hydration of the coagulants in water resulted in changes of pH and colloidal stability and thus affected the aggregation state of the coagulants and their affinity for DOM.26,27 The pH and ζ-potential used to characterize the coagulation performance of the different coagulants are shown in Fig. 3.
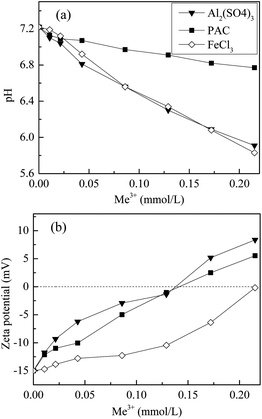 | ||
| Fig. 3 Changes in the pH and ζ-potential values for the coagulated effluent as a function of dosage. | ||
As shown in Fig. 3a, pH in the treated effluent decreased as the coagulant dosage increased because the hydration of metal salts is an alkalinity-consuming process. It was noteworthy that the solution pH dropped to the acidic range after the addition of Al2(SO4)3 or FeCl3, whereas only slight pH changes were observed with PAC. This is due to the fact that inorganic polymeric coagulants such as PAC consume less alkalinity than monomeric metal ions. Overall, acidic conditions favoured coagulation because of the lower negative charge on the particles and the DOM. The improved TP removal with Al2(SO4)3 and FeCl3 was also partly attributed to the drop in pH because the optimal precipitation of metal–phosphate complexes occurs under acidic conditions.28,29
Fig. 3b shows the changes in the ζ-potential of the flocs formed after rapid stirring with the coagulant. The ζ-potential rapidly increased from negative (−15.0 mV) to positive (8.4 and 5.5 mV) as the Al2(SO4)3 and PAC dosage increased, whereas for FeCl3, the ζ-potential never increased above the isoelectric point within the experimental range. The equipotential dosages of Al2(SO4)3 and PAC were both about 0.14 mmol L−1. Charge neutralization played a major role during the PAC coagulation process because the ζ-potential was correlated with the PAC dosage (Fig. 3b).30 Al2(SO4)3 displayed the highest charge neutralization ability at low dosages, resulting in an abrupt decrease of DOM (Fig. 2). The adsorption and enmeshment increased the DOM removal efficiency because of the formation of hydroxide precipitates at higher dosage.24 The lower ζ-potential of FeCl3 indicated that adsorption and enmeshment were possibly the dominant mechanisms at the dosages below 0.13 mmol L−1, whereas charge neutralization played a major role at dosages above 0.13 mmol L−1.30,31 As shown in Fig. 2, TOC and UV254 decreased slowly at dosages below 0.13 mmol L−1 and dropped significantly at higher dosages. Thus, it was concluded that adsorption and enmeshment mechanism of FeCl3 had a lesser effect on the removal of DOM than charge neutralization.
3.2 Characterization of DOM by coagulation treatment
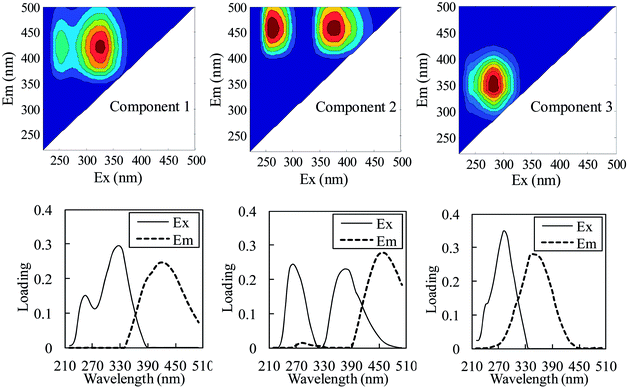
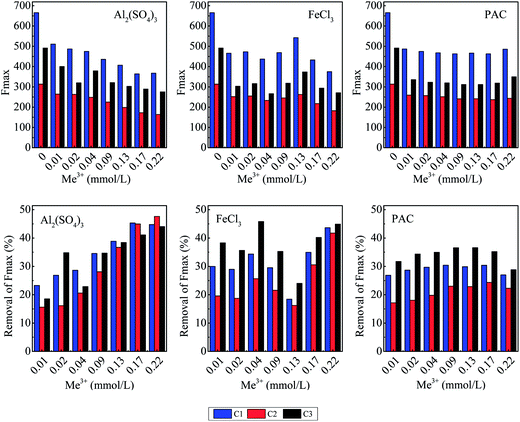
The effect of coagulant addition on DOM fluorescence was evaluated based on the variation in the contribution of the PARAFAC components to the maximum fluorescence intensity (Fmax) in the water samples. Fmax is generally used as a surrogate parameter to estimate the relative concentration of PARAFAC components in the DOM pool;37–39 the variation in the contribution of the PARAFAC components to the total Fmax was determined to analyze the effect of the coagulation treatment on DOM fluorescence. Fig. 5 shows the Fmax levels and contribution of the PARAFAC components to the total Fmax of the raw effluent and coagulant-treated effluent, and the removal efficiency of these fluorescence components is also shown. Generally, Fmax was highest for the raw effluent and decreased following coagulation. A humic-like component, represented by C1, was the most abundant fluorophore group in the raw and treated water samples, followed by C3, representing a protein-related material. The contribution of the humic-like PARAFAC components (C1 and C2) to the total Fmax in the raw effluent was 66.6%; this indicated that humic-like material was the major component of fluorescent DOM. Due to the addition of FeCl3 and PAC, the average percentage of humic-like PARAFAC components in DOM increased to 69.3% and 69.0%, respectively, whereas the percentage was essentially the same after the addition of Al2(SO4)3. These results indicated that FeCl3 and PAC tended to remove the protein-related component, whereas Al2(SO4)3 showed similar removal efficiency for both the protein-related and the humic-like components.
It can be seen in Fig. 5 that the responses of each fluorescent component to the range of coagulants and doses were different. The Fmax removal percentage of each PARAFAC component increased as the Al2(SO4)3 dose increased, with the exception of component C2 at a dosage of 0.02 mmol L−1; the largest removal rates for C1, C2, and C3 were 45.3%, 47.6%, and 44.0%, respectively. For FeCl3 and PAC, the removal efficiency for the protein-related component was larger than that for the humic-like component. With FeCl3 as the coagulant, each component experienced a relatively high removal efficiency at low dosages as compared to the cases of Al2(SO4)3 and PAC. The removal efficiency reached a minimum value when the dosage increased to 0.13 mmol L−1 and then increased as the dosage of FeCl3 increased, achieving a maximum removal rate of C1 (43.7%) and C2 (41.8%) at the highest dosage. As PAC dosage increased, the removal efficiency of each component first increased and then declined, with a maximum a dosage of 0.09 mmol L−1; however, overall, efficiencies (30.4%, 23.0%, and 36.6% for C1, C2, and C3) were less than those for Al2(SO4)3 or FeCl3. The difference in the removal efficiencies of the three coagulants may be attributed to the differences in pH because humic substances tend to aggregate at an acidic pH.40
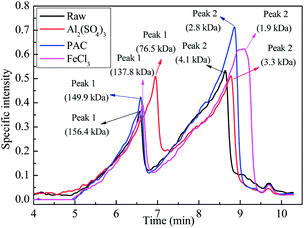
The abovementioned results suggest that larger organic molecules are more easily removed by the coagulation process; this is consistent with observations reported in previous studies.41–43 On comparing the removal performance of the three coagulants for molecules with different MWs, it was concluded that FeCl3 exhibited the best removal performance for large molecules with MW > 1000 kDa, whereas Al2(SO4)3 performed the worst. By contrast, Al2(SO4)3 showed a relatively good removal performance for small molecules with MW < 2 kDa. On the other hand, PAC was found to be effective for the removal of both high- and low-MW organics.
3.3 Correlation analysis of DOM by coagulation treatment
A correlation analysis was carried out for all samples obtained after coagulation treatment, with the variables TOC concentration, UV254, TP concentration, and Fmax for the three PARAFAC components (C1, C2, and C3; Table 1). For the Al2(SO4)3 samples, there were significant correlations (p < 0.01) between TOC concentration, UV254, TP concentration, and Fmax for the three PARAFAC components. The correlation between TOC concentration, UV254, and TP concentration was stronger with C2 than with C1 or with C3. The results were in agreement with those obtained by Gone et al. for the coagulation of tropical surface water with Al2(SO4)3, indicating that Al2(SO4)3 coagulation had insignificant selectivity for fluorescent substances in DOM.44 However, for FeCl3 and PAC samples, the relationship between three PARAFAC components, TOC concentration, UV254, and TP concentration was weaker than that for the Al2(SO4)3 samples. The relationship between C2 and TOC concentration (as well as UV254 and TP concentration) had the lowest correlation coefficient for the FeCl3 samples as compared to the case of other two coagulants. Contrary to C2, there was no significant correlation observed between C1 (as well as C3) and TOC concentration, UV254, and TP concentration. This was because Fmax values of C1 and C3 were both insensitive to the dosage of FeCl3 and PAC (Fig. 5). Interestingly, TOC concentration, UV254, and TP concentration consistently had strong correlations with each other for these three coagulants.| TOC | UV254 | C1 | C2 | C3 | TP | ||
|---|---|---|---|---|---|---|---|
| a Correlation is significant at the 0.01 level (two-tailed).b Correlation is significant at the 0.05 level (two-tailed). | |||||||
| Al2(SO4)3 | TOC | 1 | 1a | 0.976a | 1a | 0.929a | 1a |
| UV254 | 1 | 0.976a | 1a | 0.929a | 1a | ||
| C1 | 1 | 0.976a | 0.905a | 0.976a | |||
| C2 | 1 | 0.929a | 1a | ||||
| C3 | 1 | 0.929a | |||||
| FeCl3 | TOC | 1 | 1a | 0.643 | 0.714b | 0.429 | 1a |
| UV254 | 1 | 0.643 | 0.714b | 0.429 | 1a | ||
| C1 | 1 | 0.976a | 0.905a | 0.643 | |||
| C2 | 1 | 0.857a | 0.714b | ||||
| C3 | 1 | 0.429 | |||||
| PAC | TOC | 1 | 1a | 0.571 | 0.833b | 0.429 | 1a |
| UV254 | 1 | 0.571 | 0.833b | 0.429 | 1a | ||
| C1 | 1 | 0.905a | 0.905a | 0.571 | |||
| C2 | 1 | 0.762b | 0.833b | ||||
| C3 | 1 | 0.429 | |||||
4. Conclusions
The simultaneous removal of phosphorus and DOM from the effluent of a SPRAS process for SIR was investigated by coagulation treatment with three different coagulants (Al2(SO4)3, FeCl3, and PAC). In most cases, Al2(SO4)3 exhibited the best coagulation performance, followed by FeCl3 and PAC. PARAFAC analysis of three-dimensional EEM fluorescence spectra showed that the protein-related component were more effectively removed by FeCl3 and PAC, whereas Al2(SO4)3 was more effective for removing the humic-like components. FeCl3 exhibited the best removal performance for large molecules, with MW > 1000 kDa, whereas Al2(SO4)3 showed a relatively good removal performance for smaller molecules, with MW < 2 kDa. PAC was found to be effective for the removal of both high- and low-MW organics. The correlation analysis showed that for the Al2(SO4)3 samples, there were significant correlations (p < 0.01) between TOC, UV254, TP, and Fmax of the three PARAFAC components. On the other hand, for the FeCl3 and PAC samples, DOM removal was primarily correlated with the humic-like component, and the correlation coefficients among the seven variables were lower than those for the Al2(SO4)3 samples.Conflicts of interest
We declare that we do not have any commercial or associative interest that represents a conflict of interest in connection with the work submitted.Acknowledgements
We thank the Shanghai Rising-Star Program (16QA1401900), the National Natural Science Foundation of China (51408352), and the Chinese National 863 Program (2012AA063403) for providing financial support for this study.References
- A. Khursheed and A. A. Kazmi, Water Res., 2011, 45, 4287 CrossRef CAS PubMed.
- M. T. Nguyen, N. H. Mohd Yasin, T. Miyazaki and T. Maeda, Chemosphere, 2014, 117, 552 CrossRef CAS PubMed.
- T. H. Niu, Z. Zhou, W. C. Ren, L. M. Jiang, B. Y. Li, H. J. Wei, J. Li and L. C. Wang, Int. Biodeterior. Biodegrad., 2016, 106, 170 CrossRef CAS.
- P. Yan, J. S. Guo, J. Wang, Y. P. Chen, F. Y. Ji, Y. Dong, H. Zhang and W. J. Ouyang, Bioresour. Technol., 2015, 183, 181 CrossRef CAS PubMed.
- D. H. Nam and K. H. Kang, Water Sci. Technol., 2013, 67, 2838 CrossRef CAS PubMed.
- V. F. Velho, P. Foladori, G. Andreottola and R. H. R. Costa, J. Environ. Manage., 2016, 177, 223 CrossRef CAS PubMed.
- C. Cheng, Z. Zhou, T. H. Niu, Y. An, X. Y. Shen, W. Pan, Z. H. Chen and J. Liu, Bioresour. Technol., 2017, 234, 380 CrossRef CAS PubMed.
- Z. Zhou, W. M. Qiao, C. Xing, Y. An, X. L. Shen, W. C. Ren, L. M. Jiang and L. C. Wang, Chem. Eng. J., 2015, 266, 249 CrossRef CAS.
- T. H. Niu, Z. Zhou, X. L. Shen, W. M. Qiao, L. M. Jiang, W. Pan and J. J. Zhou, Water Res., 2016, 90, 369 CrossRef CAS PubMed.
- W. Q. Guo, S. S. Yang, W. S. Xiang, X. J. Wang and N. Q. Ren, Biotechnol. Adv., 2013, 31, 1386 CrossRef CAS PubMed.
- W. T. Li, S. Y. Chen, Z. X. Xu, Y. Li, C. D. Shuang and A. M. Li, Environ. Sci. Technol., 2014, 48, 2603 CrossRef CAS PubMed.
- P. K. Jin, X. Jin, X. C. C. Wang and X. B. Shi, Chemosphere, 2013, 91, 558 CrossRef CAS PubMed.
- Z. Zhou, W. M. Qiao, C. Xing, C. Y. Wang, L. M. Jiang, Y. T. Gu and L. C. Wang, Chem. Eng. J., 2015, 259, 357 CrossRef CAS.
- D. F. Ma, B. Y. Gao, S. L. Sun, Y. Wang, Q. Y. Yue and Q. Li, Bioresour. Technol., 2013, 136, 535 CrossRef CAS PubMed.
- Q. H. Zhang, W. N. Yang, H. H. Ngo, W. S. Guo, P. K. Jin, M. Dzakpasu, S. J. Yang, Q. Wang, X. C. Wang and D. Ao, Environ. Int., 2016, 92, 11 CrossRef PubMed.
- Z. Zhou, W. M. Qiao, C. Xing, X. L. Shen, D. L. Hu and L. C. Wang, Bioresour. Technol., 2014, 173, 452 CrossRef CAS PubMed.
- Z. Zhou, W. M. Qiao, C. Xing, Y. J. Wang, C. Y. Wang, Y. F. Wang, Y. R. Wang and L. C. Wang, Water Sci. Technol., 2014, 69, 934 CrossRef CAS PubMed.
- Chinese NEPA, Water and Wastewater Monitoring Methods, Chinese Environmental Science Publishing House, Beijing, China, 4th edn, 2012 Search PubMed.
- W. P. Cheng, F. H. Chi and R. F. Yu, Environ. Monit. Assess., 2004, 98, 421 CrossRef CAS PubMed.
- C. Musikavong and S. Wattanachira, Environ. Monit. Assess., 2007, 134, 489 CrossRef CAS PubMed.
- H. Selcuk, L. Rizzo, A. N. Nikolaou, S. Meric, V. Belgiorno and M. Bekbolet, Desalination, 2007, 210, 31 CrossRef CAS.
- M. Yan, D. Wang, J. Qu, J. Ni and C. W. Chow, Water Res., 2008, 42, 2278 CrossRef CAS PubMed.
- T. Park, V. Ampunan, S. Lee and E. Chung, Chemosphere, 2016, 144, 2264 CrossRef CAS PubMed.
- C. Z. Hu, H. J. Liu, J. H. Qu, D. S. Wang and J. Ru, Environ. Sci. Technol., 2006, 40, 325 CrossRef CAS PubMed.
- S. E. Comstock, T. H. Boyer, K. C. Graf and T. G. Townsend, Chemosphere, 2010, 81, 976 CrossRef CAS PubMed.
- E. Tipping, C. Rey-Castro, S. E. Bryan and J. Hamilton-Taylor, Geochim. Cosmochim. Acta, 2002, 66, 3211 CrossRef CAS.
- H. Kerndorff and M. Schnitzer, Geochim. Cosmochim. Acta, 1980, 44, 1701 CrossRef CAS.
- J. Matusik, T. Bajda and M. Manecki, J. Hazard. Mater., 2008, 152, 1332 CrossRef CAS PubMed.
- Z. Djedidi, J. Ben Khaled, R. Ben Cheikh, J. F. Blais, G. Mercier and R. D. Tyagi, Hydrometallurgy, 2009, 95, 61 CrossRef CAS.
- Y. X. Zhao, B. Y. Gao, Q. B. Qi, Y. Wang, S. Phuntsho, J. H. Kim, Q. Y. Yue, Q. Li and H. K. Shon, J. Hazard. Mater., 2013, 258, 84 CrossRef PubMed.
- Z. L. Yang, B. Y. Gao and Q. Y. Yue, Chem. Eng. J., 2010, 165, 122 CrossRef CAS.
- S. A. Baghoth, S. K. Sharma and G. L. Amy, Water Res., 2011, 45, 797 CrossRef CAS PubMed.
- D. Suor, J. X. Ma, Z. Y. Wang, Y. L. Li, J. X. Tang and Z. C. Wu, Chem. Eng. J., 2014, 248, 415 CrossRef CAS.
- P. Kowalczuk, W. J. Cooper, M. J. Durako, A. E. Kahn, M. Gonsior and H. Young, Mar. Chem., 2010, 118, 22 CrossRef CAS.
- N. P. Sanchez, A. T. Skeriotis and C. M. Miller, Water Res., 2013, 47, 1679 CrossRef CAS PubMed.
- K. R. Murphy, C. A. Stedmon, T. D. Waite and G. M. Ruiz, Mar. Chem., 2008, 108, 40 CrossRef CAS.
- N. P. Sanchez, A. T. Skeriotis and C. M. Miller, Environ. Sci. Technol., 2014, 48, 1582 CrossRef CAS PubMed.
- M. Ruscalleda, B. Seredynska-Sobecka, B. J. Ni, E. Arvin, M. D. Balaguer, J. Colprim and B. F. Smets, Chemosphere, 2014, 117, 271 CrossRef CAS PubMed.
- G. P. Sheng and H. Q. Yu, Water Res., 2006, 40, 1233 CrossRef CAS PubMed.
- Z. Zhou, D. L. Hu, W. C. Ren, Y. Z. Zhao, L. M. Jiang and L. C. Wang, Chemosphere, 2015, 141, 94 CrossRef CAS PubMed.
- E. C. Wert, S. Gonzales, M. M. Dong and F. L. Rosario-Ortiz, Water Res., 2011, 45, 5191 CrossRef CAS PubMed.
- J. Haberkamp, A. S. Ruhl, M. Ernst and M. Jekel, Water Res., 2007, 41, 3794 CrossRef CAS PubMed.
- B. P. Allpike, A. Heitz, C. A. Joll, R. I. Kagi, G. Abbt-Braun, F. H. Frimmel, T. Brinkmann, N. Her and G. Amy, Environ. Sci. Technol., 2005, 39, 2334 CrossRef CAS PubMed.
- D. L. Gone, J. L. Seidel, C. Batiot, K. Bamory, R. Ligban and J. Biemi, J. Hazard. Mater., 2009, 172, 693 CrossRef CAS PubMed.
| This journal is © The Royal Society of Chemistry 2017 |

