 Open Access Article
Light filter tailoring – the impact of light emitting diode irradiation on the morphology and optical properties of silver nanoparticles within polyethylenimine thin films
F. Kemper *ab,
E. Beckerta,
R. Eberhardta and
A. Tünnermannab
aFraunhofer Institute for Applied Optics and Precision Engineering (IOF), Albert-Einstein-Str. 7, D-07745 Jena, Germany. E-mail: falk.kemper@iof.fraunhofer.de
bInstitute of Applied Physics, Abbe Center of Photonics (ACP), Friedrich Schiller University Jena, Max-Wien-Platz 1, D-07743 Jena, Germany
First published on 25th August 2017
Abstract
In this contribution in situ emission filter generation for, e.g. fluorescence light detection by morphology tailoring of silver nanoparticles within a polymer layer, is presented for the first time. After depositing a pretreated film of polyethylenimine containing spherical silver nanoparticles the composite layer was irradiated with green LEDs (peak wavelength 530 nm). This leads to a morphology change of the silver nanoparticles and therefore to a change in absorption properties of the resulting polymer film with an absorption maximum at 550 nm. This tailoring of silver nanoparticles embedded in a transparent polymer matrix could address many novel applications such as adaptable light filters for future lab-on-a-chip applications. A LED for fluorescence light excitation was used to illuminate the silver nanoparticles, which led to an increasing absorption of that particular light spectrum, and therefore in situ produced a fluorescence emission filter. The effect of the treatment time, the silver ion concentration, and the temperature at which the “light-shaping” was done was studied. The silver nanoparticles were investigated using UV/Vis-spectroscopy and scanning electron microscopy. The observed nanoparticle shapes give reasons for a novel hypothesis of nanoparticle evolution. The forced plasmon oscillation seems to cause excited regions at the silver nanoparticles where adsorbed silver ions are preferably photoreduced. This results in the possibility of tailoring the morphology and therefore the optical properties of the growing nanoparticles.
Introduction
Because of their unique properties, silver nanoparticles (AgNPs) have become a valuable material for many applications. Conductive inks1 for electric interconnects2 and MEMS3 utilize their high electric conductivity and low sintering temperatures;4 different sensing principles like surface enhanced Raman scattering (SERS),5 surface enhanced fluorescence,6 surface plasmon resonance (SPR) spectroscopy7 as well as numerous biomedical applications8 utilize the unique optical properties of AgNPs. The physical and chemical properties of AgNPs highly depend on their size and morphology.9 To address all the mentioned applications by controlling the morphology and size of nanoparticles many synthesis routines have been investigated.In general, AgNPs can be synthesized using physical,10–13 chemical,14–16 photochemical,17–20 or biological methods.21–24 Chemical and photochemical reduction methods have been demonstrated to be the most appropriate to control the morphology and size of AgNPs. In this contribution photochemical synthesis is used to generate the AgNPs. It can be split into two main steps including the reduction of Ag salts like Ag nitrate (AgNO3) using a photo initiator,25,26 and preventing the forming AgNPs from agglomeration by adding a stabilizing agent.27 In the literature a variety of different stabilizing agents such as citrate, gallic acid, sodium dodecyl sulfate,28 and many polymers like poly(vinyl alcohol), polyethylene glycol, polyvinylpyrrolidone, poly(methyl methacrylate), and polyethylenimine29–31 (PEI) were investigated.
All these reduction and shaping methods are performed using a solvent as supporting matrix. Only a few methods report of solid polymers as a matrix to produce and stabilize AgNPs.18,32–35 In these cases the resulting nanoparticles appeared to be spherical with an absorption peak at ≈400 nm. Although morphology adapted AgNPs embedded within polymer layers could address a variety of applications there is no report about tailoring the nanoparticle morphology within a polymer layer, yet.
In this contribution we present a novel routine to grow and reshape AgNPs inside a PEI layer and thus tailor their absorption characteristics. This enables novel applications like in situ production of the emission filter in a lab-on-a-chip (LoC) fluorescence light detection setup.36 The emission filter is necessary to shield the detector from excitation light. In the past different light filter concepts for integration into LoC systems have been studied such as polarization filters,37 colorant filters,38,39 interference filters,39 and liquid crystal filters.40 All these filter concepts have different advantages and disadvantages. Colorant filters for example have a high transmission (>95%) in their transmission band compared to polarization filters (<50%). Their drawback is their potential use in only one special application and therefore the application dependent choice of specific colorants. By introducing silver nanoparticles as absorbing media this contribution presents a novel routine to overcome this issue. The surface plasmon resonance of the nanoparticles can be shifted within the visible spectrum, tailored to specific light absorption properties, and therefore replace many different colorants and production methods with one simple in situ tailoring.
Novel light filter tailoring within LoC
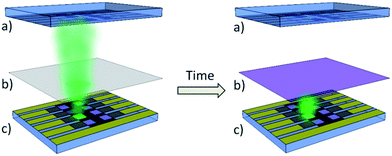
Fluorescent light detectors include a light source to excite the fluorescent light, a photodetector to detect the fluorescent light, and filters to separate the fluorescent light signal from the excitation light signal. To be cost efficient such setups can be constructed using fully solution processed organic light emitting electrochemical cells and fully solution processed organic photodiodes (OPD).36 In order to not joining them separately but directly integrating them onto a LoC the light filters have to be solution processed, too. Only colorant filters are reported to be solution processable so far. However, with their fixed light absorption properties they severely limit the potential versatility of a broad spectrum absorbing OPD to very few fluorescent dyes. Tailorable light absorption properties of solution processable layers would dramatically increase the variety of usable fluorescent dyes. Furthermore, they enable the use of the whole spectral potential of the OPD. Therefore they could provide a very cost efficient solution for integrating an OPD with emission filter onto LoC with addressing many different applications. The emission filter should absorb the excitation light. A smart way to tailor the filter properties would be to use the excitation light source to make the filter absorbing exactly its light spectrum. Fig. 1 shows a scheme of how the light tailoring of filters could be used within fluorescent light detectors.As we showed earlier the morphology and therefore the absorption properties of silver nanoparticles in water can be tailored by illuminating them with VIS-light.41 The possibility of affecting their properties within polymer layers is discussed in this contribution.
Experimental
Materials and characterization
Silver nitrate (99.99%), 2-hydroxy-4′-(2-hydroxyethoxy)-2-methylpropiophenone (I2959) (98%), sodium citrate dihydrate (99%) and branched polyethyleneimine (PEI) were purchased from Sigma Aldrich. Ethanol was used as solvent for ink preparation and deionized water was used for preparing the suspensions for SEM sample preparation. All chemicals and solvents used in this work were of analytical grade and used without further purification. The layer thicknesses of the deposited layers were measured using a Zygo 600N white light interferometer. Absorption spectra of the inks and PEI thin films were recorded on the PerkinElmer UV-Vis spectrometer Lambda 950 at room temperature in air. Baseline correction was performed prior to all measurements. The nanoparticle shape was characterized using a Zeiss SEM. The nanoparticle generation and light treatment were done using a Hönle AG bluepoint 4 UV-lamp and green Cree high power LEDs.Solution and layer preparation
Four seed solutions with different Ag contents were prepared out of an ethanol stock solution containing 20 mg ml−1 silver nitrate, 10 mg ml−1 I2959 and 50 mg ml−1 PEI. To increase the solubility of silver nitrate and I2959 in the ethanol solution the PEI had to be dissolved first. The solution was ultra-sonicated for 30 min and then stirred for another 30 min at room temperature. The solution was diluted with 50 mg ml−1 of PEI in ethanol to reduce the Ag content, resulting in solutions containing 5 mg ml−1, 10 mg ml−1, 15 mg ml−1, and 20 mg ml−1 silver nitrate. All solutions were illuminated with 14 W cm−2 UV-light (bluepoint 4) for 40 s to generate spherical nanoparticle seeds, which should grow and reshape while illuminating them with VIS-light.The resulting pretreated seed inks were spin coated in air on microscope glass slides using an Ossila desktop spin coater at 500 rpm for 60 s. For better surface wetting and homogeneity the glass slides were cleaned and plasma treated before the deposition. To remove the solvent from the as deposited layers the samples were vacuum dried for 10 min. The thickness of the dried layers was measured with a white light interferometer and determined to be 500 nm. Afterwards, the samples were stored in nitrogen atmosphere to prevent the AgNPs from oxidation.
All samples were treated in air at room temperature or 70 °C in a self-made reaction chamber using two green high-power Cree LEDs with a peak emission at 530 nm. The LEDs were operated at 200 mA for different time periods. For spectra comparison and SEM sample preparation water based seed solutions containing 1 mM Ag, 1 mM I2959 and 5 mM sodium citrate dihydrate were also light treated at room temperature. To prepare the samples for the SEM observation the treated suspensions were drop-casted and dried on cleaned silicon wafers. The optical spectra of all samples were measured in the range of 320 nm to 860 nm.
Results and discussion
A solution of PEI, AgNO3 and 2-hydroxy-4′-(2-hydroxyethoxy)-2-methylpropiophenone (I-2959) in ethanol was UV-irradiated to generate silver seeds. The resulting solution was spin-coated on glass to deposit AgNPs containing PEI layers. Following a photochemical approach the morphology and size of AgNPs can be tailored by LED light illumination.25 Therefore the PEI layers were irradiated with green LEDs (peak wavelength 530 nm) to change the AgNPs morphology (the experimental details are reported in the Experimental section).To investigate the nanoparticle evolution and to identify the morphology of the AgNPs SEM-imaging has to be used. However, since the AgNPs within the PEI layers are embedded in a nonconductive matrix sufficient SEM-imaging is impossible. Furthermore, dissolving the coloured PEI-layers in ethanol or water led to an oxidation and decomposition of the AgNPs. Therefore, AgNP suspensions in water were prepared to enable this observation. By comparing the optical spectra of the treated suspensions and the PEI layers conclusions about the AgNP morphology within these layers are possible.
Optical characterization of AgNP suspensions in water
Fig. 2 shows the resulting spectra and a photograph of AgNPs suspension samples in water with different treatment times (increasing from left to right) by green light irradiation.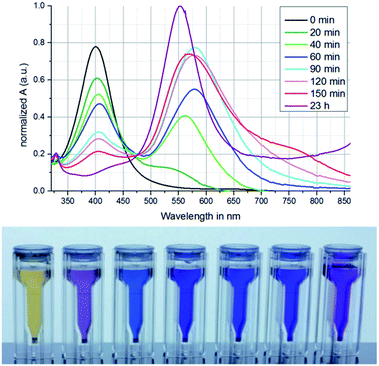 | ||
| Fig. 2 Absorption spectra and corresponding samples of AgNP-suspensions (increasing irradiation time from left to right) illuminated with green light in the range of 20 min to 23 h. | ||
In advance all samples were treated with UV light to generate spherical AgNP seeds. The seed sample (0 min) shows a large absorption peak at ≈400 nm. This indicates the formation of spherical AgNPs.25 With increasing time of green light irradiation the peak at 400 nm decreases and an absorption peak at ≈560 nm increases after 20 min. Until a treatment duration of 120 min the absorption peak shifts to ≈575 nm and then back to ≈550 nm for 23 h of irradiation time. This indicates a nanoparticle evolution initiated by the green light exposure. The number of spherical shaped AgNPs decreases leading to the decrease of the peak at ≈400 nm whereas the number of differently shaped AgNPs increases.25 That means that the nanoparticles start to reshape while irradiation. During this evolution the AgNPs pass different morphologies which at the same time lead to changes in the absorption signal. The reshaping can only occur when the AgNPs grow at the same time. The whole process can be explained by excited regions at the AgNPs because of the forced plasmon oscillation during the green light irradiation. At these excited positions adsorbed Ag-ions get photoreduced, resulting in nanoparticle growth to a certain shape.26 The impact of irradiation treatment is also observable by a color change of the suspensions as shown in Fig. 2b. After green light irradiation the colour changes from yellow to purple and blue with increasing treatment time. The experiment was stopped after 23 h because the nanoparticles started to agglomerate (not shown here).
SEM characterization of AgNPs
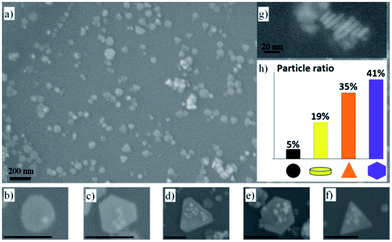
To investigate the nanoparticle evolution during the light treatment we chose a sample with both peaks at 400 nm and ≈550 nm corresponding to different evolution states. The sample treated for 150 min is the most appropriated for this purpose, since the evolution of the nanoparticles should be the most advanced without being completed. Within this sample many differently shaped nanoparticles were found (see Fig. 3). Besides small spherical nanoparticles there are circular plates, irregular hexagonal plates, regular hexagonal plates, and triangular plates. Fig. 3h shows the ratio of the different shapes found in the sample. Stamplecoskie et al.25 describe a conversion of all nanoparticles from spherical shapes to differently shaped nanoplates. With 505 nm illumination they produced hexagonal nanoplates and with 590/627 nm illumination triangular nanoplates were grown. However, our findings indicate that not all nanoparticles start shaping at the same time. Furthermore, our chosen emission peak of the LED at 530 nm seems to promote the formation of hexagonal plates and triangular plates. The surface plasmon resonance of these different shaped nanoplates highly depends on their size and final morphology. Therefore, hexagonal nanoplates25 as well as triangular nanoplates42 can show comparable absorption spectra.For explaining nanoplates of different sizes within our sample we suggest a novel evolution route of hexagonal and triangular nanoplates under constant LED irradiation based on the work of Maillard et al.26 and Stamplecoskie et al.25
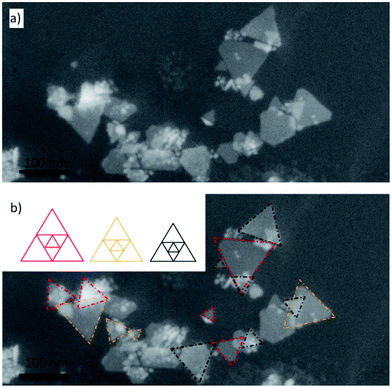
The general evolution process can be split into three different phases (Fig. 4a). At first, spherical AgNPs form under UV-light irradiation.25 In a second step circular disc-like nanoplates form because of the irradiation with VIS-light.26 Fig. 3g shows that within our sample nanoplates with different diameters have approximately the same thicknesses. This indicates that at a certain point the particle growth only occurs in plane direction. In a third step these disc-like nanoplates grow resulting in different morphologies. Maillard et al.26 explained the growth mechanism with excited regions at the nanoparticles, where adsorbed Ag-ions get reduced. They assigned a key role to citrate. In their opinion the nanoplates grow in disc-like shapes until irregularities occur. Because of the formation of these irregularities other nanoparticle shapes start to form. We believe that in our case small disc-like particles grow to small triangular nanoplates. After finishing the triangular shape the nanoparticles will grow forming irregular hexagonal shapes, passing regular hexagons resulting in larger triangles again (see Fig. 4b). Therefore, all “evolution states” in many different sizes can be found within our sample (see Fig. 3h). To further verify this theory effective triangular shapes of hexagonal and triangular nanoplates were compared. Therefore, the long sides of the hexagons were extended until they overlapped. Fig. 5a shows triangular and hexagonal nanoparticles found in our sample and Fig. 5b the same particles with their effective triangular profiles indicated by the different coloured frames. The different frame colours correspond to different sizes of the disc-like nanoplates, at which the irregularities formed. By comparing these triangular frames between particles highlighted with the same frame colour the predicted size relation of the evolution theory was confirmed (compare Fig. 4b and 5b). The biggest nanoparticles show exactly four times the area of the medium sized nanoparticles which show exactly four times the area of the smallest nanoparticles. Therefore, it can be assumed that small triangles grow to hexagons and larger triangles as described before and in Fig. 4.
AgNP shaping in PEI thin films
Within PEI thin films including embedded Ag-nanoparticles we also observed a change of the absorption spectra caused by green LED light irradiation. Absorption peaks comparable to the peaks in water were found indicating the same nanoparticle reshaping within these films as well. As mentioned before, Maillard et al.26 assign a key role for the reshaping to citrate. However, in the shown case no citrate is present, proving that PEI can also act as a capping ligand and a photoreducing agent for sufficient nanoparticle shaping. In addition, depending on the temperature and the Ag-precursor concentration within the PEI the resulting absorption spectra tremendously deviated from each other. Our findings are discussed in the next chapters.Temperature dependency
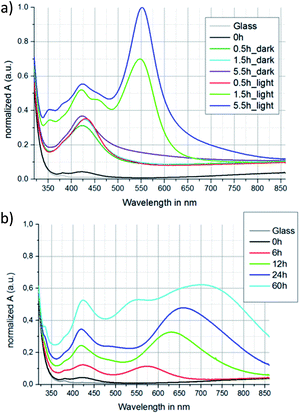
The temperature effect on the nanoparticle evolution in the PEI-layers is exemplarily discussed for the samples deposited from a solution containing 5 mg ml−1 silver nitrate. They were irradiated at room temperature or at 70 °C for different time periods. The 0 h sample indicates the PEI-sample before treatment.For comparison, samples without illumination were heated to 70 °C as well. For the non-irradiated samples there is a prominent increase of the absorption peak at ≈420 nm (see Fig. 6a labeled “dark”). This indicates a temperature driven growth and generation of spherical Ag-nanoparticles within the PEI-layer respectively. Compared to suspensions in water the absorption peak is slightly red-shifted because of the different dielectric behavior of PEI. The samples irradiated at 70 °C show a comparable behavior to the suspensions in water. We found an increasing absorption peak at ≈550 nm with increasing irradiation time. As shown before, this indicates the growth of triangular and hexagonal silver nanoplates. On the other hand an absorption peak at ≈420 nm increases as well, even more than after pure heat treatment of the samples. Regarding the irradiated suspensions in water this peak decreased indicating a decrease in the number of spherical nanoparticles. The further growth of these particles within the PEI-layers during irradiation could be influenced by Ag-atom diffusion on the nanoparticle surface which is supposed to have a more prominent impact on the nanoparticle growth in the PEI than for the nanoparticle growth in a solvent like water.
In water the nanoparticle growth is dominated by Ag-ion diffusion to and adsorption at the excited regions at the irradiated nanoparticles. The ions get photoreduced at the excited regions leading to directed nanoparticle growth. As a counterforce to this directed growing the reduced Ag-atoms start to migrate on the nanoparticle surface. Since the surface to volume ratio of the differently shaped nanoplates is larger than for nanospheres, the Ag-atoms will diffuse to positions at the particles corresponding to spherical shapes. However, the Ag-atom diffusion at the surface of the nanoparticles is too slow to prevent the spherical nanoparticles from changing their shape. Therefore, the plate-like particles grow dominantly.
Within the PEI-layer the diffusion of Ag-ions is much slower leading to a slower formation rate of the nanoplates. Even though the Ag-ions preferably reduce at the excited regions at the nanoparticles the Ag-atoms will migrate at the particle surface resulting in the reshaping of the forming nanoplates. The absorption peak at ≈420 nm (spherical nanoparticles) and a much larger peak at ≈550 nm (hexagonal and triangular nanoplates) of the measured spectra indicate that the Ag-atom diffusion at the nanoparticle surface is slower than Ag-ion diffusion to the nanoparticles. Therefore, the growth of the nanoplates is still faster than the reshaping to nanospheres. However, the Ag-atom diffusion has a measurable impact on the nanoparticle shaping. Therefore, both nanoparticle types will grow leading to increasing absorption peaks at ≈420 nm and ≈550 nm.
However, the elevated temperature still leads to a higher diffusion rate of the Ag-ions inside the PEI-layer, and therefore to an increased evolution speed of the hexagonal and triangular nanoplates compared to room temperature treatment. The very large absorption peak at ≈550 nm can be observed after only 5.5 h of constant irradiation (Fig. 6a). Longer irradiation periods lead to an increase of light absorption in the range of the whole measured spectra, and a color change of the films from light purple to grey occured. This indicates agglomeration of the nanoparticles also observable in water.25,26
Irradiation at room temperature also leads to a change in the absorption spectra of the layers, indicating a nanoparticle growth and reshaping as well (Fig. 6b). However, the diffusion of the Ag-ions within the PEI-layers is much slower than at 70 °C leading to longer evolution time periods. For increasing irradiation time an increasing absorption peak at ≈420 nm can be observed again indicating the generation and growth of spherical AgNPs. A second peak increases with increasing irradiation time starting from ≈570 nm observed after 6 h but shifting to ≈700 nm after 60 h. This behavior differs from the samples irradiated at 70 °C. A reason could be the low Ag-ion diffusion rate respectively the low Ag-seed generation rate at room temperature. Therefore, a smaller number of nanoparticles will consume more Ag-ions. This leads to a growth of a few big nanoplates instead of many smaller ones. We suggest the nanoparticle growth mechanism as schematically shown in Fig. 4b. Therefore, the growth of hexagonal and triangular plates of appropriate sizes for SPR at ≈550 nm is promoted for time periods up to 6 h. However, with increasing time the particles get much bigger. Since the SPR of the particles depends on their size and shape42 the growth of the nanoplates leads to a shift of the absorption peak to longer wavelength. With increasing time periods the variety of different nanoparticle morphologies and sizes increases. Therefore, the absorption peaks of many differently sized and shaped particles overlap, leading to a broad absorption signal within the whole measured spectrum. Nevertheless, the prominent peaks at ≈420 nm and ≈700 nm indicate a preferred nanoparticle shape evolution, too.
Concentration dependency
To investigate the influence of the silver concentration on the nanoparticle evolution and the absorption properties of the PEI-layers, four different Ag concentrations were studied (see Table 1). All samples were irradiated at room temperature.| Sample ID | Ag concentration in solution |
|---|---|
| A | 5 mg ml−1 |
| B | 10 mg ml−1 |
| C | 15 mg ml−1 |
| D | 20 mg ml−1 |
Fig. 7 shows the absorption spectra of the treated samples normalized to the absorption peak of 60 h irradiation treatment of sample D. The principle trend of all concentrations is comparable. With increasing time an absorption peak at ≈420 nm increases indicating the formation and growth of spherical silver nanoparticles again. With increasing concentration absorbance increases as well. After 60 hours of treatment the sample A shows 26% absorbance and sample B 46% absorbance compared to the peak value of sample D. These values are in good accordance to the respective concentration ratio and therefore indicate a proportional nanoparticle formation and growth rate for all investigated concentrations. However, sample C shows 84% absorbance compared to the peak value of sample D. This might be caused by some inhomogeneity of the irradiation during the treatment. All samples show a shift of the increasing absorption peak starting at ≈570 nm after 6 h and shifting to ≈700 nm after 60 h of irradiation. This indicates a preferred nanoparticle morphology within these layers, too.
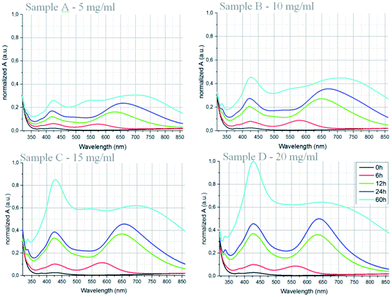 | ||
| Fig. 7 Absorption spectra of the samples A, B, C and D treated for different time periods at room temperature. | ||
However, the absorption peak at ≈650 nm indicates different shapes and/or sizes compared to the previously found hexagonal and triangular plates. The spectra of sample C and D show more prominent peaks until 24 h of irradiation treatment than the samples A and B. The higher Ag-concentration and therefore the larger number of nanoparticles causes a faster nanoparticle growth. However, after 60 h the 420 nm absorbance peaks increased further whereas the ≈700 nm peak widens to an absorption band from 500 nm to 750 nm with a relative absorbance of 60% for both samples C and D. This indicates an increasing morphology and/or size distribution of the nanoplates. This distribution leads to a variety of different SPR of the nanoplates within the optical wavelength range of 550 nm to 700 nm.
For all samples a growing absorption peak at ≈550 nm can be observed after 60 h of constant irradiation treatment. This peak can be correlated to the triangular and hexagonal nanoplates again which also form during the irradiation at 70 °C.
Conclusions
In this contribution we presented nanoparticle shaping within a polymer layer for the first time. Using this method we can control the morphology and therefore the optical properties of AgNPs within PEI-layers. The surface plasmon resonance of AgNPs embedded in this transparent polymer matrix is tailored by a nanoparticle evolution triggered by green light irradiation. The treatment temperature was found to play a significant role for the evolution of different nanoparticle shapes with high influence on the resulting absorption spectra and the necessary treatment time. The change in the equilibrium of Ag-atom diffusion rate at the nanoparticle surface and the Ag-ion diffusion rate inside the PEI thin films is suspected to be the reason for this impact. Furthermore, the concentration of Ag within the PEI-layers was found to influence the peak height of the increasing absorption peaks. The formed nanoparticle morphologies were observed by SEM-imaging. Different nanoparticle evolution states starting from spherical nanoparticles towards triangular and irregular and regular hexagonal nanoplates were observed in water suspensions. Because similar optical properties were observed within the PEI-layers we assume the same nanoparticle evolution process. These observations result in a novel hypothesis for the evolution of hexagonal and triangular shaped nanoplates. The SEM-images indicate that the growing nanoplates change their morphology from triangular to hexagonal and to larger triangles again.To start the evolution within the PEI-layers we used two green LEDs operated at 200 mA for at least 1.5 h at 70 °C. A possible application could be adaptable light filters for lab-on-a-chip fluorescent light detection. Lab-on-a-chip applications in the point of care market address short times and relatively low light intensities for measurement. The introduced routine clearly shows its potential to tailor optical filter properties for the use in these applications.
Conflicts of interest
There are no conflicts to declare.Acknowledgements
The work presented in this paper was funded by the German Federal Ministry of Education and Research (BMBF) within the joint research project “Handy-LoC” (FKZ 13N13717).References
- A. Alastalo, Technologies and Applications for Printed Conductors, 2008 Search PubMed.
- S. Molesa, D. R. Redinger, D. C. Huang and V. Subramanian, MRS Online Proc. Libr., 2003, 769, H8.3 Search PubMed.
- R. Venkata Krishna Rao, K. Venkata Abhinav, P. S. Karthik and S. P. Singh, RSC Adv., 2015, 5, 77760–77790 RSC.
- M. L. Allen, Nanoparticle Sintering Methods and Applications for Printed Electronics, Aalto University, Helsinki, Finland, 2011 Search PubMed.
- K. G. Stamplecoskie, J. C. Scaiano, V. S. Tiwari and H. Anis, J. Phys. Chem. C, 2011, 115, 1403–1409 CAS.
- A. Sánchez-González, S. Corni and B. Mennucci, J. Phys. Chem. C, 2011, 115, 5450–5460 Search PubMed.
- R. A. Sperling, Angew. Chem., Int. Ed., 2009, 48, 7289 CrossRef CAS.
- L. Mahmudin, E. Suharyadi, A. Bambang, S. Utomo and K. Abraha, J. Mod. Phys., 2015, 6, 1071–1076 CrossRef.
- Y. Xia and N. J. Halas, MRS Bull., 2011, 30, 338–348 CrossRef.
- J. Siegel, O. Kvítek, P. Ulbrich, Z. Kolská, P. Slepička and V. Švorčík, Mater. Lett., 2012, 89, 47–50 CrossRef CAS.
- D.-C. Tien, K.-H. Tseng, C.-Y. Liao, J.-C. Huang and T.-T. Tsung, J. Alloys Compd., 2008, 463, 408–411 CrossRef CAS.
- J. H. Jung, H. Cheol Oh, H. Soo Noh, J. H. Ji and S. Soo Kim, J. Aerosol Sci., 2006, 37, 1662–1670 CrossRef CAS.
- D. K. Lee and Y. S. Kang, ETRI J., 2004, 26, 252–256 CrossRef.
- Q. Wang, S. T. Quek, C. T. Sun and X. Liu, Smart Mater. Struct., 2001, 10, 229 CrossRef.
- C. M. Cobley, S. E. Skrabalak, D. J. Campbell and Y. Xia, Plasmonics, 2009, 4, 171–179 CrossRef CAS.
- M. Chen, Y. G. Feng, X. Wang, T. C. Li, J. Y. Zhang and D. J. Qian, Langmuir, 2007, 23, 5296–5304 CrossRef CAS PubMed.
- A. J. Christy and M. Umadevi, Adv. Nat. Sci.: Nanosci. Nanotechnol., 2012, 3, 35013–35014 CrossRef.
- M. Sakamoto, M. Fujistuka and T. Majima, J. Photochem. Photobiol., C, 2009, 10, 33–56 CrossRef CAS.
- R. Sato-Berrú, R. Redón, A. Vázquez-Olmos and J. M. Saniger, J. Raman Spectrosc., 2009, 40, 376–380 CrossRef.
- S. Kumar Ghosh, S. Kundu, M. Mandal, S. Nath and T. Pal, J. Nanopart. Res., 2003, 5, 577–587 CrossRef.
- J. I. Hussain, Adv. Mater. Lett., 2011, 2, 188–194 CrossRef CAS.
- K. M. M. Abou El-Nour, A. Eftaiha, A. Al-Warthan and R. A. A. Ammar, Arabian J. Chem., 2010, 3, 135–140 CrossRef CAS.
- A. K. Suresh, D. A. Pelletier, W. Wang, J.-W. Moon, B. Gu, N. P. Mortensen, D. P. Allison, D. C. Joy, T. J. Phelps and M. J. Doktycz, Environ. Sci. Technol., 2010, 44, 5210–5215 CrossRef CAS PubMed.
- L. Sintubin, W. Verstraete and N. Boon, Biotechnol. Bioeng., 2012, 109, 2422–2436 CrossRef CAS PubMed.
- K. G. Stamplecoskie and J. C. Scaiano, J. Am. Chem. Soc., 2010, 132, 1825–1827 CrossRef CAS PubMed.
- M. Maillard, P. Huang and L. Brus, Nano Lett., 2003, 3, 1611–1615 CrossRef CAS.
- I. Pastoriza-Santos and L. M. Liz-Marzán, Langmuir, 1999, 15, 948–951 CrossRef CAS.
- Y. D. Sosa, M. Rabelero, M. E. Treviño, H. Saade and R. G. López, J. Nanomater., 2010, 2010, 1–6 CrossRef.
- M. P. Neupane, S. J. Lee, I. S. Park, M. H. Lee, T. S. Bae, Y. Kuboki, M. Uo and F. Watari, J. Nanopart. Res., 2011, 13, 491–498 CrossRef CAS.
- C. A. dos Santos, A. F. Jozala, A. Pessoa and M. M. Seckler, J. Nanobiotechnol., 2012, 10(1), 43 CrossRef CAS PubMed.
- A. Shkilnyy, M. Soucé, P. Dubois, F. Warmont, M.-L. Saboungi and I. Chourpa, Analyst, 2009, 134, 1868 RSC.
- W. Fritzsche, H. Porwol, A. Wiegand, S. Bornmann and J. M. Köhler, Nanostruct. Mater., 1998, 10, 89–97 CrossRef CAS.
- R. Nazar, S. Ronchetti, I. Roppolo, M. Sangermano and R. M. Bongiovanni, Macromol. Mater. Eng., 2015, 300, 226–233 CrossRef CAS.
- H. Takele, H. Greve, C. Pochstein, V. Zaporojtchenko and F. Faupel, Nanotechnology, 2006, 17, 3499–3505 CrossRef CAS PubMed.
- G. V Ramesh, S. Porel and T. P. Radhakrishnan, Chem. Soc. Rev., 2009, 38, 2646 RSC.
- Z. Shu, F. Kemper, E. Beckert, R. Eberhardt, A. Tünnermann, L. Edman, S. Inal, P. Pingel, K. Fostiropoulos, N. Koch, D. Neher and W. Ma, RSC Adv., 2017, 7, 26384–26391 RSC.
- A. Pais, A. Banerjee, D. Klotzkin and I. Papautsky, Lab Chip, 2008, 8, 794–800 RSC.
- A. Llobera, S. Demming, H. N. Joensson, J. Vila-Planas, H. Andersson-Svahn and S. Büttgenbach, Lab Chip, 2010, 10, 1987–1992 RSC.
- C. Richard, A. Renaudin, V. Aimez and P. G. Charette, Lab Chip, 2009, 9, 1371–1376 RSC.
- J. G. Cuennet, A. E. Vasdekis and D. Psaltis, Lab Chip, 2013, 13, 2721–2726 RSC.
- F. Kemper, E. Beckert, R. Eberhardt and A. Tünnermann, in Smart Systems Integration 2016-International Conference and Exhibition on Integration Issues of Miniaturized Systems, SSI 2016, 2016 Search PubMed.
- K. L. Kelly, E. Coronado, L. L. Zhao and G. C. Schatz, J. Phys. Chem. B, 2003, 107, 668–677 CrossRef CAS.
| This journal is © The Royal Society of Chemistry 2017 |

