 Open Access Article
Hydrothermal synthesis of nitrogen-doped carbon quantum dots from microcrystalline cellulose for the detection of Fe3+ ions in an acidic environment
Peng Wuab,
Wei Lia,
Qiong Wua,
Yushan Liua and
Shouxin Liu *a
*a
aCollege of Materials Science and Engineering, Northeast Forestry University, Harbin, 150040, P. R. China. E-mail: liushouxin@126.com; Fax: +86-451-82191204; Tel: +86-451-82191204
bCollege of Environmental and Chemical Engineering, Heilongjiang University of Science and Technology, Harbin 150022, P. R. China
First published on 12th September 2017
Abstract
Nitrogen-doped carbon quantum dots (NCQDs) have been synthesized by the hydrothermal method with microcrystalline cellulose as carbon source and ethylenediamine as nitrogen dopant. The synthesized NCQDs were characterized by FT-IR, TEM, XPS, UV-vis, XRD and fluorescence emission spectroscopy. It was found that nitrogen species were efficiently doped into the carbon framework of the CQDs. The obtained NCQDs were spherical particles with an average diameter of 3.2 nm. Furthermore, the NCQDs showed better fluorescence emission properties and higher quantum yield in acidic solution than CQDs. When used as a fluorescent probe for Fe3+ detection via fluorescent quenching, high selectivity and sensitivity were achieved, and the limit of detection of Fe3+ was as low as 0.21 nM in the acidic environment. The quenching process of NCQDs by Fe3+ was proved to be a dynamic quenching by using fluorescence decay times analysis.
1. Introduction
Carbon quantum dots (CQDs), which consist of carbon, hydrogen, and oxygen, are fluorescent nanoparticles with diameters smaller than 10 nm.1 Since the first report in 2004,2 CQDs have become an important class of fluorescent nanoparticles due to their useful physical and chemical properties including high fluorescence intensity,3 easy surface functionalization,4 good solubility,5 low toxicity, and good biocompatibility.6Recently, various methods including electrochemical synthesis,7 combustion oxidation,8 thermal decomposition,9 microwave,10,11 ultrasonic,12 and hydrothermal synthesis13 have been reported to prepare CQDs, among them, hydrothermal synthesis is considered to be the most accessible method because of its simple operating conditions, low energy consumption, and low-cost apparatus.14,15 However, CQDs prepared via this synthesis method often suffer from low fluorescence quantum yield (QY) of <10%.14–16 Therefore, much attention was paid on improving the QY and optical performance of CQDs, among which doping CQDs with other elements, especial with nitrogen, has been found to be an effective way.16–19 Nitrogen-doped CQDs (NCQDs) can not only retain the various advantages of CQDs, but also overcome their inherent defects, which have been widely applied in catalysis,20 ion probes,16,18 biological imaging,10 and other fields.21,22 Particularly, when it was used as fluorescent probe for detecting metal ions such as Hg2+, Fe3+, Cu2+, Pb2+, and Sn2+, NCQDs was more sensitive than undoped CQDs.23–25 However, as so far, most of the reports about detection of heavy metal ions are all carried out in neutral environment due to the hydrolysis of metal ions or weaker fluorescence emission intensity of NCQDs in acidic conditions. It is generally known, even under neutral conditions, the solubility of many metal ions is very small because metal ions would combine with OH− and precipitate, which is not conducive to the reaction between of NCQD and metal ions, and the fluorescence intensity of quantum dots is not well quenched. So, the sensitivity and accuracy of fluorescence detection for easily hydrolyzed metal ions, especially the heavy metal ions, are limited by pH environment. In addition, some NCQDs used as metal ion probes are fragile under acidic conditions,24,26 which also restricts their application in the fields of environmental pollution and heavy metal detection. Therefore, prepared a strong acid resistance NCQDs is still the research focus in the field of heavy metal ion detection.
On the other hand, the carbon sources used to prepare NCQDs also has great influence on its QY and optical properties. Carbon sources that can be used to prepare carbon dots are roughly classified into three categories, graphite-based carbon raw materials,4,5 polymer compounds,27 and other small molecule compounds such as amino acids, glycerol, and citric acid.1,28,29 CQDs prepared by graphite-based carbon source often require secondary modification to obtain fluorescence and the preparation process is complex. Polymer compounds and small molecule compounds often have the disadvantage of complicated structure, expensive materials or toxicity. Therefore, screening a carbon source with the characteristics of non-toxic, extensively available, and stable composition is still a key concern in the CQDs preparation field. Cellulose is a linear natural polymer consisting of 1,4-anhydro-D-glucopyranose units, and it is the most abundant renewable macromolecular compounds in nature and represents about fifty percent of natural biomass.30 Cellulose also has many important properties, such as low price, environment-friendly, non-toxic, good biocompatibility and stable chemical properties. Moreover, the cellulose molecule also contains a large amount of hydroxyl and ether groups, which could provide the elemental and structural basis for the formation of CQDs. However, it is still difficult to form CQDs under normal pressure and room temperature due to the stable chemical properties of cellulose. Fortunately, in our previous works, two kinds of water-soluble fluorescent CQDs were successfully prepared by the pentosan and larch with hydrothermal method,20,31 indicating that CQDs could be obtained from a plant source material containing cellulose via the thermal degradation and carbonization processes during the hydrothermal treatment.
In this work, NCQDs was fabricated via a facile and low cost one-step hydrothermal treatment using the eco-friendly, extensively available, and stable composition carbon source of microcrystalline cellulose and the nitrogen dopant of ethylenediamine, respectively. The obtained NCQDs exhibited blue fluorescence with better optical properties and high quantum yield compared to CQDs. Due to the excellent fluorescence stability under acidic conditions, the NCQDs was successfully applied as a fluorescent probe for detecting Fe3+ ions in strong acidic environment, and good selectivity and sensitivity to Fe3+ ions were obtained. It shows a wide linear detection range (10–500 μM) and a low limit of detection (LOD) as low as 0.21 nM for Fe3+ ion, which made this probe a suitable candidate for Fe3+ detection at acid conditions. The measurement results of Fe3+ in leaching solution of iron ore tailings verified this and manifested their potential in practical applications.
2. Experimental section
2.1 Materials
Ethylenediamine and microcrystalline cellulose were obtained from Kermel Chemical Reagent Co. (Tianjin, P. R. China). AlCl3, CaCl2, CuCl2, FeCl3, FeCl2, MgCl2, MnSO4, NiCl2, NaCl, SnCl2, ZnCl2, HCl, and H2SO4 were purchased from Guangfu Technology Development Co., Ltd. (Tianjin, P. R. China). All chemical reagents were of analytical grade and were used as received. Deionized water was used throughout all experiments.2.2 Preparation of nitrogen-doped CQDs
Firstly, solution of ethylenediamine with a constant carbon-to-nitrogen mole ratio of 1![[thin space (1/6-em)]](https://www.rsc.org/images/entities/char_2009.gif) :
:![[thin space (1/6-em)]](https://www.rsc.org/images/entities/char_2009.gif) 0.8 was prepared. Then, 2.0 g of microcrystalline cellulose was added to the ethylenediamine solution (60 ml). Comparatively, 2.0 g of microcrystalline cellulose in 60 ml of water was also prepared as a blank sample. The two obtained solutions were placed in p-polyphenol-lined stainless steel autoclaves, respectively. The autoclaves were sealed and heated in an oven for 12 h at 240 °C, and then allowed to cool to room temperature. The products were centrifuged at 10
0.8 was prepared. Then, 2.0 g of microcrystalline cellulose was added to the ethylenediamine solution (60 ml). Comparatively, 2.0 g of microcrystalline cellulose in 60 ml of water was also prepared as a blank sample. The two obtained solutions were placed in p-polyphenol-lined stainless steel autoclaves, respectively. The autoclaves were sealed and heated in an oven for 12 h at 240 °C, and then allowed to cool to room temperature. The products were centrifuged at 10![[thin space (1/6-em)]](https://www.rsc.org/images/entities/char_2009.gif) 000 rpm for 10 min. The resulting suspensions containing NCQDs and CQDs were filtered through 0.22 μm filter membranes, and then subjected to dialysis (1000 Da molecular weight cut off) for about 72 h.
000 rpm for 10 min. The resulting suspensions containing NCQDs and CQDs were filtered through 0.22 μm filter membranes, and then subjected to dialysis (1000 Da molecular weight cut off) for about 72 h.
2.3 Characterization
A Tecnai G2 F20 electron microscope (FEI, Holland) with an acceleration voltage of 200 kV was used to obtain transmission electron microscopy (TEM) and high-resolution TEM (HRTEM) images. Fourier-transform infrared spectra (FT-IR) were recorded on a Perkin Elmer TV1900 instrument (Waltham, MA, USA). Spectra were recorded from 400 to 4000 cm−1, at a resolution of 4 cm−1. X-ray photoelectron spectra (XPS) were recorded on a Physical Electronics PHI 5400 spectrometer (Physical Electronics, USA), using Al-Kα radiation (hv = 1486.6 eV). Binding energies were referenced to the C1s line at 284.6 eV. UV-vis absorption spectra were obtained using a Specord S600 UV-vis spectrometer (Analytik Jena AG, Germany). X-ray diffraction (XRD) measurements were carried on D8 advance instrument (Bruker AXS, Germany) with Cu Kα radiation. Fluorescence emission spectra were recorded using a LS-55 fluorescence spectrophotometer (PerkinElmer, USA), equipped with a 120 W xenon lamp the excitation source. Fluorescence decay time was detected by a FluoroLog-3 fluorescence spectrophotometer (Jobin Yvon Inc., USA), and the excitation wavelength is 370 nm.2.4 Quantum yield measurements
The QY of NCQDs was calculated according to the literature.17 In brief, quinine sulfate (0.1 M H2SO4 as solvent), which QY is about 54%, was chosen as a reference standard. The UV absorbance of all the samples was adjusted to below 0.05 to minimize the inner filter effect. Then the calculation was performed according to the following equation:| Φu = Φs(Yu/Ys)(As/Au)(ηs/ηu)2 |
2.5 Metal ion detection
The NCQDs acidic solution was prepared by dissolving the NCQDs in hydrochloric acid solution (pH = 1) and then adjusted its UV absorbance to 0.10 Abs at the λabs = 360 nm. The various metal ion salt, such as FeCl3, FeCl2, AlCl3, CaCl2, CuCl2, MgCl2, MnSO4, NiCl2, NaCl, SnCl2, and ZnCl2, were also dissolved in hydrochloric acid solution (pH = 1) with the appropriate amount and adjusted their concentrations to 2 mM. In a typical detection experiment, 2 ml NCQDs solution was added into 2 ml metal ions solution to form the solution under test, and fluorescence intensity changes of it was measured after reaction for 3 min. To evaluate the sensitivity towards Fe3+, different concentration of 0.01 μM to 2 mM (pH = 1.0) were added into the NCQDs acidic solution and the mixed solution also reacted for 3 min before spectral measurements. All samples were excited at λ = 360 nm, and fluorescence emission intensities were recorded at a wavelength of 440 nm.3. Results and discussion
3.1 Synthesis and structure characterization of NCQDs
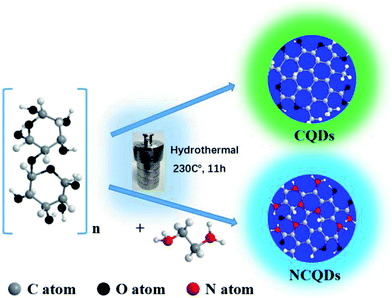
The preparation of the CQDs is based on the degradation, reduction, and carbonition of microcrystalline cellulose during hydrothermal condition at 240 °C for 12 h. As illustrated in Fig. 1, the schematic representation for the structure of CQDs contains a carbon nuclear and the oxygen-containing functional groups on the surface of it. When ethylenediamine was present in the reaction system, not only some nitrogen-containing functional groups were formed, but also N atoms (represented by red ball) were introduced into the carbon nuclear lattice through the high temperature hydrothermal process, and the NCQDs were obtained.Fig. 2a shows the TEM images of NCQDs sample. It is obvious that the synthesized NCQDs display spherical nanoparticles morphology, and the particles are uniform distributed without agglomeration. The size distributions of NCQDs are in the range of 0.5–6.5 nm, and the average diameter is about 3.2 nm (Fig. 2b). The HRTEM image (Fig. 2c) shows that most particles present an obvious lattice fringes, and the inset indicates that the NCQDs have a stripe-like structure with lattice spacing of 0.21 nm, which is close to the (100) diffraction facet of graphite carbon.18 This implies that the NCQDs possess a graphite-like structure.
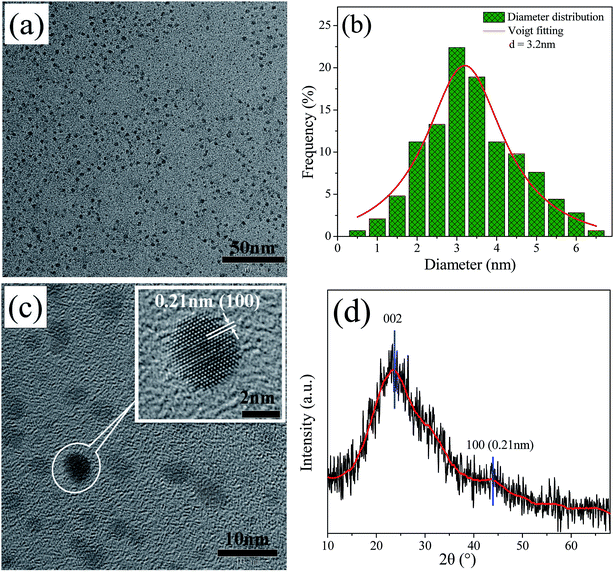 | ||
| Fig. 2 (a) TEM images, (b) the size distributions histogram, (c) HRTEM images, and (d) XRD pattern of NCQDs. Inset of (c) shows enlarged image of HRTEM. | ||
The XRD pattern of NCQDs is shown in Fig. 2d. A broad diffraction peak at 24.0° (d002 = 0.34 nm) and a weak peak at 43.4° (d100 = 0.21 nm) were observed in NCQDs, revealing an amorphous carbon phase and partial graphitization of NCQDs, which are attributed to the existence of abundant functional groups and graphitization of carbon atom,32 respectively. These results further confirmed that a graphite structure exists in the carbon core of NCQDs. All above results suggest that tiny carbon dots were obtained by the transformation of microcrystalline cellulose with ethylenediamine through the hydrothermal synthesis, and their carbon core structures were comparable to that of graphite.
Furthermore, the doping of N species in NCQDs was confirmed by FT-IR spectra and XPS spectra measurements. Fig. 3a displays the FT-IR spectra of NCQDs and CQDs. The characteristic absorption peaks of the CQDs at 3370, 2965, and 1680 cm−1 corresponds to O–H, C–H, and C![[double bond, length as m-dash]](https://www.rsc.org/images/entities/char_e001.gif) O stretching vibrations, respectively. The peak at 1400 cm−1 is attributed to the in-plane deformation of O–H.33 The peak at 1056 cm−1 is attributed to the C–O vibration of C–O–C groups. The FT-IR spectra of CQDs and NCQDs both presence an absorption peak at around 1580 cm−1, indicating the formation of unsaturated C
O stretching vibrations, respectively. The peak at 1400 cm−1 is attributed to the in-plane deformation of O–H.33 The peak at 1056 cm−1 is attributed to the C–O vibration of C–O–C groups. The FT-IR spectra of CQDs and NCQDs both presence an absorption peak at around 1580 cm−1, indicating the formation of unsaturated C![[double bond, length as m-dash]](https://www.rsc.org/images/entities/char_e001.gif) C bonds within carbon cores, which is consistent with other reports.34,35 Comparatively, the spectrum of NCQDs contains several special bands between 1210 cm−1 and 1680 cm−1, which correspond to the characteristic stretching vibration of CN bonds.36 In addition, the bending vibration of N–H also appears between 700 cm−1 and 830 cm−1, specifically, the peaks at 1646 cm−1, 1481 cm−1, 1334 cm−1 and 1270 cm−1 are assigned to the typical stretching modes of N–C
C bonds within carbon cores, which is consistent with other reports.34,35 Comparatively, the spectrum of NCQDs contains several special bands between 1210 cm−1 and 1680 cm−1, which correspond to the characteristic stretching vibration of CN bonds.36 In addition, the bending vibration of N–H also appears between 700 cm−1 and 830 cm−1, specifically, the peaks at 1646 cm−1, 1481 cm−1, 1334 cm−1 and 1270 cm−1 are assigned to the typical stretching modes of N–C![[double bond, length as m-dash]](https://www.rsc.org/images/entities/char_e001.gif) O, heterocyclic C–N–C, N–(C)3 and C–N–C bonds.37 These results confirmed that the N-containing groups were formed via chemical reaction between ethylenediamine and microcrystalline cellulose, and N species was efficiently doped into the framework of the CQDs.
O, heterocyclic C–N–C, N–(C)3 and C–N–C bonds.37 These results confirmed that the N-containing groups were formed via chemical reaction between ethylenediamine and microcrystalline cellulose, and N species was efficiently doped into the framework of the CQDs.
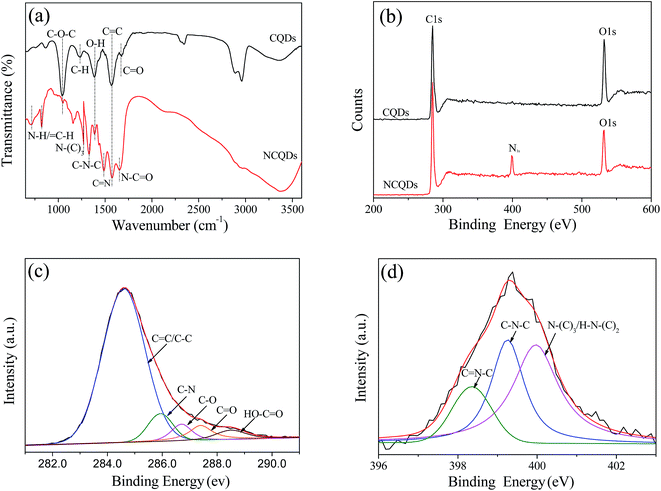 | ||
| Fig. 3 (a) FT-IR spectra of NCQDs and CQDs, (b) XPS survey spectrum of NCQDs and CQDs, (c) C1s high-resolution spectra of NCQDs, and (d) N1s high-resolution spectra of NCQDs. | ||
XPS spectra were also performed to investigate the chemical composition of CQDs and NCQDs. As seen in Fig. 3b, the XPS survey spectrum of CQDs displays only the presence of oxygen (O1s at 531.5 eV) and carbon (C1s at 284.6 eV) peaks, while that of NCQDs exhibits three peaks at 284.6, 399.4, and 531.5 eV, corresponding to C1s, N1s, and O1s, respectively. The presence of strong N1s signal further confirms the formation of nitrogen-doped carbon dots. The spectrum of C1s region can be deconvoluted into five peaks corresponding to different C species (Fig. 3c). The dominant peak at 284.6 eV arises from sp2-hybridized (C![[double bond, length as m-dash]](https://www.rsc.org/images/entities/char_e001.gif) C) and sp3-hybridized (C–C) carbon, while the weak peaks at around 285.8, 286.7, 287.4 and 288.6 eV are attributed to C–N, C–O–C, C–C
C) and sp3-hybridized (C–C) carbon, while the weak peaks at around 285.8, 286.7, 287.4 and 288.6 eV are attributed to C–N, C–O–C, C–C![[double bond, length as m-dash]](https://www.rsc.org/images/entities/char_e001.gif) O and O–C
O and O–C![[double bond, length as m-dash]](https://www.rsc.org/images/entities/char_e001.gif) O and/or C
O and/or C![[double bond, length as m-dash]](https://www.rsc.org/images/entities/char_e001.gif) N bonds, respectively. In the spectrum of N1s (Fig. 3d), three peaks of sp2-hybridized C
N bonds, respectively. In the spectrum of N1s (Fig. 3d), three peaks of sp2-hybridized C![[double bond, length as m-dash]](https://www.rsc.org/images/entities/char_e001.gif) N–C, porphyrin C–N–C, and amino N in the form of N–(C)3 or H–N–(C)2 can be clearly observed at 398.4, 399.3 and 400.0 eV,18,19,36 respectively, which also demonstrated that nitrogen has been successfully doped into the structure of NCQDs. This is consistent with the results of FT-IR spectroscopy analysis.
N–C, porphyrin C–N–C, and amino N in the form of N–(C)3 or H–N–(C)2 can be clearly observed at 398.4, 399.3 and 400.0 eV,18,19,36 respectively, which also demonstrated that nitrogen has been successfully doped into the structure of NCQDs. This is consistent with the results of FT-IR spectroscopy analysis.
3.2 Optical properties of NCQDs
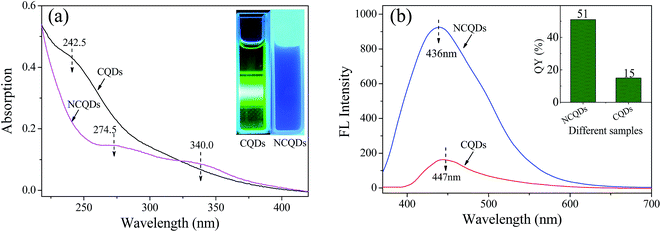
The UV-vis spectra of the CQDs and NCQDs are shown in Fig. 4a. Both CQDs and NCQD exhibit absorption band in the ultraviolet region due to the absorption of the aromatic π system or the n–π* transition of carbonyl groups.3 The absorption peak of CQDs centered at about 242.5 nm can be ascribed to π–π* transition of the C![[double bond, length as m-dash]](https://www.rsc.org/images/entities/char_e001.gif) C bond.17,38 While the two broad peaks of NCQDs shown at around 274.50 and 340.0 nm are originated from aromatic π system and n–π* transition of the C
C bond.17,38 While the two broad peaks of NCQDs shown at around 274.50 and 340.0 nm are originated from aromatic π system and n–π* transition of the C![[double bond, length as m-dash]](https://www.rsc.org/images/entities/char_e001.gif) O/C
O/C![[double bond, length as m-dash]](https://www.rsc.org/images/entities/char_e001.gif) N bond, respectively.39,40 It is concluded that the absorption peaks of the CQDs red-shift after N-doping due to the existence of amino groups which act as an auxochrome. The combination of CQDs with some auxochromes can shift absorption peaks to longer wavelengths, and change their absorption intensity. Therefore, it is reasonable to assume that nitrogen groups containing unshared electron pairs have reacted with the CQDs, and C
N bond, respectively.39,40 It is concluded that the absorption peaks of the CQDs red-shift after N-doping due to the existence of amino groups which act as an auxochrome. The combination of CQDs with some auxochromes can shift absorption peaks to longer wavelengths, and change their absorption intensity. Therefore, it is reasonable to assume that nitrogen groups containing unshared electron pairs have reacted with the CQDs, and C![[double bond, length as m-dash]](https://www.rsc.org/images/entities/char_e001.gif) C bonds which absorb at 250–280 nm, together with C
C bonds which absorb at 250–280 nm, together with C![[double bond, length as m-dash]](https://www.rsc.org/images/entities/char_e001.gif) N and/or C
N and/or C![[double bond, length as m-dash]](https://www.rsc.org/images/entities/char_e001.gif) O bonds which absorb at around 343 nm were involved in the structure of NCQDs.33 Besides, when irradiated with UV light (360 nm), the water-soluble CQDs and NCQDs exhibit green and bright blue, respectively (the inset of Fig. 4a). This observation clearly indicated that the CQDs and NCQDs had different UV absorption properties and fluorescence emission properties.
O bonds which absorb at around 343 nm were involved in the structure of NCQDs.33 Besides, when irradiated with UV light (360 nm), the water-soluble CQDs and NCQDs exhibit green and bright blue, respectively (the inset of Fig. 4a). This observation clearly indicated that the CQDs and NCQDs had different UV absorption properties and fluorescence emission properties.
The fluorescence emission spectra with excitation wavelength (λex) at 360 nm also revealed the difference between NCQDs and CQDs aqueous solutions (pH = 4). As seen in Fig. 4b, not only the fluorescence emission intensity of NCQDs is stronger than that of CQDs solutions with the same concentration, but also the blue-shift of the maximum fluorescence emission wavelength (λem) of NCQDs is occurred. The fluorescence emission intensity of NCQDs is 7.1 times (calculated by two peaks area) stronger than that of CQDs, and it can be explained by the reduction of non-radiative recombination centers reduction on the NCQDs surface.41 Upon this mechanism, the collision of an oxygen molecule with an excited state quantum dots can lead to non-radiative energy transfer, i.e. fluorescence quenching, which results in the decrease of the fluorescence emission intensity. As indicated by IR and XPS, some oxygen groups such as epoxy, ether and carboxyl are formed on the surface of CQDs via hydrothermal process.21 Due to they act as non-radiative recombination centers, CQDs have weaker fluorescence emission capability. Fortunately, through adding ethylenediamine, the groups of epoxy, ether, and carboxyl can be reduced by the nucleophilic reaction with amidogen.42,43 So, NCQDs contains few non-radiative recombination centers. In addition, amination and/or amidation also create radiative recombination centers, such as amine (–C–N–) and amide groups (R2–NCOR), which belong to electron-donating groups. These electron-donating groups and π-electrons that existed in –C![[double bond, length as m-dash]](https://www.rsc.org/images/entities/char_e001.gif) N group can enhance the fluorescence intensity of a substance.44 Therefore, N-doping can effectively enhance the fluorescence emission properties of NCQDs, and acquire higher QY than CQDs. The QYs of CQDs and NCQDs calculated using quinine sulfate as a standard sample are shown in the inset of Fig. 4b, which indicates that N-doping increases the QY to 51%, much higher than those in previous reports.3,17 In summary, all these results suggest that the fluorophore of NCQDs differs from CQDs, and the fluorescence emission capability and QYs of carbon dots were enhanced effectively by N-doping.
N group can enhance the fluorescence intensity of a substance.44 Therefore, N-doping can effectively enhance the fluorescence emission properties of NCQDs, and acquire higher QY than CQDs. The QYs of CQDs and NCQDs calculated using quinine sulfate as a standard sample are shown in the inset of Fig. 4b, which indicates that N-doping increases the QY to 51%, much higher than those in previous reports.3,17 In summary, all these results suggest that the fluorophore of NCQDs differs from CQDs, and the fluorescence emission capability and QYs of carbon dots were enhanced effectively by N-doping.
To investigate the effect of chemical environment on the fluorescence characteristics of NCQDs, the fluorescence emission intensity and QY were also measured under different pH values. Fig. 5a shows UV-vis absorption curves of NCQDs recorded at pH 1–14. The profile of the spectrum is unchanged at pH 1–11. However, the profile of NCQDs absorption spectra at 280–310 nm changes significantly at pH 12–14. The reason for this may be that hydroxyl and other acidic groups on the surface of NCQDs react with OH− under strongly alkaline conditions and form resonance structures, leading to red-shifts and increase of the UV-vis absorption peak.
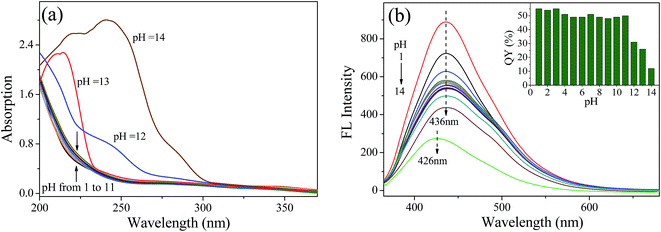 | ||
| Fig. 5 (a) UV-vis absorption spectra of NCQDs at different pH values. (b) Fluorescence emission spectra of NCQDs at different pH values. Inset shows QYs at different pH values. | ||
Fig. 5b shows the effect of pH value on the fluorescence emission of NCQDs. The fluorescence emission intensity is enhanced under strong acid conditions (pH ≤ 3), weakened under strong alkaline conditions (pH ≥ 12), and retains constant under others conditions (3 < pH ≤ 11). In addition, the maximum λem was blue-shifts from 436 nm to 426 nm at pH = 14 and remain the same under other pH conditions. These results show that the surface state of the NCQDs is affected by the pH value due to the protonation and deprotonation of carboxyl, hydroxyl, and amido groups on the NCQDs surface, which affect the position and intensity of the fluorescence emission. This is consistent with UV-vis analysis. The inset in Fig. 5b shows the QYs of NCQDs under different pH conditions. The QYs maintain a relatively high level about 54–55% at pH 1–3, 48–51% at pH 4–11, and decreases to 12% at pH = 14. Therefore, a high and stable QY can be obtained when pH ≤ 11, especially under acidic environment. The excellent optical properties and acidic resistance of NCQDs would be advantageous in the prolonged detection and monitoring of metal ions in acidic condition.
3.3 Detection of metal ions in acidic environment
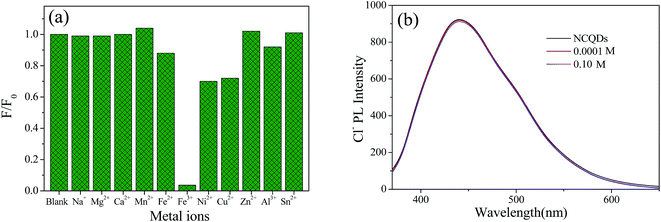
Many reported CQDs used as metal ion probes are fragile under acidic conditions, which restricts their application in the fields of environmental pollution and heavy metal detection.24,26,38 While, the obtained NCQDs possess excellent fluorescence properties in strong acidic environment. What's more, the oxygen and nitrogen functional groups on the surface of NCQDs can interact with metal ions to form complexes by coordination. Therefore, the feasibility of NCQDs as a probe for metal ion detection in acidic environment was investigated in detail under the condition of pH = 1 (adjusted with HCl).To explore the selective detection of various metal ions, Na+, Mg2+, Ca2+, Mn2+, Fe3+, Fe2+, Ni2+, Cu2+, Zn2+, Al3+ and Sn2+ were added to the NCQDs acidic solution, and the changes in the fluorescence intensity were recorded. Fig. 6a shows the relative fluorescence intensities of NCQDs in the presence of various metal ions at the concentration of 1 mM with the excitation wavelength of 360 nm. Comparatively, NCQDs shows the highest fluorescence quenching towards Fe3+ ions, which was almost 96%. While the fluorescence quenching towards Ni2+, Cu2+, and Fe2+ ions is no more than 30% and quite weak towards other ions with the same concentration. The high fluorescence quenching effect of Fe3+ may originate from the fast electron transfer between Fe3+ and oxygen-rich and nitrogen-rich groups on the surface of NCQDs.45–47 Compared with other cations, electron-deficient Fe3+ has a higher binding affinity towards the electron-rich groups, so, it is easier to interact with electron-donating groups, such as –NHR, –OH, –NH2 and –OR on the surface of NCQDs. For this coordination interaction, electron in the excited state of NCQDs would transfer to the unfilled orbit of Fe3+, and lead to nonradiative electron/hole recombination, which results in the high fluorescence quenching.18,47 For Ni2+, Cu2+, and Fe2+ ions, although they can also react with electron-donating groups in the NCQDs, their electrophilic ability is weaker compared with Fe3+, which may lead to lower fluorescence quenching than that of Fe3+.
The weak fluorescence response of ions excluding Ni2+, Cu2+, and Fe2+ indicates that both the cation (metal ions) and the counter anion (Cl−) used in the system have no effect on the fluorescence quenching. However, to further investigate the effect of counter anion (Cl−), NaCl was used to adjust the concentration of Cl− in the testing system due to the cation Na+ has no effect on the fluorescence emission (displayed in Fig. 6a). It is found in Fig. 6b that counter anion (Cl−) with concentration of 0.0001 M and 0.1 M had almost negligible impact on the fluorescence emission, indicating that Fe3+ is solely responsible for the fluorescence quenching.
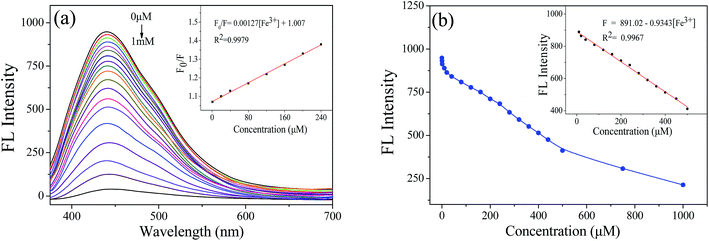
Since the excellent fluorescence quenching effect of Fe3+, it was further study by varying the concentration of Fe3+. Different concentrations of FeCl3 were added to NCQDs acidic solution, and the fluorescence emission intensity was measured. Fig. 7a shows a gradual decrease in the fluorescence emission intensity of NCQDs at around 436 nm as the FeCl3 concentration increases from 0.01 μM to 1 mM. This indicates that Fe3+ quenches the fluorescence of NCQDs in acidic environment. Fig. 7b shows the relationship between fluorescence intensity and Fe3+ concentration. There is a linear correlation between the quenching efficiency and Fe3+ concentration at 10–500 μM. The Fe3+ concentration can be calculated using the following fitting equation, and the correlation index (R2) is 0.9967.
| F = 891.02 − 0.9343 × [Fe3+] ([Fe3+] = 10–500 μM) |
Furthermore, the limit of detection (LOD) was estimated based on the following equation: LOD = 3S/b, where S is the standard deviation of the blank sample (n = 11) and b is the slope of the fitting curve. The LOD of Fe3+ was down to 0.21 nM in hydrochloric acid solution. The result shows that NCQDs is feasible for detecting trace Fe3+ by fluorescence quenching with excellent sensitivity. When compared with some other reported N-doping probes for determination of Fe3+, the presented NCQDs provided higher QY and superior detection limit than that of other reported sensing systems (Table 1). What's more, the NCQDs are the only chemical sensors that detect Fe3+ ions in a strongly acidic environment.
| Chemosensors | QYs (%) | Linear range (μM) | LOD (nM) | Detection environment | Ref. |
|---|---|---|---|---|---|
| N-CDs | 15.13 | 6–200 | 800 | PBS, pH = 7.4 | 18 |
| C-dots | 50.78 | 0.01–100 | 75 | Tris–HCl, pH = 7.4 | 25 |
| CDs | 15 | 5.0–50.0 | 25 | Doubly deionized water | 35 |
| NCDs | — | 0–20 | — | PBS, pH = 6.8 | 38 |
| CNPs | 5.42 | 0–25 | 1060 | Tap water | 46 |
| CA + Phen | 10 | 0–50 | 35 | HEPES solution, pH = 7.4 | 48 |
| N, S, C-dots | 13 | 0.002–3 | 0.22 | NaAc–HAc solution, pH = 5.5 | 49 |
| GQDs | 12.67 | 0.05–200 | 50 | PBS, pH = 7.4 | 50 |
| C-QDs | 52 | 2–50 | 1300 | PBS, pH = 7 | 51 |
| NCQDs | 55 | 10–500 | 0.21 | HCl solution, pH = 1.0 | This work |
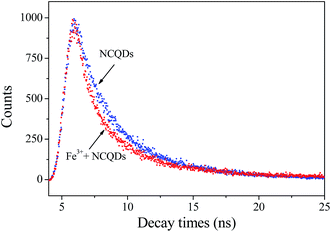
Usually, fluorescence quenching originates from static or dynamic quenching. Static quenching involves the formation of the complex by combining the ground state fluorescence molecule with the quencher, while in dynamic quenching the collision of excited fluorescence molecule with the quencher.48 To better explore the fluorescence quenching mechanism of NCQDs by Fe3+, the quenching equation was calculated according to the Stern–Volmer equation:
| F0/F = KSV[Q] + 1 |
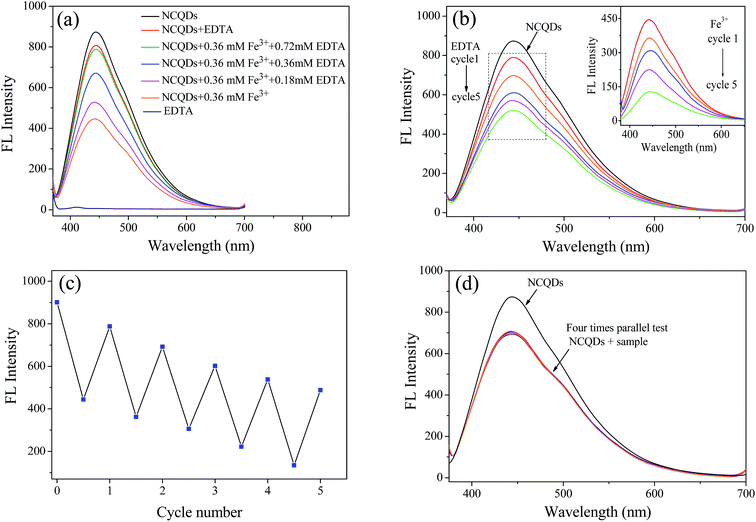
The reversibility of fluorescence probes is one of the most important indicators to evaluate its potential application. To examine the fluorescence recoverability, EDTA solution with different concentrations was added to the NCQDs-Fe3+ system, respectively. As shown in Fig. 9a, the quenched fluorescence was recovered gradually from 51.2% to 90.2% when the EDTA was added from 0 mM to 0.72 mM. It suggested that EDTA can restore the fluorescence by remove Fe3+ from the surface of NCQDs, which make the fluorescence quenching process recoverable. In addition, 0.36 mM Fe3+ and 0.72 mM EDTA were alternately added to NCQDs solution to study fluorescence reversibility of the NCQDs. As shown in Fig. 9b and the inset, Fe3+ can turn-off the fluorescence (the inset) and EDTA can turn-on the fluorescence, this switchable fluorescence “off-on” process displays a good reversibility. Even after 5 cycles, as shown in Fig. 9c, about 60% of the maximum fluorescence emission ability could still be retained. The reason for the switchable fluorescence may be attributed to the competitive response of NCQDs and EDTA to Fe3+ ions. All the results indicated that fluorescence quenching of Fe3+ to NCQDs has relative high reversibility.
In order to evaluate the feasibility of the presented sensor to practical application, the concentration of Fe3+ in leaching solution of iron ore tailings (obtained from Qiupigou iron ore in Harbin, China) was analyzed by this fluorescence quenching method. A certain amount of K2MnO4 was added in the HCl pretreated leaching solution. Then, the solution was filtered with 0.22 μm nitrocellulose filters and the pH was adjusted to 1 for the fluorescence quenching examination, and four parallel tests were performed. In order to evaluate the accuracy of this fluorescence quenching method, a standard method of phenanthroline spectrophotometry was also carried out for ref. 52. Fig. 9d displayed that the practical sample also shows good quenching effect to NCQDs. The concentration of Fe3+ in this practical sample was calculated according to the fluorescence emission intensity in Fig. 9d. It was found that the concentration of Fe3+ measured by the fluorescence quenching method was 189.4 μM, which is comparable to that of phenanthroline spectrophotometry method (181.7 μM). What's more, the standard deviation of the fluorescence quenching method was 4.2 (n = 4). When the t-test was applied to evaluate the systematic error of the method, the calculated t-value was 1.98, which less than t0.95,3 (t0.95,3 = 4.30), indicating high accuracy of this method. All these results confirmed that the developed method is a potential strategy for detection of Fe3+ in acidic wastewater.
4. Conclusion
NCQDs were synthesized by a facile and low-cost hydrothermal synthesis, using microcrystalline cellulose and ethylenediamine as the carbon sources and nitrogen sources, respectively. The NCQDs exhibit excellent photoluminescence, high QY in acidic conditions. NCQDs are an effective fluorescent probe for detecting Fe3+ concentrations of 10 μM to 500 μM and the LOD is as low as 0.21 nM in hydrochloric acid solution at pH = 1, and the mechanism of the quenching process is dynamic quenching with relative high reversibility. It is expected that this strategy may offer a new approach for developing low-cost and sensitive probe for metal ion detection in acidic environment.Conflicts of interest
There are no conflicts of interest to declare.Acknowledgements
This work was supported by the National Science Foundation of China (Grant No. 31570567 and 31500467); the Special Fund for Forest Scientific Research in the Public Welfare (Grant No. 201504605); and Natural Science Foundation of Heilongjiang Province (Grant No. B201417).References
- Y. Xu, X. Niu, H. Zhang, L. Xu, S. Zhao, H. Chen and X. Chen, J. Agric. Food Chem., 2015, 63, 1747 CrossRef CAS PubMed.
- X. Xu, R. Ray, Y. Gu, H. J. Ploehn, L. Gearheart, K. Raker and W. A. Scrivens, J. Am. Chem. Soc., 2004, 126, 12736 CrossRef CAS PubMed.
- Q. Liang, W. Ma, Y. Shi, Z. Li and X. Yang, Carbon, 2013, 60, 421 CrossRef CAS.
- S. L. Ting, S. J. Ee, A. Ananthanarayanan, K. C. Leong and P. Chen, Electrochim. Acta, 2015, 172, 7 CrossRef CAS.
- Y. Yan, Q. Liu, X. Du, J. Qian, H. Mao and K. Wang, Anal. Chim. Acta, 2015, 853, 258 CrossRef CAS PubMed.
- S. Yang, X. Wang, H. Wang, F. Lu, P. G. Luo, L. Cao, M. J. Meziani, J. H. Liu, Y. Liu, M. Chen, Y. Huang and Y. P. Sun, J. Phys. Chem. C, 2009, 113, 18110 CAS.
- H. Li, X. He, Z. Kang, H. Huang, Y. Liu, J. Liu, S. Lian, C. H. A. Tsang, X. Yang and S. T. Lee, Angew. Chem., Int. Ed., 2010, 49, 4430 CrossRef CAS PubMed.
- A. Rahy, C. Zhou, J. Zheng, S. Y. Park, M. J. Kim, I. Jang, S. J. Cho and D. J. Yang, Carbon, 2012, 50, 1298 CrossRef CAS.
- J. Wang, S. Sahu, S. K. Sonkar, K. N. Tackett, K. W. Sun, Y. Liu, H. Maimaiti, P. Anilkumar and Y. P. Sun, RSC Adv., 2013, 3, 15604 RSC.
- H. Li, F. Q. Shao, H. Huang, J. J. Feng and A. J. Wang, Sens. Actuators, B, 2016, 226, 506 CrossRef CAS.
- J. Hou, H. Li, L. Wang, P. Zhang, T. Zhou, H. Ding and L. Ding, Talanta, 2016, 146, 34 CrossRef CAS PubMed.
- H. Li, X. He, Y. Liu, H. Huang, S. Lian, S. T. Lee and Z. Kang, Carbon, 2011, 49, 605 CrossRef CAS.
- Z. Wang, L. Cao, Y. Ding, R. Shi, X. Wang, H. Lu, Z. Liu, F. Xiu, J. Liu and W. Huang, RSC Adv., 2017, 7, 21969 RSC.
- S. Liu, J. Tian, L. Wang, Y. Zhang, X. Qin, Y. Luo, A. M. Asiri, A. O. Al-Youbi and X. Sun, Adv. Mater., 2012, 24, 2037 CrossRef CAS PubMed.
- C. Wang, Z. Xu, H. Cheng, H. Lin, M. G. Humphrey and C. Zhang, Carbon, 2015, 82, 87 CrossRef CAS.
- T. V. Tam, N. B. Trung, H. R. Kim, J. S. Chung and W. M. Choi, Sens. Actuators, B, 2014, 202, 568 CrossRef CAS.
- R. Zhang and W. Chen, Biosens. Bioelectron., 2014, 55, 83 CrossRef CAS PubMed.
- W. Lu, X. Gong, M. Nan, Y. Liu, S. Shuang and C. Dong, Anal. Chim. Acta, 2015, 898, 116 CrossRef CAS PubMed.
- A. B. Bourlinos, G. Trivizas, M. A. Karakassides, M. Baikousi, A. Kouloumpis, D. Gournis, A. Bakandritsos, K. Hola, O. Kozak, R. Zboril, I. Papagiannouli, P. Aloukos and S. Couris, Carbon, 2015, 83, 173 CrossRef CAS.
- Q. Wu, W. Li, P. Wu, J. Li, S. Liu, C. Jin and X. Zhan, RSC Adv., 2015, 5, 75711 RSC.
- P. Liu, C. Zhang, X. Liu and P. Cui, Appl. Surf. Sci., 2016, 368, 122 CrossRef CAS.
- S. N. A. Shah, H. Li and J. M. Lin, Talanta, 2016, 153, 23 CrossRef CAS PubMed.
- J. Zong, X. Yang, A. Trinchi, S. Hardin, I. Cole, Y. Zhu, C. Li, T. Muster and G. Wei, Biosens. Bioelectron., 2014, 51, 330 CrossRef CAS PubMed.
- Q. Wang, S. Zhang, H. Ge, G. Tian, N. Cao and Y. Li, Sens. Actuators, B, 2015, 207, 25 CrossRef CAS.
- S. J. Yu, N. Song, Y. Zhang, S. Zhong, A. Wang and J. Chen, Sens. Actuators, B, 2015, 214, 29 CrossRef.
- S. N. Qu, H. Chen, X. M. Zheng, J. S. Cao and X. Y. Liu, Nanoscale, 2013, 5, 551 Search PubMed.
- S. Tao, Y. Song, S. Zhu, J. Shao and B. Yang, Polymer, 2017, 116, 472 CrossRef CAS.
- L. Feng, H. Sun, J. Ren and X. Qu, Nanotechnology, 2016, 27, 115301 CrossRef PubMed.
- L. Pang, L. Ba, W. Pan and W. Shen, Nanotechnology, 2017, 28, 085305 CrossRef PubMed.
- D. Trache, M. H. Hussin, M. K. Haafiz and V. K. Thaku, Nanoscale, 2017, 9, 1763 RSC.
- Q. Wu, W. Li, Y. Wu, Z. Huang and S. Liu, Appl. Surf. Sci., 2014, 315, 66 CrossRef CAS.
- X. Gong, W. Lu, M. C. Paau, Q. Hu, X. Wu, S. Shuang, C. Dong and M. M. Choi, Anal. Chim. Acta, 2015, 861, 74 CrossRef CAS PubMed.
- Y. Zhang, Y. Wang, X. Feng, F. Zhang, Y. Yang and X. Liu, Appl. Surf. Sci., 2016, 387, 1236 CrossRef CAS.
- X. Wang, K. Qu, B. Xu, J. Ren and X. Qu, J. Mater. Chem., 2011, 21, 2445 RSC.
- J. Xu, Y. Zhou, S. Liu, M. Dong and C. Huang, Anal. Methods, 2014, 6, 2086 RSC.
- J. Liu, Y. Liu, N. Liu, Y. Han, X. Zhang, H. Huang, Y. Lifshitz, S. T. Lee, J. Zhong and Z. Kang, Science, 2015, 347, 970 CrossRef CAS PubMed.
- A. Cai, Q. Wang, Y. Chang and X. Wang, J. Alloys Compd., 2017, 692, 183 CrossRef CAS.
- Y. Jiang, Q. Han, C. Jin, J. Zhang and B. Wang, Mater. Lett., 2015, 141, 366 CrossRef CAS.
- R. Liu, H. Li, W. Kong, J. Liu, Y. Liu, C. Tong, X. Zhang and Z. Kang, Mater. Res. Bull., 2013, 48, 2529 CrossRef CAS.
- Y. Zhuo, H. Miao, D. Zhong, S. Zhu and X. Yang, Mater. Lett., 2015, 139, 197 CrossRef CAS.
- S. Zhu, J. Zhang, S. Tang, C. Qiao, L. Wang, H. Wang, X. Liu, B. Li, Y. Li, W. Yu, X. Wang, H. Sun and B. Yang, Adv. Funct. Mater., 2012, 22, 4732 CrossRef CAS.
- J. Zhou, C. Booker, R. Li, X. Zhou, T. K. Sham, X. Sun and Z. Ding, J. Am. Chem. Soc., 2007, 129, 744 CrossRef CAS PubMed.
- L. Lai, L. Chen, D. Zhan, L. Sun, J. Liu, S. H. Lim, C. K. Poh, Z. Shen and J. Lin, Carbon, 2011, 49, 3250 CrossRef CAS.
- H. Tetsuka, R. Asahi, A. Nagoya, K. Okamoto, I. Tajima, R. Ohta and A. Okamoto, Adv. Mater., 2012, 24, 5333 CrossRef CAS PubMed.
- G. Yang, X. Wan, Y. Su, X. Zeng and J. Tang, J. Mater. Chem. A, 2016, 4, 12841 CAS.
- J. F. Y. Fong, S. F. Chin and S. M. Ng, Sens. Actuators, B, 2015, 209, 997 CrossRef CAS.
- W. Liu, H. Diao, H. Chang, H. Wang, T. Li and W. Wei, Sens. Actuators, B, 2017, 241, 190 CrossRef CAS.
- A. Iqbala, Y. Tian, X. Wang, D. Gong, Y. Guo, K. Iqbal, Z. Wang, W. Liu and W. Qin, Sens. Actuators, B, 2016, 237, 408 CrossRef.
- Y. Chen, Y. Wu, B. Weng, B. Wang and C. Li, Sens. Actuators, B, 2016, 223, 689 CrossRef CAS.
- Q. Ma, J. Song, S. Wang, J. Yang, Y. Guo and C. Dong, Appl. Surf. Sci., 2016, 389, 995 CrossRef CAS.
- M. Zhou, Z. Zhou, A. Gong, Y. Zhang and Q. Li, Talanta, 2015, 143, 107 CrossRef CAS PubMed.
- B. Shyla, C. Vijaya Bhaskar and G. Nagendrappa, Spectrochim. Acta, Part A, 2012, 86, 152 CrossRef CAS PubMed.
| This journal is © The Royal Society of Chemistry 2017 |

