 Open Access Article
Creative Commons Attribution 3.0 Unported Licence
Effects of La, Sm and Yb doping on thermoelectric properties of Ca0.98Er0.02MnO3 at high temperature
Tao Yang and
Tiexin Cheng
 *
*
College of Chemistry, Jilin University, Changchun, Jilin 130021, China. E-mail: hign1@outlook.com
First published on 18th September 2017
Abstract
A series of perovskite-type ceramic materials Ca0.98Er0.02MnO3 (CDM) and Ca0.96Er0.02Re0.02MnO3 (Re = La, Sm, Yb) (denoted as CDM-La, CDM-Sm, CDM-Yb) which worked from 300 K to 1000 K with excellent thermoelectric properties was prepared by a sol–gel and cold-pressing method. XRD results revealed that the prepared samples are uniform crystalline particles with high purity. The results of XPS characterization show that an increase in the Mn3+ ratio is caused by the introduction of dual-doping. The characterization results of resistivity and Seebeck coefficient reveal that the carrier concentration is optimized by dual doping, accordingly the resistivity decreases continuously and the value of the Seebeck coefficient increases continuously. The highest power factor of 219 μW (K2 m)−1 is obtained at 773 K for the Ca0.96Er0.02Yb0.02MnO3 sample. And also the introduction of a second element contributes to lower the thermal conductivity. The highest figure of merit, ZT, of the Ca0.96Er0.02Yb0.02MnO3 sample exceeds 0.12 at 973 K.
1. Introduction
Thermoelectric materials can direct transfer energy between heat and electricity. They are a promising means for reliable and simple energy saving. Thermoelectric performance is determined in general by calculating a material's dimensionless figure of merit ZT, defined as ZT = S2σT/κ, where S is the Seebeck coefficient, σ is the electrical conductivity, κ is the total thermal conductivity, T is the absolute temperature in Kelvin, and the product S2σ is the power factor.Thermoelectric oxides are a representative class of thermoelectric materials. For a long time, many thermoelectric oxides with high thermoelectric performance have been researched, such as NaCo2O4, Ca3Co4O9−δ, Bi2Sr2Co2Oy, TiSr2Co2Oy, SrTiO3.1–5 But there are few n-type oxide thermoelectric materials to be reported, where the ZT of n-type is significantly higher than that of p-type.25 CaMnO3 has attracted attention as a prospective candidate of n-type thermoelectric oxides.6–8 Thermoelectric correlation parameters of CaMnO3 were first researched by Takizawa et al.9 and Ohtaki et al.10 It is reported that the largest power factor of Ca0.9Bi0.1MnO3 attains 2.8 × 10⁻⁴ W m−1 K−2 at 1073 K and samples show a maximum ZT value of 0.085 at 1173 K. On the basis of their study, doping with some other trivalent elements were reported by Funahashi et al.11,12 It is reported that the highest power factor achieved 0.22 mW m−1 K−2 at 773 K and the highest dimensionless figure of merit obtained was 0.09 at 973 K. It can be seen that doping is an effective way to reduce resistivity. According to these studies, the Wang et al.13–15 reported lanthanide elements substitution with a higher doping level of 10%, then they studied a large thermoelectric performance of CaMnO3 by doping Dy at Ca site and achieved ZT = 0.2 in Ca0.9Yb0.1MnO3. Bhaskar et al.16 and Liu et al.17 found that a lower Dy doping could be exhibited an antiferromagnetic transition in CaMnO3. But most studies have been focused on the single doping for CaMnO3 system. And following experiments, Zhu et al.18 reported the thermoelectric performance of Er and Dy dual doped CaMnO3 and achieved ZT = 0.23 in Ca0.96Er0.02Dy0.02MnO3. As we all know, Er and Dy have similar atomic structures and similar ionic radii. Herein, a series of perovskite-type ceramic materials Ca0.98Er0.02MnO3 (CDM) and Ca0.96Er0.02Re0.02MnO3 (Re = La, Sm, Yb) (denoted CDM-La, CDM-Sm, CDM-Yb) which prepared by sol–gel method, and Ca0.98Er0.02MnO3 (CDM) as a comparison. Those samples were evaluated from 300 K to 1000 K.
2. Experimental procedure
Sol–gel and cold pressing method was used to synthesize samples of Ca0.98Er0.02MnO3 and Ca0.96Er0.02Re0.02MnO3 ceramics, with Re = La, Sm, Yb. The starting materials were Ca(NO3)2 (99.0%), Mn(NO3)2 solution (50.0%), Er2O3 (99.9%), La2O3 (99.9%), Sm(NO3)2 (99.8%), Yb(NO3)2 (99.8%), C2H6O2 (95.0%) and C6H8O7 (99.0%). All raw materials were provided by Sinopharm Group Co., Ltd., weighed in stoichiometric proportions and added into deionized water. Evaporation for 7 h at 325 K under gentle stirring afforded a purple solution, which was transformed into a yellow gel precursor after drying at 473 K for 2 h. After the wet mixtures dried, the powder was calcinated for 12 h at 1423 K in ambient atmospheric condition with an intermediate grinding. The calcined powder was ball-milled for 12 h to obtain a fine powder. The ground powder was tableted at 30 MPa under air atmosphere, and sintered in air at 1573 K for 12 h. The ceramics were cut into rectangular columns with dimensions of 3 mm × 4 mm × 8 mm for measurement of thermoelectric properties.X-ray powder diffraction (XRD) analysis was carried out using a Rigaku D/max-rA X-ray diffractometer with Cu Kα radiation and scanning (a step width of 2°) over the angular range 20 to 70°. The electrical resistivity (ρ) and Seebeck coefficients (S) were measured simultaneously using a ZEM-1 apparatus in the temperature range between 300 and 1000 K. The carrier concentration was measured by HL5500 at room temperature. Thermal conductivity values (κ) were calculated from the thermal diffusivity (λ), the specific heat capacity (Cp), and the density (d) by applying the following relationship: κ = λCpd. The density of the samples was measured by the Archimedes method. The thermal diffusivity and specific heat capacity were measured with a laser flash apparatus (Netzsch LFA 457) and different thermal analyzers (Netzsch Q20-DSC), respectively. The power factor, figure of merit ZT, Hall coefficient, mobility and theoretical density were calculated.
3. Results and discussion
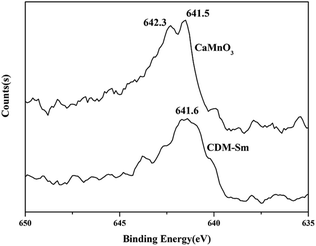
The XRD patterns of CDM, CDM-La, CDM-Sm and CDM-Yb were presented at room temperature in Fig. 1. The diffraction peaks of the prepared doping samples are identical with those in the standard JCPSD (89-0666) card of CaMnO3 (ref. 19) and all samples have without any second phase occurs. Based on results showed that the Er3+, La3+, Sm3+ and Yb3+ ions have entered into the CaMnO3 lattice. According to the XRD data, lattice parameters and theoretical density shown listed in Table 1. From which can be seen directly that lattice parameters of CDM is smaller than dual doped samples. However, we have known that the ionic radius of Ca2+ (1.12 Å) is larger than that of Sm3+ (1.079 Å) and Yb3+ (1.008 Å)24 ions and only Ca2+ is a little smaller than that of La3+ (1.16 Å) ions.20 Fig. 2 shows XPS Mn 2p spectra of CaMnO3 and CDM-Sm. The Mn 2p3/2 characteristic peaks of the CaMnO3 sample split into two peaks of 642.3 eV and 641.5 eV, which are close to the binding energy of Mn4+ and Mn3+, which indicates that the Mn ions exist in the two chemical valence states in the CaMnO3. The Mn 2p characteristic peaks of the CDM-Sm samples showed only a broad peak at 641.6 eV, which is close to the binding energy of Mn3+, this shows that the dual-doping makes the composition of Mn3+ to increase. The doping causes the charge imbalance, in order to maintain the electrically neutral, Mn ions change the chemical valence to balance the excess charge. It is known that there are two different sizes in the ionic radii between Mn3+ (0.645 Å) and Mn4+ (0.530 Å) in the system.20 Therefore, the variation of lattice parameters is due to the increase of Mn3+. The similar results have been reported by Wang et al.5 For the orthorhombic perovskite structure of ABO3 type, the distortion of the structure leads to the lattice constant becoming orthorhombic structure from the cubic structure. As can be seen from Table 1, all samples of a, b, c values are satisfied relationship, which indicates that the sample is O-type orthorhombic structure.
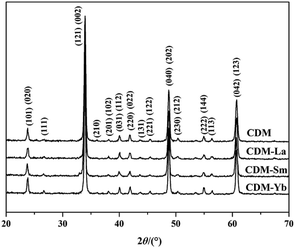 | ||
| Fig. 1 Room temperature X-ray diffraction patterns for Ca0.98Er0.02MnO3 and Ca0.96Er0.02Re0.02MnO3 (Re = La, Sm, Yb). | ||
| Samples | a (Å) | b (Å) | c (Å) | Theoretical density (g cm−3) | Experimental density (g cm−3) | Relative density (%) |
|---|---|---|---|---|---|---|
| CDM | 5.438 | 7.487 | 5.291 | 4.701 | 4.382 | 93.2 |
| CDM-La | 5.449 | 7.501 | 5.299 | 4.738 | 4.396 | 92.7 |
| CDM-Sm | 5.451 | 7.504 | 5.303 | 4.744 | 4.410 | 92.9 |
| CDM-Yb | 5.453 | 7.505 | 5.303 | 4.765 | 4.412 | 92.5 |
Table 2 gives the EDX analysis results of Ca0.98Er0.02MnO3 and Ca0.96Er0.02Re0.02MnO3 (Re = La, Sm, Yb). Experimental densities are 4.382 g cm−3, 4.396 g cm−3, 4.410 g cm−3 and 4.412 g cm−3 for samples of CDM, CDM-La, CDM-Sm, and CDM-Yb, respectively. From Table 1, it can be seen directly that the ever-increasing atomic number makes the measured density also larger, which is due to the contribution from the heavier mass of La, Sm, and Yb elements. The relative densities, defined as the experimental density over the theoretical density, are all 92.5–93.2%, which means the samples are of good compactness.
| Sample | Ca% | Er% | La% | Sm% | Yb% | Mn% | O% | Pt% |
|---|---|---|---|---|---|---|---|---|
| CDM | 30.82 | 4.89 | 0 | 0 | 0 | 38.26 | 25.82 | 0.21 |
| CDM-La | 31.43 | 2.95 | 1.96 | 0 | 0 | 36.56 | 26.72 | 0.38 |
| CDM-Sm | 28.89 | 2.71 | 0 | 2.21 | 0 | 37.71 | 28.26 | 0.22 |
| CDM-Yb | 30.41 | 2.89 | 0 | 0 | 2.37 | 39.91 | 24.17 | 0.25 |
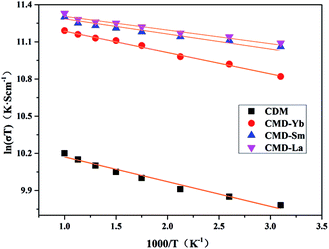
The temperature dependence of resistivity for CDM, CDM-La, CDM-Sm, and CDM-Yb is shown in Fig. 3. This samples exhibit metal-like characteristics, the resistivity increases with increasing temperature (dρ/dT > 0) throughout the whole test temperature range. The similar phenomenon is reported by Wang et al. and Liu et al.14–18 The resistivity is 36.5 mΩ cm, 14.1 mΩ cm, 13.1 mΩ cm and 12.3 mΩ cm, for CDM, CDM-La, CDM-Sm and CDM-Yb, respectively at 973 K. It is apparent the resistivity of CDM decreases significantly when the second element are doped. All samples have no visible difference. As we all know, the carrier concentration and mobility limit the resistivity, in Fig. 3 the resistivity of the three dual-doping samples have a similar trend, it can be concluded that the carrier concentration and mobility of the three samples also have the similar trend.
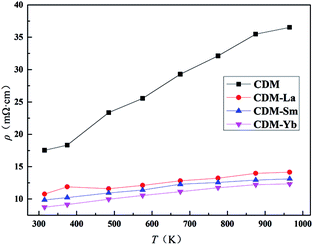 | ||
| Fig. 3 Temperature dependence of electrical resistivity for Ca0.98Er0.02MnO3 and Ca0.96Er0.02Re0.02MnO3 (Re = La, Sm, Yb). | ||
From Table 3, the carrier concentration is obtained from the measured Hall coefficient. It can be expressed as RH = 1/ne, where RH, n and e are the Hall coefficient, carrier concentration and electron charge, respectively. The doping of the second element increases the carrier concentration for the system. The mobility is calculated from the carrier concentration and the electrical conductivity according to σ = neμ. Since the conductivity and carrier concentration of CDM-Yb are relatively large, the mobility is also the highest.
| Sample | σ (S cm−1) | n × 1018 (cm−3) | RH (cm3 C−1) | μ (cm2 V−1 S−1) |
|---|---|---|---|---|
| CDM | 56.9 | 91.23 | 0.068 | 3.89 |
| CDM-La | 92.7 | 130.53 | 0.047 | 4.43 |
| CDM-Sm | 101.4 | 141.65 | 0.044 | 4.48 |
| CDM-Yb | 114.1 | 147.82 | 0.042 | 4.81 |
Usually, the resistivity of perovskite type acid salt can be expressed as
 | (1) |
The Seebeck coefficients of CDM, CDM-La, CDM-Sm, and CDM-Yb ceramics as a function of temperature were displayed in Fig. 5. In the temperature range between 300 K and 1000 K, the Seebeck coefficients of all the samples were positive and indicating a feature of n-type semiconductors. It can be seen from the figure that the doped of second element did not change the trend of the S–T curves. CDM has a relatively large absolute Seebeck coefficient, almost −160 μV K−1 at 973 K. The introduction of second elements makes the Seebeck coefficient of the dual doped sample decrease. This phenomenon is attributed to the increase of carrier concentration. The Seebeck coefficient depends on concentration of charge carriers, which means that the all dual-doped samples may have similar carrier concentrations, and the similarity of the resistivity of the confirmation. The measurements of Hall coefficients also verify that the resistivity and Seebeck coefficient of the three samples have a similar trend, and the conclusion is reasonable, we can draw the conclusion that the second additional element introduces larger carrier concentration. Similar conclusions have been reported yet.11,19
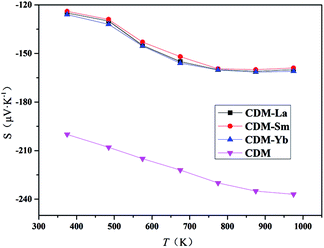 | ||
| Fig. 5 Temperature dependence of Seebeck coefficients for Ca0.98Er0.02MnO3 and Ca0.96Er0.02Re0.02MnO3 (Re = La, Sm, Yb). | ||
The Seebeck coefficient of CDM samples tends to saturation at 900 K, other three samples only observed at 750 K. From the theory of Heikes and Ure,21 the Fermi energy EF has a narrow conducting band around it. Their research shows us that the Seebeck coefficient of a narrow band is predicted to saturate and become temperature-independent when the temperature is high enough that kBT is larger than the width of the band.21 The saturating temperature Ts is proportional to the width of the narrow band,21 which is about at 900 K for CDM and for dual doped samples are about at 750 K. Thus, when the second elements are doped, the conduction band becomes narrower. The similar reports could be found in other manuscripts by Wang et al.13–15
It can be seen from Fig. 5 that the absolute value of the single-doped Seebeck coefficient is higher than that of the dual-doped in the entire test temperature range. At high temperatures, the material is restricted by Heikes. The Seebeck coefficient at the high-temperature limit is inversely proportional to the carrier concentration, the negative Seebeck values indicate that electron carriers dominate the whole system. With the introduction of the second element, the electron concentration in the material gradually increases, so that the Seebeck coefficient gradually decreases. Ca0.96Er0.02Re0.02MnO3 samples have the same Re3+ content, and the trend of the Seebeck coefficient is basically the same, so we can conclude that at high temperatures, the system's Seebeck is mainly dependent on the electron concentration.
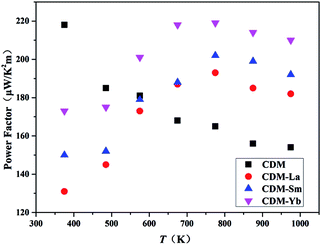
The power factor is calculated through the conductivity and Seebeck coefficient. The temperature dependence of the power factor is shown in Fig. 6. The power factors increase with introduction of a second additional element into CDM. The highest values for CDM, CDM-La, CDM-Sm, and CDM-Yb were 217 μW (K2 m)−1, 193 μW (K2 m)−1, 202 μW (K2 m)−1, 219 μW (K2 m)−1, respectively, and CDM-Yb has the highest power factor in all samples.
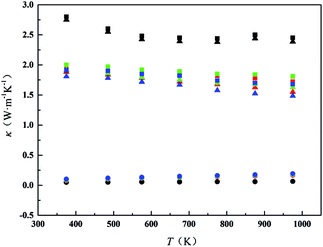
Fig. 7 shows the thermal conductivity (κ) of all samples from 300 K to 1000 K. The minimum thermal conductivity of CDM is 2.45 W m−1 K−1 at 973 K. CDM-La, CDM-Sm, and CDM-Yb, the lowest values are obtained 1.81 W m−1 K−1, 1.72 W m−1 K−1, 1.68 W m−1 K−1, respectively, at 973 K. It can be seen from Fig. 7 that the thermal conductivity of the different dual-doped samples is very close and the values differ by 8% to 12%, but the sample of the dual-doped than single doped show smaller thermal conductivity. The results show that the dual-doped more effectively reduce the thermal conductivity for the CaMnO3 system. As we all know that the total thermal conductivity (κ) can be expressed as the sum of the electronic thermal conductivity (κele) and the phonon thermal conductivity (κph). Where κph is the contribution from phonons and κele is the contribution from carriers. The electronic thermal conductivity is determined by the Wiedemann–Franz law:
| κele = LT/ρ | (2) |
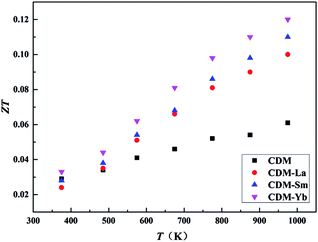
Temperature dependence of dimensionless figure-of-merit ZT is shown in Fig. 8. The figure of merit ZT is an important parameter in evaluating the thermoelectric property of materials. As the test temperature increases, the values of ZT for all of the samples increase in the whole test temperature range. The ZT values of CDM-La, CDM-Sm, and CDM-Yb are almost higher than that of CDM. The highest figure of merit ZT exceeds 0.12 at 973 K for CDM-Yb, which represents 50% improvement compared with single dysprosium-doped sample CDM. And it shows that these manganites could be good candidates as n-type materials for high-temperature thermoelectric application.
4. Conclusions
A series of perovskite-type ceramic materials Ca0.98Er0.02MnO3 and Ca0.96Er0.02Re0.02MnO3 (Re = La, Sm, Yb) which worked from 300 K to 1000 K with excellent thermoelectric properties was prepared sol–gel and cold-pressing method. Dual-doped is a very effective way to reduce the electrical resistivity and keeps a moderate absolute Seebeck coefficient. The introduction of second element leads to a remarked lower thermal conductivity. The highest figure of merit ZT exceeds 0.12 at 973 K for Ca0.96Er0.02Yb0.02MnO3 and it is about 50% improved compared with Ca0.98Er0.02MnO3 sample at the same temperature. The results confirmed that dual-doping improved thermal electric properties of Ca0.98Er0.02MnO3 efficiently.Conflicts of interest
There are no conflicts to declare.Acknowledgements
The work is financially supported by the Petroleum Production Engineering Institute Fund of Daqing Oil Field Limited Company, China (No. DQYT-1204003-2015-JS-824).Notes and references
- X. Zhang, X. Y. Ma, F. P. Zhang, P. X. Wu, Q. M. Lu, Y. Q. Liu and J. X. Zhang, Acta Phys. Sin., 2012, 61, 273–335 Search PubMed.
- Y. H. Lin, J. Lan, Z. Shen, Y. Liu, C. W. Nan and J. F. Li, Appl. Phys. Lett., 2009, 94, 425 Search PubMed.
- J. Han, Q. Sun and Y. Song, J. Alloys Compd., 2017, 705, 22–27 CrossRef CAS.
- Y. N. Huang, B. C. Zhao, S. Lin and Y. P. Sun, J. Alloys Compd., 2017, 705, 745–748 CrossRef CAS.
- H. C. Wang and C. L. Wang, Mater. Res. Bull., 2012, 47, 2252–2256 CrossRef CAS.
- F. P. Zhang, X. Zhang, Q. M. Lu, J. X. Zhang and Y. Q. Liu, J. Alloys Compd., 2011, 509, 4171–4175 CrossRef CAS.
- J. L. Lan, Y. H. Lin, H. Fang, A. Mei, C. W. Nan, Y. Liu, S. L. Xu and M. Peters, J. Am. Ceram. Soc., 2010, 93, 2121–2124 CrossRef CAS.
- H. Muguerra, B. Rivas-Murias, M. Traianidis, C. Marchal, P. Vanderbemden, B. Vertruyen, C. Henrist and R. Cloots, J. Alloys Compd., 2011, 509, 7710–7716 CrossRef CAS.
- T. Kobayashi, H. Takizawa, T. Endo, T. Sato, M. Shimada, H. Taguchi and M. Nagao, J. Solid State Chem., 1991, 92, 116–129 CrossRef CAS.
- M. Ohtaki, H. Koga, T. Tokunaga, K. Eguchi and H. Arai, J. Solid State Chem., 1995, 120, 105–111 CrossRef CAS.
- A. Kosuga, Y. Isse, Y. F. Wang, K. Koumoto and R. Funahashi, J. Appl. Phys., 2009, 105, 804 CrossRef.
- D. Flahaut, T. Mihara, R. Funahashi, N. Nabeshima, K. Lee, H. Ohta and K. Koumoto, J. Appl. Phys., 2006, 100, 2331 CrossRef.
- Y. Wang, Y. Sui and W. H. Su, J. Appl. Phys., 2008, 104, 93703 CrossRef.
- Y. Wang, Y. Sui, H. J. Fan, X. J. Wang, Y. T. Su, W. H. Su and X. Y. Liu, Chem. Mater., 2009, 21, 4653–4660 CrossRef CAS.
- Y. Wang, Y. Sui, X. J. Wang and W. H. Su, Appl. Phys. Lett., 2010, 97, 1457 Search PubMed.
- C. J. Liu, A. Bhaskar and J. J. Yuan, Appl. Phys. Lett., 2011, 98, 214101 CrossRef.
- A. Bhaskar, C. J. Liu and J. J. Yuan, J. Electron. Mater., 2012, 41, 2338–2344 CrossRef CAS.
- Y. H. Zhu, C. L. Wang, W. B. Su, J. C. Li, J. Liu, Y. L. Du and L. M. Mei, Ceram. Int., 2014, 40, 15531–15536 CrossRef CAS.
- Y. H. Zhu, C. L. Wang, H. C. Wang, W. B. Su, J. Liu and J. C. Li, Mater. Chem. Phys., 2014, 144, 385–389 CrossRef CAS.
- R. D. Shannon, Acta Crystallogr., 1976, 32, 751–767 CrossRef.
- R. P. Heikes and R. W. Ure, Thermoelectricity, Interscience, New York, 1961 Search PubMed.
- Y. H. Zhu, W. B. Su, J. Liu, Y. C. Zhou, J. C. Li, X. H. Zhang, Y. L. Du and C. L. Wang, Ceram. Int., 2015, 41, 1535–1539 CrossRef CAS.
- R. Kabir, R. M. Tian, T. S. Zhang, R. Donelson, T. T. Tan and S. Li, J. Alloys Compd., 2015, 628, 347–351 CrossRef CAS.
- A. Hmood, A. Kadhim and H. Abu Hassan, Mater. Chem. Phys., 2012, 136, 1148–1155 CrossRef CAS.
- A. Kadhim, A. Hmood and H. Abu Hassan, Mater. Sci. Semicond. Process., 2013, 16, 537–541 CrossRef CAS.
| This journal is © The Royal Society of Chemistry 2017 |

