 Open Access Article
Gaseous cyclohexanone catalytic oxidation by a self-assembled Pt/γ-Al2O3 catalyst: process optimization, mechanistic study, and kinetic analysis†
Zhuowei Chenga,
Xu Penga,
Chao Li a,
Jianming Yu*ab and
Zhuohuan Fenga
aCollege of Environment, Zhejiang University of Technology, Hangzhou 310014, P. R. China. E-mail: yjm@zjut.edu.cn; Fax: +86-0571-88320882; Tel: +86-0571-88320909
bCollaborative Innovation Center of Yangtze River Delta Region Green Pharmaceuticals, Zhejiang University of Technology, Hangzhou 310014, P. R. China
First published on 5th October 2017
Abstract
γ-Al2O3 nanocatalysts with a Pt loading of 0.6–1.0% were prepared successfully via a self-assembly method to be used in the catalytic oxidation of cyclohexanone in a fixed-bed reactor. The nanocatalysts were characterized by the Brunauer–Emmett–Teller method, X-ray diffraction, transmission electron microscopy, Fourier-transform infrared spectroscopy, and temperature programmed reduction-H2 to correlate their activity with their physiochemical properties. Based on these analyses, the catalytic oxidation efficiency for cyclohexanone and the optimal catalytic temperature of 1.0% Pt/γ-Al2O3 were the best among all the nanocatalysts. A novel response surface methodology (RSM) method was employed to evaluate the interactions of the gaseous cyclohexanone concentration (500–4000 mg m−3), the gas hourly space velocity (GHSV, 5000–20![[thin space (1/6-em)]](https://www.rsc.org/images/entities/char_2009.gif) 000 h−1), and relative humidity (RH 10–70%) on the catalytic oxidation under normal atmospheric pressure and a catalytic temperature of 235 °C. When the initial catalyst concentration, GSHV, and RH were 2000 mg m−3, 12
000 h−1), and relative humidity (RH 10–70%) on the catalytic oxidation under normal atmospheric pressure and a catalytic temperature of 235 °C. When the initial catalyst concentration, GSHV, and RH were 2000 mg m−3, 12![[thin space (1/6-em)]](https://www.rsc.org/images/entities/char_2009.gif) 000 h−1, and 50%, respectively, the efficiency was 86.5%, nearly equal to that (89.6%) predicted by the RSM model. Intermediate generation, CO2 production, and variations in the cyclohexanone oxidation route were evaluated under the optimal process parameters. During catalytic oxidation, nearly all the cyclohexanone was converted to CO2 and H2O, and the mineralization rate was 80% under a RH of 50%. A kinetic model was proposed to describe the interaction effects between the partial pressure and catalytic temperature on the conversion of cyclohexanone. It was found that the predicted values by the model fit well with the experimental values, with an R2 of 0.99.
000 h−1, and 50%, respectively, the efficiency was 86.5%, nearly equal to that (89.6%) predicted by the RSM model. Intermediate generation, CO2 production, and variations in the cyclohexanone oxidation route were evaluated under the optimal process parameters. During catalytic oxidation, nearly all the cyclohexanone was converted to CO2 and H2O, and the mineralization rate was 80% under a RH of 50%. A kinetic model was proposed to describe the interaction effects between the partial pressure and catalytic temperature on the conversion of cyclohexanone. It was found that the predicted values by the model fit well with the experimental values, with an R2 of 0.99.
1 Introduction
Atmospheric pollution has become a serious problem in recent years because of the rapid development of the chemical industry and increased human activities.1 As some of the main air pollutants, volatile organic compounds (VOCs) are directly released without any treatments, which not only increases the degree of atmospheric pollution, but also leads to harmful effects on human health.2 Recent studies showed that the increase of ozone in the troposphere is related directly to the emission of VOCs.3,4 Therefore, efficient and economic methods for reducing pollutants like VOCs are required.Among the various current technologies for VOC abatement, catalytic oxidation has been considered to be one of the most effective and promising technologies because of its low operation temperature, high purification efficiency, recoverable heat, and lack of secondary pollution.5,6 The performances of different methods for VOC removal are affected by several factors, such as the types of VOCs, the types of catalysts, the process parameters, and purification requirements.7,8 O'Malley and Hodentt9 showed that the reactivity of VOCs, in terms of total oxidation, with different functional groups, such as alcohols, aromatics, ketones, carboxylic acids, and alkanes, varies. Three types of catalysts are used widely for VOC oxidation, namely precious metals, transition metal oxides, and zeolites, and most studies have focused on the relationship between their structural characteristics and performances.10–13 Process parameters, such as target concentration, space velocity, and temperature, are mostly considered for the evaluation of the prepared catalysts. According to the previous studies, more attention should be paid to aromatics, chlorinated VOCs, and alkanes because aromatics (like benzene and toluene) are emitted mostly by industry, and chlorinated VOCs are toxic to catalysts (mainly because of the formation of highly chlorinated by-products), which affects its usage time, while alkanes are not oxidized efficiently by other methods (such as bio-oxidation and photo-oxidation).14
As an important industrial material, ketones are also used widely and emitted not only from the centralized emission (usually chimney) but also decentralized emission.15 Cyclohexanone is an important chemical material in the manufacture of nylon, caprolactam, adipic acid, and resin. Because of its low boiling point, cyclohexanone is highly volatile, and, thus, it is a typical VOC, which constitutes a serious threat to human health and the environment. Long-term exposure to low concentrations of cyclohexanone may result in serious diseases, e.g., neurasthenia and leukemia, while inhaling high levels of cyclohexanone in a short time causes headaches and unconsciousness, and it can anesthetize the central nervous system. Cyclohexanone and other VOCs transform into the precursor of ozone in the atmosphere, and they react with other precursors of ozone (like NOx) under light to form the most serious form of air pollution.16 Therefore, there is a need to control the production of cyclohexanone.
The essence of VOC oxidation is the breaking of chemical bonds. Once the first bond is broken, sequential reactions to form CO2 and H2O are accomplished more easily.17 Among the factors affecting VOC destruction (promoters, surface areas or sizes of the catalysts, and catalyst loading), the active component is the most crucial factor. The noble metals Pt and Pd in γ-Al2O3 catalysts have been used widely and efficiently for the oxidation of VOCs.18 Pd exhibits higher activity toward short-chain hydrocarbons, while Pt is more active for the oxidation of long-chain hydrocarbons and aromatics. Pt/γ-Al2O3 is widely known as one of the most effective commercial catalyst for the oxidation of hydrocarbon molecules such as benzene.18,19 As a result, Pt/γ-Al2O3 is usually added to a non-thermal plasma reactor for VOC removal. It has been shown that the incorporation of this catalyst might improve energy efficiency, maximize product yield, and minimize byproducts.20,21
Compared with other VOCs, there are few studies of the purification of cyclohexanone and its oxidation using different catalysts. Although Pt/γ-Al2O3 is the most widely applied catalyst,22 its use for cyclohexanone treatment has not been reported, and the oxidation mechanism of cyclohexanone has not been revealed. In addition, most previous studies only focused on the catalytic oxidation effect caused by a single factor, without investigating the interaction effects of different factors. As is well known, several process parameters collectively determine the VOC removal performance, and consideration of their combined effect is much more important.23 Such knowledge (like the optimal operational parameters) is useful for industrial applications. Based on these reasons, studies of the catalytic oxidation of cyclohexanone by Pt/γ-Al2O3 are needed not only to hasten its possible industrial application, but also to determine its oxidation mechanism.
In the present study, we used the Brunauer–Emmett–Teller method, transmission electron microscopy (TEM), X-ray diffraction (XRD), Fourier-transform infrared spectroscopy (FTIR), and temperature programmed reduction-H2 (H2-TPR) to evaluate the performance of a new, self-assembled Pt/γ-Al2O3 catalyst containing 1.0 wt% Pt in the catalytic oxidation of cyclohexanone and to conduct a structural characterization of the catalyst. The activity of the prepared catalyst was tested under several reaction conditions, and the optimal conditions (including the concentration of cyclohexanone, the relative humidity [RH], and the space velocity) were determined by the response surface methodology method, thus providing a quantitative understanding of the interaction effects and determining the relationship between the variables and the cyclohexanone removal efficiency. The product distribution and formation pathway of by-products are discussed to explore the oxidation mechanism of cyclohexanone. Additionally, a kinetic analysis of the catalytic process was also studied, and the obtained kinetic model was in good agreement with the experimental results. The fundamental information derived from this study is important for the application of Pt/γ-Al2O3 and other similar catalysts in cyclohexanone and other VOC abatement.
2 Experimental
2.1 Catalyst preparation
The Pt/γ-Al2O3 catalyst was prepared according to a previously reported procedure, with a few modifications.24,25 K2PtCl4 (1.4 g) was dissolved in 12 mL of distilled water, followed by the addition of an ethanol solution containing 2.36 g of bis-dba (dba = dibenzylideneacetone) and 2.8 g of sodium acetate at 50 °C. Then, the mixed solution was refluxed for 1 h at 90 °C, and finally it changed from an initial pale-yellow liquid into a dark purple precipitation. Then, the precipitate was filtered after 12 h, washed three times with 20 mL of n-pentane, and dried overnight under vacuum; the wash and dry cycle was conducted for twice. Then, Pt2(dba)3 was prepared for further use.A certain amount of Pt2(dba)3 was added to a propylene carbonate solution, placed in a stainless-steel cylinder, and mixed evenly. Then, hydrogen was used to replace the air for the balance of the partial pressure (3 MPa). The solution was stirred at room temperature for nearly 2 h until a brown colloid was produced, and then γ-Al2O3 was added with stirring for 24 h. The solid catalyst was separated by filtration and dried at 80 °C. Only trace levels of Pt were observed in the clear filtrate, indicating a complete adsorption of the Pt on the carrier. Different mass fraction Pt-nano particles (0.6–1.0%) of γ-Al2O3 were prepared by the assembled method. The packing density of the prepared catalyst was 0.826 kg cm−3 and the particle size was 0.5–3.0 mm. For comparison, a blank γ-Al2O3 catalyst with no Pt loading was prepared.
2.2 Catalyst characterization
TEM images were acquired using a Tecnai G2 F30 S-Twin (Philips-FEI, Amsterdam, the Netherlands) instrument at an acceleration voltage of 200 kV. The structures of the catalysts were assessed using an XRD analyzer (PANalytical, Almelo, the Netherlands). The conditions of analysis were as follows: Cu-Kα radiation (λ = 1.54178 Å); scanning rate, 0.03° s−1; and scanning range (2θ), 20–80 °C.The BET surface area of the catalyst was measured by N2 adsorption at a liquid-nitrogen temperature of 196 °C, using a surface area analyzer (ASAP 2010; Micromeritics, Norcross, GA, USA). To assess surface functional groups, FTIR (Nicolet 6700; Thermo Scientific, Waltham, MA, USA) was conducted at wave numbers of 400–4000 cm−1. TPR-H2 measurements were conducted on a Micromeritics Pulse ChemiSorb 2705 to address the reducibility of nanocatalysts. Approximately 50 mg of the sample was loaded into a reactor and pretreated at 200 °C in an Ar stream for 1 h to remove the adsorbed carbonates and hydrates. After cooling to 50 °C, a flow of 10% H2–90% Ar was passed through the samples, and the temperature was increased at a rate of 10 °C min−1 up to 1000 °C, while a thermal conductivity detector (TCD) was used.
2.3 Experimental setup
The measurement of the catalytic activity of the oxidation of cyclohexanone was performed at atmospheric pressure in a conventional fluidized bed reactor reaction system, and the schematic diagram is shown in Fig. S1.†Air was supplied by an air-compressor and divided into three streams, all of which were controlled by a mass flow controller. One was saturated with cyclohexanone by injecting it into a bottle of cyclohexanone liquid, followed by mixing with a second air stream to dilute the gaseous cyclohexanone to obtain a certain concentration. The third one was injected into distill water to produce a certain humidity of gas. Finally, all these streams went into the mixed bottle, and the reactant waste gas was obtained.
2.4 RSM design
RSM (Design Expert Version 8.0) was adopted in this study, and central composite design (CCD) is one of the most popular methods for the experimental design. Three factors were considered with two levels. The α (α = ±1.2) distance was designed according to the need of the experiments, and six central points were generated by the automatic system, as shown in Table 1.| Variables | Factorial | Start point | Center point | |||
|---|---|---|---|---|---|---|
| Lower value (−1) | Upper value (+1) | Lower value (−α) | Upper value (+α) | (0) | ||
| A: substrate (mg m−3) | 500 | 4000 | 150 | 4350 | 2250 | 2250 |
| B: RH (%) | 10 | 70 | 4 | 76 | 40 | 40 |
| C: GHSV (h−1) | 5000 | 20![[thin space (1/6-em)]](https://www.rsc.org/images/entities/char_2009.gif) 000 000 |
3500 | 21![[thin space (1/6-em)]](https://www.rsc.org/images/entities/char_2009.gif) 500 500 |
12![[thin space (1/6-em)]](https://www.rsc.org/images/entities/char_2009.gif) 500 500 |
12![[thin space (1/6-em)]](https://www.rsc.org/images/entities/char_2009.gif) 500 500 |
After analyzing the responses according to the designed experiments, a mathematical model with interactions was obtained by the following equation:
2.5 Analytical methods
Inlet gas and outlet gas were analyzed by a gas chromatograph equipped with a flame ionization detector (GC-FID, Agilent GC 7890N; Santa Clara, CA, USA). The analytical column was a capillary column (Agilent 19091N-213 HP-INNOWax polyethylene glycol 32 m × 320 μm × 0.50 μm) with a temperature of 180 °C, while the detector temperature was 200 °C. The sample volume was 1000 μL, and each experiment was repeated three times under the same conditions.CO2 accumulation was tested with an HP-Plot-Q column (30 m × 0.32 mm × 20 μm) and a TCD. Helium at a flow rate of 5 mL min−1 was used as the carrier gas. The column and detector temperatures were 313 K and 473 K, respectively.
The off-gas (containing various gaseous products) was captured using an adsorption tube at a set of temperatures for 1 h. Then, the absorbed compounds were released into a thermal desorption instrument, which were injected into a GC-mass spectrometry (GC-MS) system (Agilent 7890 A GC equipped with an Agilent 5975C Mass Selective Detector) with an HP-INNOWax capillary column (60 m × 0.32 mm × 0.5 μm). The temperature was maintained at 36 °C for 2 min, and then it was increased to 250 °C at a rate of 10 °C min−1, at which point it was maintained for 6 min.
For other small organic intermediates, the catalysts were analyzed by FTIR (Nicolet 6700, Thermo) in the wave number range of 400–4000 cm−1. The differences in the peaks between the fresh and used catalyst might be some intermediates that are generated by the catalytic process.
3 Results and discussion
3.1 Catalyst characterization
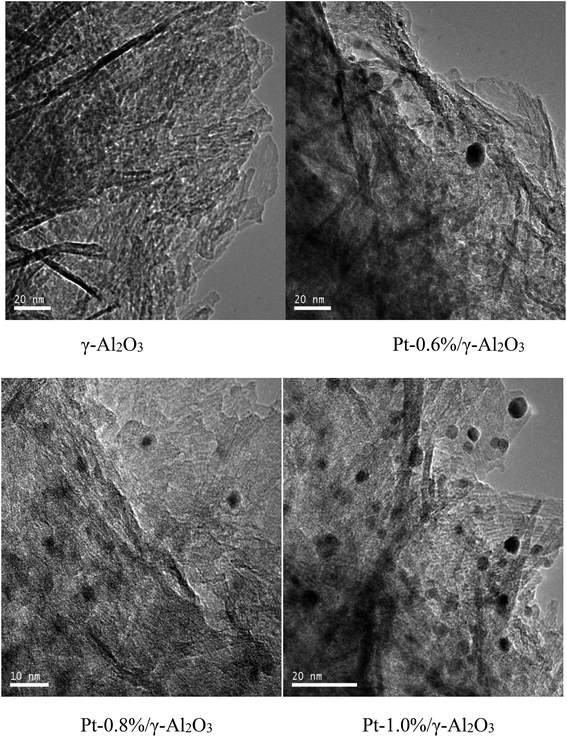
γ-Al2O3 catalysts with three different Pt contents (0.6%, 0.8%, and 1.0%, wt%) were prepared, and their structural characteristics were analyzed by BET, TEM, XRD, FTIR, and H2-TPR. The optimal catalyst was determined by both the structure and conversion of cyclohexanone.| Sample | SBET (m2 g−1) | Total pore volume (cm3 g−1) | Pore size of distribution (%) | ||
|---|---|---|---|---|---|
| <2 nm | 2–50 nm | >50 nm | |||
| γ-Al2O3 | 189 | 0.96 | 6.1 | 90.1 | 3.8 |
| Pt-0.6% | 179 | 0.94 | 5.9 | 90.2 | 3.9 |
| Pt-0.8% | 168 | 0.88 | 5.8 | 90.4 | 3.8 |
| Pt-1.0% | 150 | 0.83 | 4.3 | 91.1 | 4.6 |
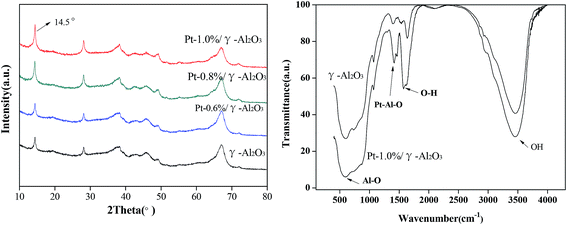
Fig. 2b describes the FTIR spectra of the Pt-1.0%/γ-Al2O3 catalysts and γ-Al2O3. Stretching vibrations for structural –OH and adsorbed H2O for all the samples were observed at wave numbers of approximately 3430, 1640, and 1410 cm−1, and the peak intensity of the Pt-1.0%/γ-Al2O3 catalyst was much stronger than that of unloaded γ-Al2O3. This difference suggested that more hydrogen bonds formed on the catalyst, which would lead to the production of more hydroxyl radicals, thereby benefiting the catalytic oxidation of VOCs.30 A characteristic vibrational band next to 588 cm−1 for Al–O–Al has been reported, and its intensity was much stronger after Pt loading. A new vibration telescopic peak at 1474 cm−1 appeared for the prepared Pt-1.0%/γ-Al2O3 catalyst. This peak could be a Pt–Al–O bond that was formed by the strong interaction between Pt and γ-Al2O3 during the preparation. Such bond formation could enhance the catalytic activity.24
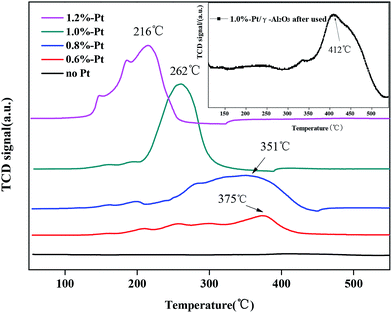
In addition, according to the H2-TPR spectra of Pt-1.0%/γ-Al2O3 before and after the purification of gaseous cyclohexanone, we found that the reduction peak shifted to a much higher temperature of 412 °C, which suggested that the active center around Pt was lost after utilization.31
3.2 Catalytic activity and stability during cyclohexanone oxidation
Fig. 4a presents the catalytic activities for cyclohexanone oxidation as a function of the reaction temperature. The conversion of cyclohexanone using the Pt-(0.8–1.0%)/γ-Al2O3 catalysts was approximately 100% at 230 °C, while Pt-0.6%/γ-Al2O3 and the support γ-Al2O3 had lower and no activity at this temperature, respectively. Fig. 4a shows that the activity of the synthesized catalysts increased with increasing amounts of Pt loading. We also found an abrupt change in the catalytic activity at 190 °C for larger amounts of Pt-loading, which was much lower than that observed for Pt-0.6%/γ-Al2O3. Based on these results, proper Pt amounts (0.8–1.0%) might induce higher catalytic activity, but higher Pt loading only increased the catalytic activity over a limited temperature range. Therefore, considering the handling cost and the catalyst's characteristics, Pt-1.0%/γ-Al2O3 could be considered as the most suitable catalyst for the catalytic oxidation of cyclohexanone.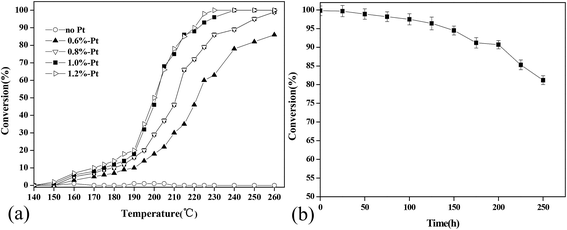 | ||
| Fig. 4 Conversion of cyclohexanone by different Pt-content γ-Al2O3 catalysts (a) and the catalytic stability of the Pt-1.0%/γ-Al2O3 catalyst (b). | ||
Catalytic stability is critical for the application of catalytic oxidation. To investigate the long-term activity of the Pt-1.0%/γ-Al2O3 catalyst, experiments were performed for up to 250 h, and the results are shown in Fig. 4b. A decrease in cyclohexanone conversion from 100% to less than 80% was observed at 225 h. A deactivation of noble metal catalysts during VOC catalytic oxidation is a common phenomenon. Most frequently, deactivation of noble metal-loaded catalysts is related to metal sintering, transformation of the active metallic oxide to a metal element at higher temperature, or occlusion by the support.36,37 In this case, to clarify the reasons for the deactivation of the 1.0% Pt-based catalyst, two views were taken into consideration: a change of the BET surface and a temperature shift for the H2-reduction peak. A small difference was observed in the BET surface areas of the catalyst samples before and after the catalytic tests. For fresh Pt-1.0%/γ-Al2O3, the BET surface area was 150 m2 g−1, while for the aged catalyst, the BET surface area decreased to nearly 122 m2 g−1. Additionally, the H2-TPR data indicated that the aged catalyst had a much higher temperature for the reduction peak. Other studies also found these mostly similar phenomena when they studied catalyst stability.38,39 Fig. S2† shows the morphology images of the catalyst before and after use. The color changed from brown to yellow, which suggested that catalytic intermediates accumulated at the surface of catalysts and catalytically active elements might be gradually lost during the utilization. This phenomenon is similar to that reported in other studies, which showed that coking deactivated catalysts after long periods of use.40,41
3.3 Optimization of the process parameters by RSM
Several process parameters have a combined effect on catalytic oxidation, and using a single factor may not accurately describe the actual situation.23 In a fixed-bed catalytic-oxidation reactor, the reaction processes are very complex; however, most studies usually focused on the influence of single process parameter variables on catalytic degradation, and they rarely considered the combined effect by jointly examining the effect of several parameters. In the present study, CCD,42 the most popular experimental method, was used to obtain the optimal operational conditions for cyclohexanone catalytic oxidation.Three main parameters, the initial catalyst concentration, the RH, and the GHSV, were chosen. A series of experiments were conducted, and the results of the CCD are shown in Table 3. Through the interactive factors analysis by analysis of variance, we found that the initial catalyst concentration and the GHSV had obvious effects on the catalytic oxidation of cyclohexanone, as did the RH. Additionally, the combined effect of every combination of two factors was obvious, indicating that the interactions between two different parameters were very strong, for example, between the initial catalyst concentration and the GHSV, and between the RH and the GHSV. Not only in terms of single factors, but also in combination, both the GHSV and RH were more important parameters. The removal efficiency of cyclohexanone decreased with increasing GHSV. A much larger GHSV will remove a large amount of heat, and thus affect the catalytic oxidation efficiency. Meanwhile, a larger RH also had a negative effect on the removal efficiency, since there was competition between the much greater number of H2O molecules and the target pollutants in the surface-active sites. All these phenomena could be obtained from the response surface graph and a contour plot between two process parameters, which are supplied in Fig. S3.†
| Run | Factor 1 | Factor 2 | Factor 3 | Response 1 |
|---|---|---|---|---|
| A: substrate mg m−3 | B: RH% | C: GHSV h−1 | DE% | |
| 1 | 1 | 1 | 1 | 18.96 |
| 2 | 0 | 0 | 0 | 89.43 |
| 3 | −1 | −1 | 1 | 40.33 |
| 4 | 0 | 0 | 0 | 86.21 |
| 5 | 0 | 1.2 | 0 | 76.12 |
| 6 | 1 | −1 | −1 | 38.81 |
| 7 | 0 | 0 | 0 | 86.23 |
| 8 | 0 | 0 | 0 | 89.46 |
| 9 | 0 | 0 | 1.2 | 70.22 |
| 10 | 1 | −1 | 1 | 71.20 |
| 11 | 0 | 0 | −1.2 | 39.33 |
| 12 | 1 | 1 | −1 | 28.92 |
| 13 | 0 | 0 | 0 | 88.33 |
| 14 | 1.2 | 0 | 0 | 79.93 |
| 15 | −1 | 1 | −1 | 43.82 |
| 16 | 0 | 0 | 0 | 87.36 |
| 17 | −1 | 1 | 1 | 30.21 |
| 18 | −1.2 | 0 | 0 | 94.30 |
| 19 | 0 | −1.2 | 0 | 51.33 |
| 20 | −1 | −1 | −1 | 46.83 |
A predicted model was obtained from the CCD and RSM analysis and used to demonstrate the relationships among the initial catalyst concentration, the GSHV, and the RH within the range of the tested values. The mathematical model is given below:
| Conversion efficiency = 89.18 − (1.89 × A) − (4.18 × B) + (3.62 × C) − (6.12 × B × A) + (5.32 × A × C) − (6.18 × B × C) − (3.22 × A2) − (19.46 × B2) − (25.68 × C2) |
According to analysis from the RSM model, the maximum conversion efficiency was predicted to be 89.6%, when the initial catalyst concentration, the GSHV, and the RH were 1992.26 mg m−3, 11![[thin space (1/6-em)]](https://www.rsc.org/images/entities/char_2009.gif) 788.84 h−1, and 47.02%, respectively. A confirmatory test was conducted using an initial concentration of 2000 mg m−3, a GSHV of 12
788.84 h−1, and 47.02%, respectively. A confirmatory test was conducted using an initial concentration of 2000 mg m−3, a GSHV of 12![[thin space (1/6-em)]](https://www.rsc.org/images/entities/char_2009.gif) 000 h−1, and an RH of 50%, and the actual efficiency was 86.5%, suggesting that the predicted result was in good agreement with the experimental results.
000 h−1, and an RH of 50%, and the actual efficiency was 86.5%, suggesting that the predicted result was in good agreement with the experimental results.
3.4 Intermediate distribution and mechanistic analysis
Under the optimal reaction conditions, the oxidation products of cyclohexanone in the effluent were analyzed by GC-MS, and the results are shown in Fig. 5. The results showed that several intermediates, such as benzene, toluene, and cyclopentanone, formed during the catalytic process.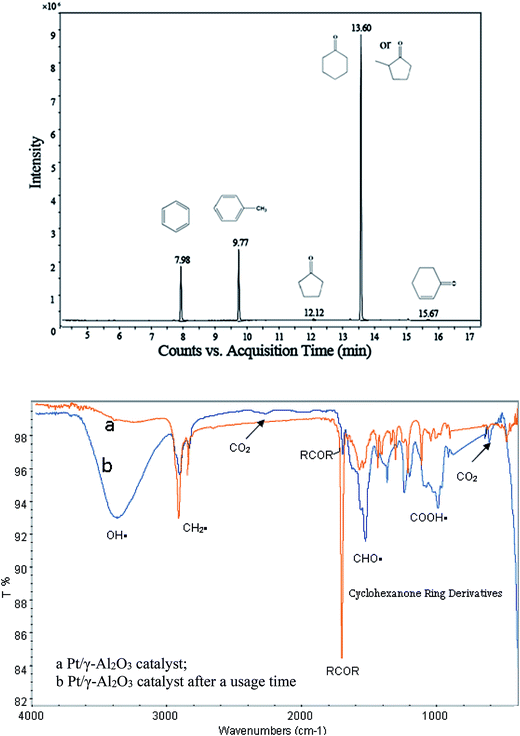 | ||
| Fig. 5 GC-MS and FTIR spectra for the intermediate products of the cyclohexanone catalytic oxidation. | ||
Although the concentrations of some intermediates in the outlet were too low to enable their detection by GC-MS, they might have accumulated on the surface of the catalyst. Therefore, Pt/γ-Al2O3 (before and after use) was analyzed by FTIR. Its spectrum of intermediates is shown in Fig. 5, in which some differences between the curves were observed. A larger peak at a wave number of 3400 cm−1 was observed for the used catalyst, and this peak was identified as OH˙. The intensity of a peak at approximately 2900–3100 cm−1 (mainly belonging to CH3˙ or CH2˙) decreased, suggesting that it might have been oxidized during the reaction. Additionally, some new peaks that were observed at approximately 2400–2300 cm−1 and 700–500 cm−1 might be CO2. Peaks at approximately 1900–1000 cm−1 indicated that cyclohexanone derivatives accumulated. Some small aldehydes and carboxylic acids also formed during the catalytic oxidation of cyclohexanone, which might be expressed as the peaks at approximately 1600–1500 cm−1 and 1300–1000 cm−1, respectively. Based on these FTIR analyses, the main intermediates were alcohols, small-molecule carboxylic acids, aldehydes, carbon dioxide, and cyclohexanone ring derivatives.
Nobel metals for catalytic oxidation may follow two classic mechanisms: the Langmuir–Hinshelwood model (in which all reactants are adsorbed prior to the redox process) and the Eley–Rideal model (in which gaseous hydrocarbon is oxidized directly by the free radical O˙).17,43 The general mechanism of oxidation using noble metals is considered to involve the dissociative adsorption of oxygen with the formation of a “surface site”. Then, the gaseous organic reactant can react directly at these surface sites. However, sometimes the reactant is also weakly adsorbed initially and then oxidized. It has been proposed that catalytic oxidation often occurs by a parallel-series mechanism. Lattice oxygen, as well as gas-phase oxygen, participates in the catalytic oxidation process, in which [Pt4+] acting as an active redox center plays an important role during the redox cycle.44–46
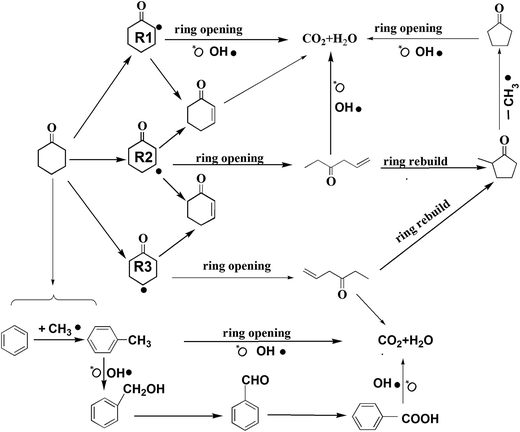
Based on the detected intermediates and the mechanism of catalytic oxidation, the main degradation pathways of cyclohexanone were proposed, and they are shown in Fig. 6. The removals of cyclohexanone can occur in two possible ways, in which both the dissociative adsorption of oxygen and gas-phase radicals (such as O˙, HO2˙, and OH˙) have the largest effects. Near the surface of the catalyst where oxygen is absent, H-abstraction always played a role during the reaction process.
In the first way, cyclohexanone is converted via H2-abstraction reactions to yield the cyclohexanone radicals R1, R2, and R3. However, these radicals are unstable and might change through a series of rapid reactions, forming 2-cyclohexene-1-ketone (for R1, R2, and R3) and C3H5COC2H5 (for R2 and R3).47 2-cyclohexene-1-ketone can be attacked directly by the hydroxyl radical, oxygen free radical, and other free radicals, finally forming complete mineralized products (e.g., H2O and CO2). The catalytic oxidation of C3H5COC2H5 is relatively complex. Through ring regeneration, C3H5COC2H5 is converted to methyl cyclopentyl ketone, and then it is attacked by radicals to form cyclopentanone via a missing methyl radical. Finally, cyclopentanone undergoes ring opening and is further oxidized to form CO2 and H2O. In this study, the intermediates of 2-cyclohexene-1-ketone were not detected, and this pathway was hypothesized based on previous studies.46,47
In the second way (shown at the bottom of Fig. 6), reduced intermediates (such as benzene, toluene) appeared. It might be that the distribution of oxygen was inhomogeneous in the reaction atmosphere; some places nearly the surface of the catalyst had a lower oxygen concentration (<2%) or no oxygen. Therefore, when both free oxygen and oxygen adsorbed by the catalyst surface were consumed, cyclohexanone underwent a reforming reaction (H-abstraction) that was induced by the active component of catalyst (mainly Pt4+), which produced some reduced intermediates like benzene and toluene.48 Hydrogen on the benzene ring could be replaced by CH3˙ under special conditions; as a result, benzene was converted to toluene. When toluene and benzene left the surfaces, both these compounds could be attacked by free radicals (such as oxygen free radical), thereby resulting in the formation of benzyl alcohol. Then this compound underwent a series of hydroxylation and oxidation reactions of its aromatic ring, resulting in its conversion to benzaldehyde and benzoic acid. All these intermediates might be easily oxidized to the final products (CO2 and H2O).
To evaluate the prepared catalyst for the complete removal of cyclohexanone, the amount of CO2 was measured by a gas chromatograph equipped with a TCD detector. The initial concentrations of cyclohexanone and the GSHV were the same as the obtained optimal values, while RHs were taken at three different ranges. Fig. S4† shows that both the catalytic oxidation efficiency and mineralized efficiency increased with increasing reaction temperatures. We found that higher RHs (65–75%) had a more negative effect on the mineralization, which indicated that more H2O could compete with the reactants and intermediates for the active site on the surface of the catalyst. According to our calculations, the maximum mineralization rate was nearly 80% under a RH of 50%.
3.5 Kinetic analysis
To study the kinetics of cyclohexanone catalytic oxidation using Pt/γ-Al2O3, a more sophisticated kinetic model was used as follows:49,50where Pcyclohexanone and PO2 are the partial pressure of cyclohexanone and oxygen, respectively; a and b are the reaction orders; k0 is the kinetic constant; E refers to the activation energy of the reaction; and R is the molar gas constant (equal to 8.314 J mol−1 K−1).
To obtain a and b, a series of experiments were conducted under different partial pressures of cyclohexanone and oxygen. The calculated reaction rates are shown in Table 4. Table 4 shows that the partial pressure of cyclohexanone had a decisive influence on the reaction rate under both high and low temperatures. When the temperature was kept constant, the reaction rate increased with increasing partial pressures, and the increase of the reaction rate at high temperatures was much larger than the one obtained at low temperatures. The effects of oxygen were not greater than 2%. When the catalytic reaction occurred at low temperatures, the oxygen taking part in the reaction might be the adsorbed oxygen on the surface of the active catalyst, and the oxygen coverage would increase slightly with increasing partial pressures; at the same time, the absorbed oxygen would also gradually leave the surface. As a result, the oxygen coverage decreased because the absorbed rate was less than the desorbed one, finally arriving at a lower value when the adsorption and desorption were equal. Therefore, the effect of the partial pressure of oxygen can be ignored, which is to say that b = 0; our results are similar to those of Artizzu-Duart et al.51
| Cyclohexanone partial pressure (pa) | Oxygen partial pressure (pa) | Reaction rate/(10−6 mol g−1 s−1) | ||||
|---|---|---|---|---|---|---|
| 453 | 463 | 473 | 483 | 493 | ||
| 50 | 3000 | 1.221 | 1.480 | 1.910 | 2.620 | 3.990 |
| 100 | 1.469 | 1.700 | 2.171 | 3.120 | 4.345 | |
| 150 | 1.661 | 1.950 | 2.430 | 3.431 | 4.635 | |
| 200 | 1.812 | 2.211 | 2.720 | 3.861 | 5.065 | |
| 250 | 1.981 | 2.440 | 3.031 | 4.400 | 5.385 | |
| 300 | 2.146 | 2.640 | 3.261 | 4.521 | 5.833 | |
| 100 | 500 | 1.357 | 1.563 | 1.814 | 2.451 | 3.614 |
| 1000 | 1.358 | 1.564 | 1.816 | 2.450 | 3.615 | |
| 1500 | 1.358 | 1.565 | 1.815 | 2.452 | 3.614 | |
| 2000 | 1.359 | 1.565 | 1.817 | 2.451 | 3.616 | |
| 2500 | 1.360 | 1.566 | 1.816 | 2.450 | 3.614 | |
| 3000 | 1.361 | 1.567 | 1.816 | 2.450 | 3.615 | |
The reaction rate can be written as follows:
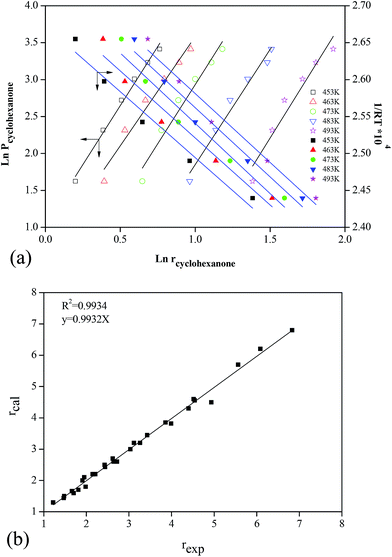
Using the logarithm method, some parallel lines between ln![[thin space (1/6-em)]](https://www.rsc.org/images/entities/char_2009.gif) Pcyclohexanone and ln
Pcyclohexanone and ln![[thin space (1/6-em)]](https://www.rsc.org/images/entities/char_2009.gif) rcyclohexanone were obtained under different temperatures (Fig. 7a). The slopes of these lines were the value of a, 0.31.
rcyclohexanone were obtained under different temperatures (Fig. 7a). The slopes of these lines were the value of a, 0.31.
To obtain the values of E and k0, the logarithm method was also used. Some parallel lines were obtained under different process parameters, with ln![[thin space (1/6-em)]](https://www.rsc.org/images/entities/char_2009.gif) rcyclohexanone and ln
rcyclohexanone and ln![[thin space (1/6-em)]](https://www.rsc.org/images/entities/char_2009.gif) Pcyclohexanone, and ln
Pcyclohexanone, and ln![[thin space (1/6-em)]](https://www.rsc.org/images/entities/char_2009.gif) rcyclohexanone and ln(1/RT) (Fig. 7). Based on these lines, E and k0 were 52.516 kJ mol−1 and 1.10 × 10⁶, respectively. These results are very promising because they imply that the modification of γ-Al2O3 yielded a very effective synthetic effect, which induced E values that are comparable to those of some noble metal or dual-metal catalysts in the VOC oxidation process. Finally, the reaction rate was obtained as follows:
rcyclohexanone and ln(1/RT) (Fig. 7). Based on these lines, E and k0 were 52.516 kJ mol−1 and 1.10 × 10⁶, respectively. These results are very promising because they imply that the modification of γ-Al2O3 yielded a very effective synthetic effect, which induced E values that are comparable to those of some noble metal or dual-metal catalysts in the VOC oxidation process. Finally, the reaction rate was obtained as follows:
To determine the accuracy of this model, experiments were conducted, and the results were compared with the values predicted by the model. Fig. 7b shows that the theoretical model was in good agreement with the experimental results, and the relative deviation was less than 3%, with an R2 of 0.9934. Therefore, the obtained kinetics model for cyclohexanone catalytic oxidation was accurate and credible compared to the actual experimental values.
4 Conclusions
A platinum-doped γ-Al2O3 catalyst was prepared and used for the complete oxidation of cyclohexanone in the present study. A series of characterizations, including TEM, H2-TPR, FTIR, and BET, were used to identify the structure and properties of the prepared catalysts. The results showed that nano Pt or Pt oxides formed as the crystalline phase on the Al2O3 support, with a larger surface area for catalytic application. Other experiments revealed that 1.0% Pt–γ-Al2O3 had a higher activity for the abatement of cyclohexanone. Through an RSM analysis, the optimal process parameters were obtained, and it was found that the GHSV and RH had much greater interaction effects on the conversion of cyclohexanone. According to the model based on the RSM, the predicted catalytic oxidation efficiency was similar to the experimental value under the optimal operation conditions. A possible conversion pathway was constructed based on the detected intermediates, and the results showed that both the dissociative adsorption of oxygen and gas-phase radicals (such as O˙, HO2˙, OH˙) had effects. Based on the reaction rates under different partial pressures of oxygen and cyclohexanone, a kinetic model was created with the obtained fitting constants, and it accurately predicted the rates of catalytic oxidation. This study provides a possibility for the catalytic combustion of cyclohexanone in industrial applications.Conflicts of interest
There are no conflicts of interest to declare.Acknowledgements
This work was supported by National Natural Science Foundation of China (21576241), Zhejiang Provincial Natural Science Foundation of China (No. LY15E080022), and the Zhejiang Open Foundation of the Most Important Subjects (No. 20150318). We also thank International Science Editing for the revision of language and grammar.References
- J. H. Seinfeld, S. N. Pandis and K. Noone, Phys. Today, 1998, 51, 88–90 CrossRef.
- M. A. Mehlman, Teratog., Carcinog., Mutagen., 2010, 10, 399–408 CrossRef.
- J. Suthawaree, Y. Tajima, A. Khunchornyakong, S. Kato, A. Sharp and Y. Kajii, Atmos. Res., 2012, 104–105, 245–254 CrossRef CAS.
- L. Xue, R. Gu, T. Wang, X. Wang, S. Saunders, D. Blake, P. K. K. Louie, C. W. Y. Luk, I. Simpson and Z. Xu, Atmos. Chem. Phys., 2016, 16, 1–26 Search PubMed.
- K. Everaert and J. Baeyens, J. Hazard. Mater., 2004, 109, 113–139 CrossRef CAS PubMed.
- X. Ma, F. Xi, G. Jie, H. Cao, X. Suo, H. Sun and M. Zheng, Appl. Catal., B, 2014, 147, 666–676 CrossRef CAS.
- C. T. Wong, A. Z. Abdullah and S. Bhatia, J. Hazard. Mater., 2008, 157, 480–489 CrossRef CAS PubMed.
- D. Delimaris and T. Ioannides, Appl. Catal., B, 2009, 89, 295–302 CrossRef CAS.
- A. O'Malley and B. K. Hodnett, Catal. Today, 1999, 54, 31–38 CrossRef.
- N. Blanch-Raga, M. D. Soriano, A. E. Palomares, P. Concepción, J. Martínez-Triguero and J. M. L. Nieto, Appl. Catal., B, 2013, 130, 36–43 CrossRef.
- Y. Dai, X. Wang, Q. Dai and D. Li, Appl. Catal., B, 2012, 111, 141–149 CrossRef.
- B. Dou, S. Li, D. Liu, R. Zhao, J. Liu, Q. Hao and B. Feng, RSC Adv., 2016, 6, 53852–53859 RSC.
- P. Liu, H. He, G. Wei, D. Liu, X. Liang, T. Chen, J. Zhu and R. Zhu, Microporous Mesoporous Mater., 2017, 239, 101–110 CrossRef CAS.
- M. S. Kamal, S. A. Razzak and M. M. Hossain, Atmos. Environ., 2016, 140, 117–134 CrossRef CAS.
- S. Cakmak, R. E. Dales, L. Liu, L. M. Kauri, C. L. Lemieux, C. Hebbern and J. Zhu, Environ. Pollut., 2014, 194, 145–151 CrossRef CAS PubMed.
- A. Kansal, J. Hazard. Mater., 2009, 166, 17–26 CrossRef CAS PubMed.
- Z. Abbasi, M. Haghighi, E. Fatehifar and S. Saedy, J. Hazard. Mater., 2011, 186, 1445–1454 CrossRef CAS PubMed.
- H. S. Kim, T. W. Kim, H. L. Koh, S. H. Lee and B. R. Min, Appl. Catal., A, 2005, 280, 125–131 CrossRef CAS.
- J. Li, S. Han, S. Bai, X. Shi, S. Han, H. Song, Y. Pu, X. Zhu and W. Chen, Environ. Eng. Sci., 2011, 28, 395–403 CrossRef CAS.
- G. J. Sang, K. H. Kim, D. H. Shin, N. S. Nho and K. H. Lee, Korean J. Chem. Eng., 2007, 24, 522–526 CrossRef.
- S. K. P. Veerapandian, C. Leys, N. D. Geyter and R. Morent, Catalysts, 2017, 113 CrossRef.
- F. Rahmani, M. Haghighi and P. Estifaee, Microporous Mesoporous Mater., 2014, 185, 213–223 CrossRef CAS.
- U. U. Tezcan, F. Ates, N. Erginel, O. Ozcan and E. Oduncu, J. Environ. Manage., 2015, 155, 89–96 CrossRef PubMed.
- L. Di, Z. Xu, K. Wang and X. Zhang, Catal. Today, 2013, 211, 109–113 CrossRef CAS.
- J. H. Li, P. Ao, X. Q. Li, X. S. Xu, X. X. Xu, X. Gao and X. H. Yan, Acta Phys.-Chim. Sin., 2015, 31, 173–180 CAS.
- H. Nishihara, S. R. Mukai, Y. Fujii, T. Tago, T. Masuda and H. Tamon, J. Mater. Chem., 2006, 16, 3231–3236 RSC.
- T. Sano, N. Negishi, E. Sakai and S. Matsuzawa, J. Mol. Catal. A: Chem., 2006, 245, 235–241 CrossRef CAS.
- A. Bueno-López, K. Krishna and M. Makkee, Appl. Catal., A, 2008, 342, 144–149 CrossRef.
- W. J. Liang, L. Ma, H. Liu and J. Li, Chemosphere, 2013, 92, 1390–1395 CrossRef CAS PubMed.
- L. Marchese, E. Borello, S. Coluccia, G. Martra and A. Zecchina, Stud. Surf. Sci. Catal., 1993, 75, 2523–2526 CrossRef CAS.
- P. Panagiotopoulou and D. I. Kondarides, J. Catal., 2008, 260, 141–149 CrossRef CAS.
- Y. Ji, Z. Zhao, A. Duan, G. Jiang and J. Liu, J. Phys. Chem. C, 2009, 113, 7186–7199 CAS.
- A. S. Ivanova, E. M. Slavinskaya, R. V. Gulyaev, V. I. Zaikovskii, O. A. Stonkus, I. G. Danilova, L. M. Plyasova, I. A. Polukhina and A. I. Boronin, Appl. Catal., B, 2010, 97, 57–71 CrossRef CAS.
- B. Bai, Q. Qiao, H. Arandiyan, J. Li and J. Hao, Environ. Sci. Technol., 2015, 50, 2635 CrossRef PubMed.
- W. Tang, M. Yao, Y. Deng, X. Li, N. Han, X. Wu and Y. Chen, Chem. Eng. J., 2016, 306, 709–718 CrossRef CAS.
- A. T. Gremminger, R. Popescu, J. D. Grunwaldt and O. Deutschmann, Catal. Today, 2015, 258, 470–480 CrossRef CAS.
- K. J. Smith, R. Gholami and M. Alyani, Catalysts, 2015, 5, 561–594 CrossRef.
- J. Okal, M. Zawadzki and K. Baranowska, Appl. Catal., B, 2016, 194, 22–31 CrossRef CAS.
- H. Chen, Y. Yan, Y. Shao and H. Zhang, RSC Adv., 2014, 4, 55202–55209 RSC.
- M. Gallastegi-Villa, A. Aranzabal, M. Romero-Sáez, J. A. González-Marcos and J. R. González-Velasco, Chem. Eng. J., 2014, 241, 200–206 CrossRef CAS.
- Q. Huang, X. Xue and R. Zhou, J. Hazard. Mater., 2010, 183, 694–700 CrossRef CAS PubMed.
- Z. Qi, X. Yang, W. Deng, X. C. Le and X. F. Li, J. Environ. Sci., 2016, 42, 1–5 CrossRef PubMed.
- J. J. Spivey, Ind. Eng. Chem. Res., 1989, 26, 2165–2180 CrossRef.
- G. Avgouropoulos, E. Oikonomopoulos, D. Kanistras and T. Ioannides, Appl. Catal., B, 2006, 65, 62–69 CrossRef CAS.
- V. Balcaen, R. Roelant, H. Poelman, D. Poelman and G. B. Marin, Catal. Today, 2010, 157, 49–54 CrossRef CAS.
- V. P. Santos, M. F. R. Pereira, J. J. M. Órfão and J. L. Figueiredo, Appl. Catal., B, 2010, 99, 353–363 CrossRef CAS.
- Z. Serinyel, C. Togbé, A. Zaras, G. Dayma and P. Dagaut, Proc. Combust. Inst., 2015, 35, 507–514 CrossRef CAS.
- H. Xiong, F. Shi and Y. Q. Deng, Chin. J. Catal., 2004, 25, 887–891 CAS.
- S. Petrović, L. Karanović, P. K. Stefanov, M. Zdujić and A. Terlecki-Baričević, Appl. Catal., B, 2005, 58, 133–141 CrossRef.
- S. Thaicharoensutcharittham, V. Meeyoo, B. Kitiyanan, P. Rangsunvigit and T. Rirksomboon, Catal. Commun., 2009, 10, 673–677 CrossRef CAS.
- P. Artizzu-Duart, Y. Brullé, F. Gaillard, E. Garbowski, N. Guilhaume and M. Primet, Catal. Today, 1999, 54, 181–190 CrossRef CAS.
Footnote |
| † Electronic supplementary information (ESI) available. See DOI: 10.1039/c7ra08494c |
| This journal is © The Royal Society of Chemistry 2017 |


