DOI:
10.1039/C7RA08731D
(Paper)
RSC Adv., 2017,
7, 48942-48951
Investigation on the interaction of antibacterial drug moxifloxacin hydrochloride with human serum albumin using multi-spectroscopic approaches, molecular docking and dynamical simulation
Received
7th August 2017
, Accepted 13th October 2017
First published on 17th October 2017
Abstract
The interaction between moxifloxacin hydrochloride (MOXH) and human serum albumin (HSA) was experimentally and simulatively investigated. Fluorescence quenching presented that MOXH bound to HSA via a static process, resulting in the formation of MOXH–HSA complex. This quenching mechanism was further verified by time-resolved fluorescence. Binding constants (Ka) of the complex were found to be 105 L mol−1 according to fluorescence data, and the calculated thermodynamic parameters indicated that hydrogen bonds and van der Waals force played key roles in the binding process. The UV-vis absorption, synchronous fluorescence, three-dimensional fluorescence, and circular dichroism spectra suggested that binding with MOXH induced the conformational changes on HSA; the hydrophobicity around tryptophan residues increased, the α-helix content increased, whereas the β-sheet and turn content of HSA decreased. Displacement experiments demonstrated that MOXH mainly bound to site I of HSA. Molecular docking results supported the active site and showed that the diazabicyclo of MOXH inserted into the hydrophobic pocket of HSA. Molecular dynamics simulation further ascertained that MOXH steadily bound to site I of HSA. In conclusion, hydrogen bonds and VDW force played major roles in stabilizing the MOXH–HSA complex, and hydrophobic force was also involved in the binding process.
1. Introduction
Moxifloxacin hydrochloride (MOXH) is a novel fourth-generation quinolone antimicrobial drug with fewer side effects and an extended half-life. Compared with older fluoroquinolones, MOXH has enhanced activity against Gram-positive and atypical bacteria, while retaining Gram-negative activity.1,2 Several studies have shown that MOXH can treat bacterial conjunctivitis and a wide variety of bacterial infections including pneumonia, sinusitis, and worsening of chronic bronchitis.1,3–5 Furthermore, it has been widely used in the treatment and prevention of veterinary diseases in animals intended for human consumption and commercially farmed fish.6
Studies on the interaction between drugs and biological macromolecules can provide a proper understanding of the absorption, transportation, distribution, metabolism, excretion properties and possible mechanism of drugs, thereby are beneficial to design, modify and screen drug molecules.7,8 Previously, the interactions of MOXH with biological macromolecules including calf thymus DNA2,9 and bovine hemoglobin3 have been investigated by fluorescence spectroscopy. These studies indicated that MOXH could bind to the two biological macromolecules through a static process and affect their structures via different combination types. Thus, the binding of MOXH to biological macromolecules may influence the function of macromolecules and the drug efficacy. However, to our knowledge, a comprehensive study on the interaction between MOXH and the major protein in the human blood circulation remains unclear. Among these proteins, human serum albumin (HSA) is the most abundant in blood plasma. HSA regulates the transportation of various drugs and helps maintain the osmotic pressure of blood.10,11 Drug–HSA interaction plays a significant role in understanding the pharmacokinetics and pharmacological effects of drugs.12,13 Hence, pharmacokinetic studies should be conducted in order to ascertain MOXH's presence in the blood plasma, especially with regards to its transportation and distribution properties in the circulatory system after oral administration.
In the present study, attempts were conducted to assess the binding process of MOXH with HSA by employing multi-spectroscopic techniques including fluorescence, time-resolved fluorescence, UV-vis absorption spectroscopy, and circular dichroism spectroscopy. The binding information such as quenching mechanism, binding parameters, acting forces, binding mode and conformational changes were discussed. Moreover, molecular docking and dynamics simulations were applied to evaluate the dynamics and stability of the MOXH–HSA complex, and to corroborate the results obtained from spectroscopy studies.
2. Experimental
2.1. Materials
MOXH (99% purity) was purchased from Yitai Technology Co. (Shanghai, China). Fatty-acid-free HSA (A1887-5G) was acquired from Sigma Aldrich (St. Louis, MO, USA). Phenylbutazone and ibuprofen were purchased from J&K Scientific Ltd. (Beijing, China). The stock solution of HSA was prepared at 2.0 × 10⁻⁵ mol L−1 in phosphate buffer solution (PBS, pH = 7.4). MOXH stock solution was prepared at a concentration of 2.0 × 10⁻⁴ mol L−1 with PBS. All solutions were diluted to the required volume with PBS prepared by triple-distilled water. All stock solutions were stored at 0–4 °C.
2.2. Fluorescence spectroscopy measurements
Fluorescence analysis was executed on a Cary Eclipse fluorescence spectrophotometer (Varian, CA, USA) equipped with 1.0 cm quartz cells. The HSA concentration was fixed at 2.0 × 10⁻⁶ mol L−1 while the MOXH concentrations varied from 0 to 7.0 × 10⁻⁶ mol L−1. Prior to fluorescence measurements, samples were thermally equilibrated at 298 K, 304 K, and 310 K for about 30 min. An excitation wavelength of 280 nm was employed, and the emission spectra were recorded from 290 nm to 450 nm. The widths of excitation and emission slits were set at 5 and 10 nm, respectively. To eliminate inner filter effect, fluorescence intensities were corrected based on the following formula:14,15| |
 | (1) |
where Fcorr and Fobs are the corrected and measured fluorescence intensities, respectively; Aex and Aem are the absorbance values at excitation and emission wavelengths, respectively.
Synchronous fluorescence spectra of HSA with various MOXH concentrations were recorded in the wavelength range of 200–400 nm at 298 K. The excitation and emission wavelength interval (Δλ) were set at 15 and 60 nm, respectively.
Three-dimensional (3D) fluorescence spectra of HSA (2.0 × 10⁻⁶ mol L−1) and the HSA–MOXH mixture solution (molar ratio, 1![[thin space (1/6-em)]](https://www.rsc.org/images/entities/char_2009.gif) :
:![[thin space (1/6-em)]](https://www.rsc.org/images/entities/char_2009.gif) 1) were obtained at the excitation wavelength range from 200 to 400 nm with 5 nm increments. The emission spectra were monitored between 200 and 500 nm.
1) were obtained at the excitation wavelength range from 200 to 400 nm with 5 nm increments. The emission spectra were monitored between 200 and 500 nm.
2.3. Time-resolved fluorescence spectra
Time-resolved fluorescence measurements were conducted by time-correlated single-photon counting technique with a Horiba Jobin Yvon FluoroLog-TCSPC spectrofluorometer (HORIBA, Les Ulis, France). The HSA concentration was 2.0 × 10⁻⁶ mol L−1, and the MOXH concentration varied from 0 to 5.0 × 10⁻⁶ mol L−1. Samples were recorded by fixing 280 nm as the excitation wavelength and 337 nm as the emission wavelength at room temperature.
2.4. UV-vis spectroscopy
Absorbance measurements were performed at 298 K using a TU-1901 spectrophotometer (Purkinje General, Beijing, China) from 200 nm to 500 nm. The absorption spectra were obtained at constant HSA concentration (2.0 × 10⁻⁶ mol L−1) and varying MOXH concentrations from 0 to 7.0 × 10⁻⁶ mol L−1.
2.5. Circular dichroism (CD) spectroscopy
CD spectra were collected on a fluorescence spectrometer (Hitachi-F7000, Tokyo, Japan) equipped with R3788 photomultiplier at 298 K. The measurements were performed by fixing the concentration of HSA constant (2.0 × 10⁻⁶ mol L−1), and varying the MOXH concentration from 0 to 5.0 × 10⁻⁶ mol L−1 ([MOXH]![[thin space (1/6-em)]](https://www.rsc.org/images/entities/char_2009.gif) :
:![[thin space (1/6-em)]](https://www.rsc.org/images/entities/char_2009.gif) [HSA] = 0
[HSA] = 0![[thin space (1/6-em)]](https://www.rsc.org/images/entities/char_2009.gif) :
:![[thin space (1/6-em)]](https://www.rsc.org/images/entities/char_2009.gif) 1, 1
1, 1![[thin space (1/6-em)]](https://www.rsc.org/images/entities/char_2009.gif) :
:![[thin space (1/6-em)]](https://www.rsc.org/images/entities/char_2009.gif) 1, and 2.5
1, and 2.5![[thin space (1/6-em)]](https://www.rsc.org/images/entities/char_2009.gif) :
:![[thin space (1/6-em)]](https://www.rsc.org/images/entities/char_2009.gif) 1). Each spectrum was obtained from 190 nm to 250 nm with 1 nm step size, 1 nm band width, and 0.5 s average time. An average of three scans was obtained for all spectra. The data were expressed as mean residue ellipticity (MRE; deg cm2 dmol−1) and were calculated using the following equation:
1). Each spectrum was obtained from 190 nm to 250 nm with 1 nm step size, 1 nm band width, and 0.5 s average time. An average of three scans was obtained for all spectra. The data were expressed as mean residue ellipticity (MRE; deg cm2 dmol−1) and were calculated using the following equation:| |
 | (2) |
where Cp is the molar concentration of the protein, n is the number of amino acid residues, and l is the path length.
2.6. Site marker displacement studies
Displacement experiments were conducted using the site markers, phenylbutazone and ibuprofen. The molar ratio of MOXH to HSA was maintained at 1![[thin space (1/6-em)]](https://www.rsc.org/images/entities/char_2009.gif) :
:![[thin space (1/6-em)]](https://www.rsc.org/images/entities/char_2009.gif) 1 ([HSA] = 2.0 × 10⁻⁶ mol L−1). The binary MOXH–HSA solutions were vortex-mixed and incubation for 30 min. Then, the phenylbutazone and ibuprofen solutions with varied concentrations were gradually added and incubated for another 30 min. Fluorescence spectra were recorded at 298 K under the same experimental conditions as previously described.
1 ([HSA] = 2.0 × 10⁻⁶ mol L−1). The binary MOXH–HSA solutions were vortex-mixed and incubation for 30 min. Then, the phenylbutazone and ibuprofen solutions with varied concentrations were gradually added and incubated for another 30 min. Fluorescence spectra were recorded at 298 K under the same experimental conditions as previously described.
2.7. Molecular docking
Binding mode of the ligand with HSA was examined by molecular docking using the FlexX program16 interfaced within LeadIT. The 3D structure of MOXH and HSA were downloaded from PubChem (PubChem CID: 152946) and RCSB protein data bank (PDB: 1H9Z), respectively. A global docking including all amino acid residues of HSA was performed. Correct tautomers and protonation states were assigned, and hydrogen atoms were added to the binding site residues using the receptor wizard. The FlexX hybrid algorithm (enthalpy and entropy driven ligand binding), as available in LeadIT,17 was used to place the “base fragment”. Other parameters were set at their default values.
2.8. Molecular dynamics (MD) simulations
MD simulations were conducted with YASARA v17.4.17,18 using the AMBER14 force field.19 Partial atomic charges of ligand were computed using the AM1-BCC model20 implemented in YASARA. MD simulations in explicit water were performed at a constant temperature (298.15 K) after initial energy minimization procedures. Periodic boundary conditions were applied to system, and counter ions were randomly added by replacing water molecules with Na or Cl to provide a charge-neutral system. Longrange Coulomb interactions were included using particle-mesh Ewald (PME) summation and a cut-off of 8.0 Å. Simulations were carried out in their entirety, employing a pre-defined macro (md run) within the YASARA package. Multiple time steps were used in the simulation: 1.25 fs for intramolecular and 2.5 fs for intermolecular forces, and data were collected every 100 ps. The two-dimensional maSp of interaction were calculated using LigPlot program.21
3. Results and discussion
3.1. Quenching mechanism
Fluorescence spectroscopy is widely used to study drug–protein interactions due to its exceptional sensitivity, selectivity, convenience, and abundance of theoretical foundation.22 The effect of MOXH on the fluorescence intensity of HSA at 298 K was displayed in Fig. 1(a). HSA generated an obvious fluorescence emission band at 337 nm, which was gradually quenched with increasing MOXH concentrations. In addition, MOXH alone did not emit fluorescence at the highest concentration. Therefore, such a decrease in intensity can be ascribed to the quenching of HSA by MOXH.
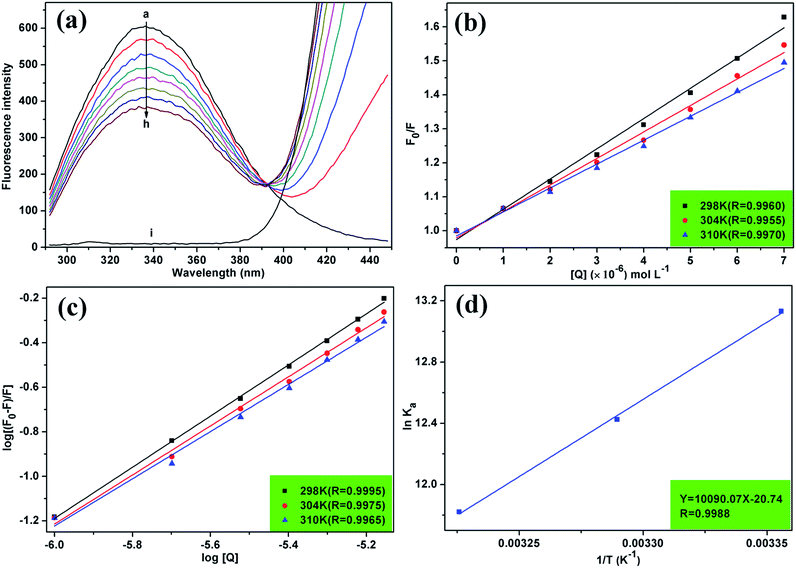 |
| | Fig. 1 (a) Fluorescence spectra of HSA (2.0 × 10⁻⁶ mol L−1) in the absence and presence of MOXH at 298 K. MOXH concentrations (a–h) were 0, 1.0, 2.0, 3.0, 4.0, 5.0, 6.0, and 7.0 × 10⁻⁶ mol L−1. Curve i shows the emission spectrum of MOXH alone (7.0 × 10⁻⁶ mol L−1). (b) Stern–Volmer plots for MOXH interacting with HSA at three different temperatures. (c) Plot of log[(F0 − F)/F] versus log[Q] for the MOXH–HSA system at three different temperatures. (d) van't Hoff plot of the MOXH–HSA system. | |
The quenching mechanism is frequently categorized into dynamic quenching, static quenching, or a combination of both two, which can be distinguished by their differential dependence on temperature.23 Given that dynamic quenching depends on diffusion and high temperatures to achieve larger diffusion coefficients, the quenching constant should increase with temperature risen. However, the effect is typically reversed in static quenching. That is, increased temperatures are likely to decrease the quenching constant because of the stability of ground state complexes were affected by temperature.24,25 To explore the quenching mechanism qualitatively, the fluorescence data at different temperatures were analyzed using the Stern–Volmer equation:26
| |
 | (3) |
where
F0 and
F are the fluorescence intensities in the absence and presence of a quencher, respectively;
KSV is the Stern–Volmer quenching constant and [
Q] is the quencher concentration. The
KSV can be determined using the linear regression of the plot of
F0/
F against [
Q], as shown in
Fig. 1(b). The calculated
KSV values at 298, 304, and 310 K are summarized in
Table 1. The
KSV values decreased with increasing temperature, which indicated that the quenching of HSA by MOXH was initiated by complex formation
via the static quenching process rather than dynamic collision.
27
Table 1 Stern–Volmer quenching constants, binding parameters, and thermodynamic parameters of MOXH–HSA system at different temperatures
| T (K) |
Stern–Volmer quenching constants |
Binding parameters |
Thermodynamic parameters |
| KSV × 104 (L mol−1) |
Ka × 105 (L mol−1) |
n |
ΔG (kJ mol−1) |
ΔH (kJ mol−1) |
ΔS (J mol−1 K−1) |
| 298 |
8.901 |
5.407 |
1.148 |
−32.34 |
−80.89 |
−172.97 |
| 304 |
7.794 |
2.489 |
1.101 |
−31.30 |
| 310 |
7.041 |
1.361 |
1.059 |
−30.60 |
To further substantiate the quenching mechanism, fluorescence lifetime measurements were performed. Fig. 2 depicts the fluorescence decay of HSA in the absence and presence of MOXH. Evidently, the fluorescence decay profiles almost remained unchanged after the addition of MOXH at three different concentrations. The corresponding data were analyzed using tail fitting method, and the goodness of fit was assessed by χ2 values. The average fluorescence lifetime (τ) was calculated based on the decay time and the relative amplitude (α) by using the following equation:
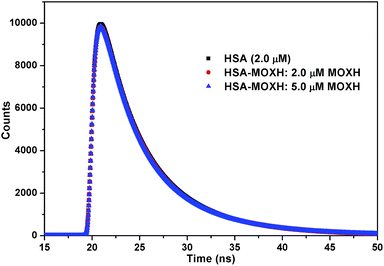 |
| | Fig. 2 Time-resolved fluorescence lifetime of HSA in the absence and presence of various concentrations of MOXH. | |
As presented in Table 2, the binding of MOXH did not cause an evident decrease in the τ values. In general, a decrease in the mean decay time of the entire excited-state population should be attributed to dynamic quenching; static quenching with the ground-state complex formed has almost no effect on the decay time of the uncomplexed fluorophores.28,29 Therefore, the static quenching mode between MOXH and HSA was further confirmed.
Table 2 Fluorescence decay fitting parameters for the MOXH–HSA system with different concentrations of MOXH
| Sample |
τ1 (ns) |
τ2 (ns) |
τ3 (ns) |
α1 |
α2 |
α3 |
τ (ns) |
χ2 |
| Free HSA (2.0 μM) |
3.211 |
0.584 |
6.918 |
0.344 |
0.041 |
0.615 |
5.383 |
1.132 |
| HSA–MOXH (+2.0 μM) |
3.152 |
0.500 |
6.877 |
0.339 |
0.039 |
0.622 |
5.366 |
1.032 |
| HSA–MOXH (+5.0 μM) |
3.095 |
0.438 |
6.839 |
0.338 |
0.038 |
0.624 |
5.330 |
1.110 |
3.2. Binding constants and the number of binding sites
For static quenching, the binding constant (Ka) and the number of binding sites (n) can be determined by plotting the double-logarithm regression curve of the fluorescence data with the modified Stern–Volmer equation:12| |
 | (5) |
Ka and n values were obtained from the intercept and slope of the curve of log[(F0 − F)/F] versus log[Q] [Fig. 1(c)], and were summarized in Table 1. All values of n were approximately equal to one, which indicated that a single high-affinity binding site existed in HSA. Moreover, MOXH exhibited a relatively strong affinity to HSA according to the Ka values (105 magnitude).
3.3. Thermodynamic parameters and the nature of the binding forces
Four non-covalent interaction forces, including hydrogen bond, van der Waals (VDW) force, hydrophobic force, and electrostatic interactions, promote small molecules binding to biological macromolecules.30 To characterize the binding force involved in MOXH–HSA, the thermodynamic parameters such as enthalpy change (ΔH), entropy change (ΔS), and Gibbs free energy change (ΔG), were calculated according to the van't Hoff equations:12,31| |
 | (6) |
where Ka is the binding constant at the corresponding temperature (T), and R is the gas constant. ΔH and ΔS values were obtained from the slope and intercept of the linear plot ln![[thin space (1/6-em)]](https://www.rsc.org/images/entities/char_2009.gif) Ka versus 1/T based on eqn (6) [Fig. 1(d)], and ΔG values were estimated from eqn (7) at corresponding temperatures (Table 1). The negative values for ΔG indicated that the binding of MOXH to HSA occurred spontaneously. The negative ΔH suggested that the binding reaction was an exothermic process, thereby providing a reasonable explanation for the decreasing Ka in Table 1. Besides, the negative values of ΔH and ΔS demonstrated that hydrogen bonds and VDW force were the main forces governing binding in the MOXH–HSA system, according to the theory of Ross and Subramanian.30
Ka versus 1/T based on eqn (6) [Fig. 1(d)], and ΔG values were estimated from eqn (7) at corresponding temperatures (Table 1). The negative values for ΔG indicated that the binding of MOXH to HSA occurred spontaneously. The negative ΔH suggested that the binding reaction was an exothermic process, thereby providing a reasonable explanation for the decreasing Ka in Table 1. Besides, the negative values of ΔH and ΔS demonstrated that hydrogen bonds and VDW force were the main forces governing binding in the MOXH–HSA system, according to the theory of Ross and Subramanian.30
3.4. Investigation on the conformational changes of HSA
3.4.1. UV-vis spectroscopy. UV-vis spectroscopy is a simple and intuitive approach to investigating the structural changes in protein–ligand interactions, similar to fluorescence spectra. The UV-vis spectra of HSA with various concentrations of MOXH were shown in Fig. 3(a). The absorption peak of HSA at about 280 nm increased with gradual addition of MOXH and a distinct red shift (from 279 nm to 287 nm) was observed. This phenomenon indicated that MOXH bound to HSA which caused conformational changes of HSA, and thus the hydrophobicity around the aromatic amino acid residues increased.32
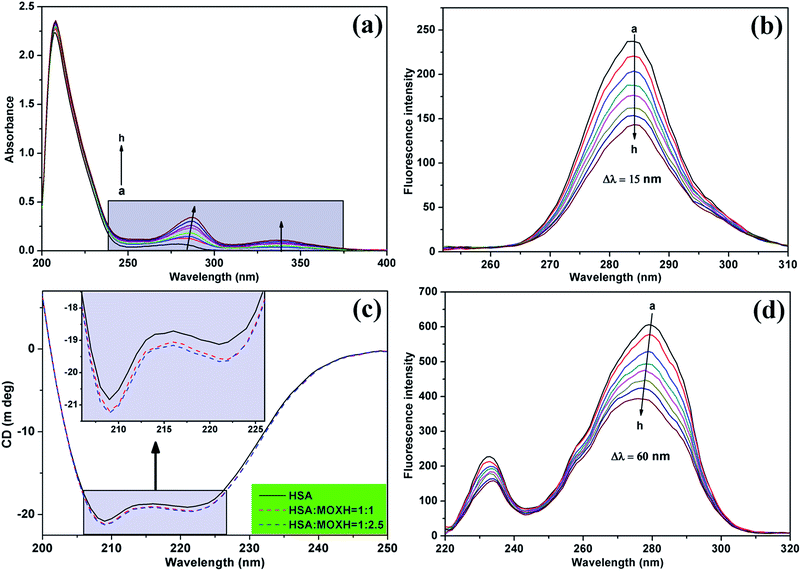 |
| | Fig. 3 (a) UV-vis absorption spectra of HSA (2.0 × 10⁶ mol L−1) with various concentrations of MOXH. Synchronous fluorescence spectra of HSA (2.0 × 10⁻⁶ mol L−1) in the presence of varying concentrations of MOXH for (b) Δλ = 15 nm and (d) Δλ = 60 nm. MOXH concentrations from “a” to “h” in figures (a), (b), and (d) were 0, 1.0, 2.0, 3.0, 4.0, 5.0, 6.0, and 7.0 × 10⁻⁶ mol L−1, respectively. (c) Circular dichroism spectra of HSA (2.0 × 10⁻⁶ mol L−1) in the absence and presence of MOXH. | |
3.4.2. Synchronous fluorescence spectroscopy. Synchronous fluorescence spectroscopy can provide information about the microenvironment of the chromophore molecules.33 When Δλ between excitation and emission wavelengths is stabilized at 15 and 60 nm, shifts in the maximum emission of the synchronous fluorescence reflect the changes in polarity around the tyrosine (Tyr) and tryptophan (Trp) residues of HSA, respectively.34 Fig. 3(b) and (d) exhibit the synchronous fluorescence spectra of MOXH–HSA system. The fluorescence intensity of HSA regularly decreased with addition of MOXH, which revealed the occurrence of fluorescence quenching during the binding process consistent with fluorescence data above. Furthermore, no shift occurred in the maximum emission wavelength at Δλ = 15 nm whereas a slight blue shift at Δλ = 60 nm was observed. This phenomenon indicated that the MOXH binding affected the conformation of HSA and lead to an increase in hydrophobicity around the Trp residues, which was in line with the UV-vis result.12,24 To further clarify the secondary structural changes in HSA by MOXH, 3D and CD spectra studies were conducted.
3.4.3. 3D fluorescence spectroscopy. 3D fluorescence spectroscopy is known to provide detailed information regarding to the conformation of protein.35 Fig. 4 displays the 3D fluorescence spectra of HSA with and without MOXH. The related spectra parameters are listed in Table 3. As shown in Fig. 4, peak a represents the Rayleigh scattering peak (λex = λem). Peak I exhibits the spectral behavior of Trp and Tyr residues, corresponding to the microenvironment polarity; peak II mainly reveals the polypeptide backbone structures of HSA.36 After the addition of MOXH, the fluorescence intensity of both peaks I and II showed an evident decrease. Furthermore, blue shift was observed both in peak I (4 nm) and peak II (7 nm). These findings indicated that binding with MOXH changed the conformation of HSA, and led to an decrease in polarity surrounding the Trp and Tyr residues.
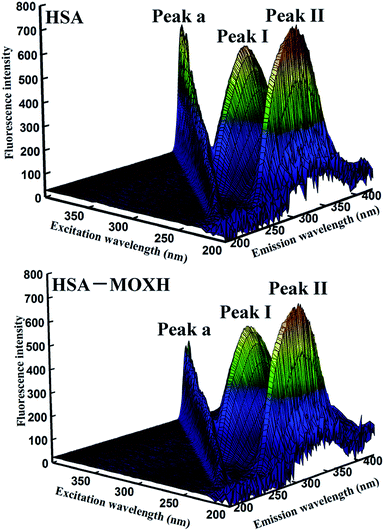 |
| | Fig. 4 3D fluorescence spectral of HSA (2.0 × 10⁻⁶ mol L−1) in the absence and presence of MOXH (2.0 × 10⁻⁶ mol L−1) at 298 K. | |
Table 3 3D fluorescence spectral parameters of HSA in the absence and presence of MOXH at 298 K
| System |
Peak no. |
Peak position [λex/λem (nm/nm)] |
Intensity |
| HSA |
A |
280/280 → 350/350 |
261.96 → 449.80 |
| I |
280/338 |
619.47 |
| II |
225/336 |
742.33 |
| MOXH–HSA |
A |
280/280 → 350/350 |
119.95 → 231.84 |
| I |
280/334 |
569.71 |
| II |
225/329 |
688.31 |
3.4.4. CD spectroscopy. CD spectroscopy is a reliable and sophisticated method to analyze the secondary structure change of protein after ligand binding.37 The CD spectra of HSA in the absence and presence of MOXH exhibited two negative bands at 208 nm and 222 nm as shown in Fig. 3(c), which indicates the dominance of the typical α-helix structure.24 The data were further analyzed by the algorithm SELCON3,38 and the fractions of α-helix, β-sheet, turn, and unordered coil were listed in Table 4. The free HSA comprised 46.3% α-helix, 14.0% β-sheet, 16.9% turn, and 25.4% unordered coil. After addition of MOXH, the α-helix content increased whereas the β-sheet and turn content decreased. When the molar ratio of MOXH to HSA reached 2.5![[thin space (1/6-em)]](https://www.rsc.org/images/entities/char_2009.gif) :
:![[thin space (1/6-em)]](https://www.rsc.org/images/entities/char_2009.gif) 1, the α-helix, β-sheet and turn were changed to 55.1%, 7.8%, 15.6%, respectively. Thus, the interaction of MOXH and HSA altered the secondary structure of HSA. And the original bonding of HSA, which is necessary to form secondary and tertiary protein structures, was affected when MOXH inserted into HSA.
1, the α-helix, β-sheet and turn were changed to 55.1%, 7.8%, 15.6%, respectively. Thus, the interaction of MOXH and HSA altered the secondary structure of HSA. And the original bonding of HSA, which is necessary to form secondary and tertiary protein structures, was affected when MOXH inserted into HSA.
Table 4 Secondary structure composition of HSA in the presence of MOXH with different concentrations
| System |
α-helix (%) |
β-sheet (%) |
Turn (%) |
Unordered (%) |
| Free HSA |
46.3 |
14.0 |
16.9 |
25.4 |
HSA![[thin space (1/6-em)]](https://www.rsc.org/images/entities/char_2009.gif) : :![[thin space (1/6-em)]](https://www.rsc.org/images/entities/char_2009.gif) MOXH = 1 MOXH = 1![[thin space (1/6-em)]](https://www.rsc.org/images/entities/char_2009.gif) : :![[thin space (1/6-em)]](https://www.rsc.org/images/entities/char_2009.gif) 1 1 |
53.5 |
8.2 |
15.6 |
25.4 |
HSA![[thin space (1/6-em)]](https://www.rsc.org/images/entities/char_2009.gif) : :![[thin space (1/6-em)]](https://www.rsc.org/images/entities/char_2009.gif) MOXH = 1 MOXH = 1![[thin space (1/6-em)]](https://www.rsc.org/images/entities/char_2009.gif) : :![[thin space (1/6-em)]](https://www.rsc.org/images/entities/char_2009.gif) 2.5 2.5 |
55.1 |
7.8 |
15.6 |
25.2 |
3.5. Site marker displacement studies
HSA is a globular protein that contains three homologous helical domains (I, II, and III), and each domain can be divided into two subdomains (A and B).39 Crystal structure analysis indicated that there are two major and structurally selective binding sites called Sudlow site I and Sudlow site II in HSA, which are located in subdomains IIA and IIIA, respectively.40
To investigate the possible binding sites of MOXH, site marker displacement studies were conducted using phenylbutazone and ibuprofen as sites I and II probes, respectively.41 The percentage of displacement (I) by a site marker can be calculated as follows:15
| |
 | (8) |
where
F2 and
F1 are the fluorescence intensities of MOXH–HSA in the presence and absence of site markers, respectively. The plot of
I values against the molar ratio of probe to HSA is shown in
Fig. 5. The fluorescence intensity decreased remarkably with increasing phenylbutazone concentration, whereas a negligible effect was observed with ibuprofen addition. These results suggested that MOXH and phenylbutazone shared the same binding site thereby phenylbutazone competed with MOXH. Thus, MOXH was mainly bound to site I in subdomain IIA of HSA.
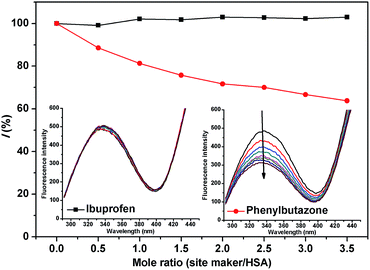 |
| | Fig. 5 Effect of site markers on the fluorescence of MOXH–HSA. Both HSA and MOXH concentrations were 2.0 × 10⁻⁶ mol L−1, site markers concentrations varied from 0 to 7 × 10⁻⁶ mol L−1. | |
3.6. Molecular docking studies
Molecular docking studies provide some insights into the interaction between small molecule and biomacromolecule. In the present study, molecular docking was performed to further identify the exact binding site of MOXH on HSA and promote visual understanding of the binding site. As shown in Fig. 6(a), the first thirty binding conformations of MOXH obtained according to scores clustered in site I of HSA, which indicated that MOXH preferentially bound to HSA in site I. The lowest energy conformation was chosen to analyze the binding details [Fig. 6(b)]. The diazabicyclo in MOXH molecule inserted into the hydrophobic cavity of HSA in subdomain IIA. Residues Gln 196, Arg 257, His 288, Ala 291, and Glu 292 were involved in the hydrophobic interaction with MOXH [Fig. 9(a)] (left). Furthermore, the Glu 153, Arg 218, and Arg 222 residues formed four hydrogen bonds with MOXH. The carboxyl of Glu 153 connected to the NH2 group of MOXH though a hydrogen bond with a length of 2.52 Å. The NH2 and NH groups of the Arg 218 side chain built two hydrogen bonds with carboxyl of MOXH, at distances of 2.91 Å and 2.89 Å, respectively. The NH2 group of the Arg 222 side chain formed a hydrogen bond with the carboxyl of MOXH (3.08 Å). These results indicated that the hydrophobic force and hydrogen bonds played key roles in stabilizing the MOXH–HSA complex.
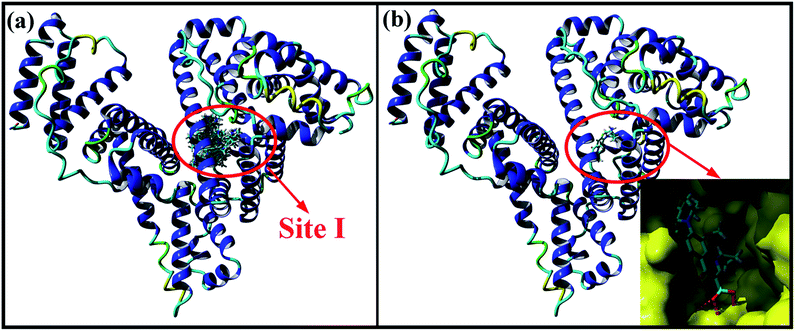 |
| | Fig. 6 (a) Cluster analysis for the first thirty conformations of MOXH binding to HSA. (b) The lowest energy conformation of the MOXH–HSA complex and the partial enlarged drawing of HSA site I in surface form. | |
3.7. MD simulations
MD simulations were conducted to check out the stability of the HSA and MOXH–HSA complex systems. The structure stability of free HSA and MOXH–HSA were evaluated based on their root mean square deviation (RMSD) values. As shown in Fig. 7, the RMSD values of both systems were plotted and calculated against the simulation time scale of 0–60 ns. Results indicated that both systems reached equilibration and oscillated at around a value of 40 ns. In addition, the MOXH remained in site I of HSA after 60 ns, and both MOXH and HSA showed evident conformational changes (Fig. 8). Therefore, it is ascertained that MOXH can steadily bind to the site I of HSA. The MOXH–HSA complex was stabilized after 40 ns due to conformational rearrangement. Further analysis revealed that two more hydrogen bonds formed after the conformational optimization of MD [Fig. 9(a)] (right). The enlarged three-dimensional maps of hydrogen bond interactions are shown in [Fig. 9(b)]. The length and position of the hydrogen bonds also changed to some extent. The NH2 group of MOXH formed two hydrogen bonds with the oxygen atoms of Glu 153 (2.89 Å) and Ser 192 (2.80 Å), respectively. The NH2 and NH groups of Arg 218 built two hydrogen bonds with the carbonyl oxygen (3.14 Å) and two hydrogen bonds with the carboxyl oxygen (2.91 Å) of MOXH, respectively. Two NH2 groups of Arg 222 were connected to the carboxyl oxygen atoms of MOXH through two hydrogen bonds with a distance of 2.93 Å and 2.86 Å, respectively. More residues including Tyr 150, Gln 196, Lys 199, Phe 211, Trp 214, Arg 257, His 242, and Ala 291 were involved in the hydrophobic interaction with MOXH. In addition, the VDW force (2.3 × 10⁵ kJ mol−1) was also involved in the MOXH–HSA binding. In conclusion, hydrogen bonds and VDW force played major roles in stabilizing the MOXH–HSA complex, and hydrophobic force was also involved in the binding process.
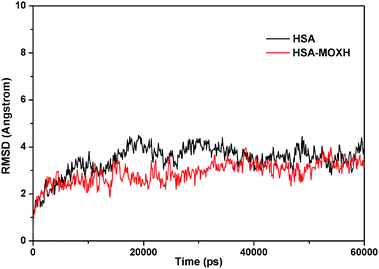 |
| | Fig. 7 RMSDs of the MD simulations for the free HSA and MOXH–HSA complex systems. | |
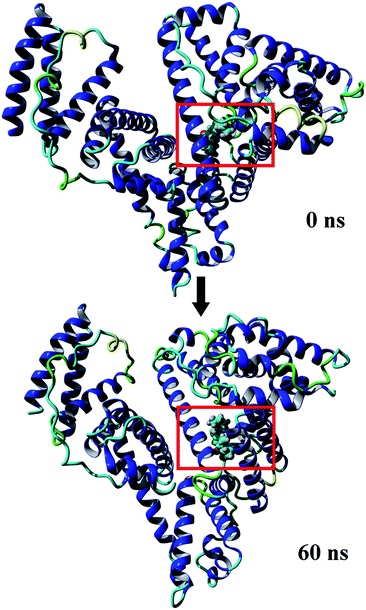 |
| | Fig. 8 Comparison between initial conformation of the MOXH–HSA complex and conformation of the complex at 60 ns. | |
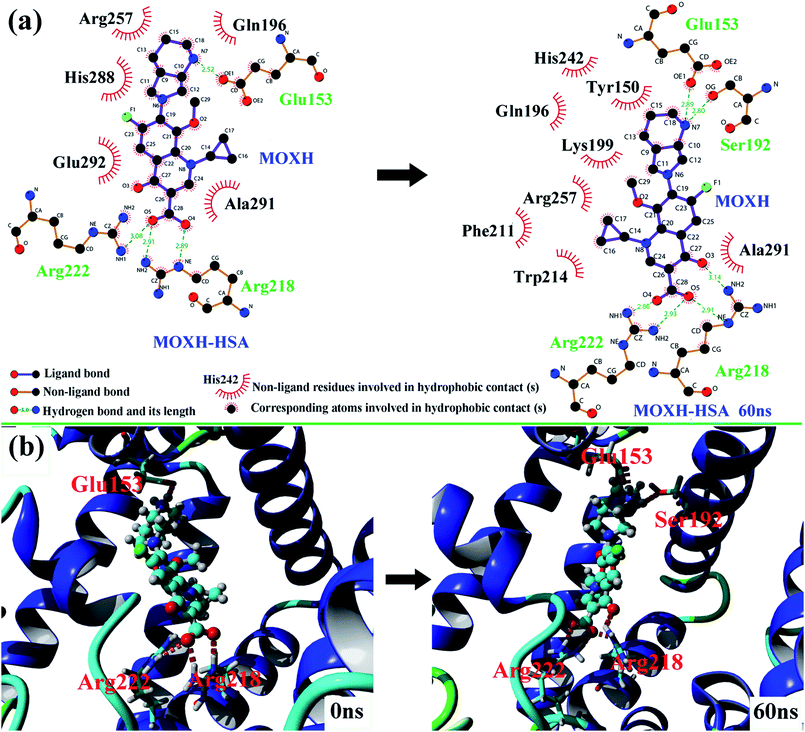 |
| | Fig. 9 (a) The two-dimensional maps of interactions before and after MD simulations of 60 ns were calculated using LigPlot. (b) Comparison of the hydrogen bonds between MOXH and residues before and after MD simulations of 60 ns. | |
4. Conclusions
Multi-spectroscopic methods and computational simulations were applied to explore the binding characteristics, interaction mode, and conformational changes of MOXH with HSA. The fluorescence spectroscopy demonstrated that MOXH interacted with HSA through the complex formation via static mechanism, which was proved by time-resolved fluorescence. According to fluorescence data, binding of MOXH to HSA was relatively strong with binding constants (Ka) of 105 L mol−1. The calculated thermodynamic parameters indicated that hydrogen bonds and van der Waals force were the major elements to drive the MOXH–HSA binding. The UV-vis spectra, synchronous fluorescence, and 3D fluorescence results suggested that binding with MOXH changed the conformation of HSA, and increased the hydrophobicity around the Trp residues. The secondary structure of HSA was affected by the MOXH–HSA binding; an increase in α-helix content whereas a decrease in β-sheet and turn content of HSA were induced in binding process, considering the CD data. Site marker displacement experiments revealed that MOXH mainly bound to site I in subdomain IIA of HSA. The molecular docking results suggested the site I binding mode, which coincides well with the experimental results. Molecular dynamics simulations further corroborated the reliability of the docking results, and provided a more reasonable conformation of the MOXH–HSA complex. Six hydrogen bonds formed between MOXH and residues (Glu 153, Ser 192, Arg 218, and Arg 222) of HSA, together with the VDW force and hydrophobic force, played major roles in stabilizing the MOXH–HSA complex. All these results indicated that MOXH could steadily bind to site I of HSA. This study might contribute to a better understanding of binding mechanism of MOXH with HSA, and help to comprehend the dynamic equilibrium process of drug–protein interaction.
Conflicts of interest
There are no conflicts to declare.
Acknowledgements
This work was supported by the Large-scale Science Instrument Shareable Platform Construction of Sichuan Province (Grant No. 2015JCPT0005-15010102) and the Large-scientific Instruments Sharing Platform Ability Construction of Sichuan Province (Grant No. 2016KJTS0037).
References
- C. M. Culley, M. K. Lacy, N. Klutman and B. Edwards, Am. J. Health-Syst. Pharm., 2001, 58, 379–388 CAS.
- Y. K. Lv, P. Li, M. L. Jiao, B. S. Liu and C. Yang, Turk. J. Chem., 2014, 38, 202–209 CrossRef CAS.
- B. S. Liu, C. Yang, X. N. Yan, J. Wang, J. S. Zhang and Y. K. Lü, Spectrosc. Lett., 2012, 45, 175–183 CrossRef CAS.
- M. Miravitlles and A. Anzueto, Expert Opin. Pharmacother., 2008, 9, 1755–1772 CrossRef CAS PubMed.
- Y. Chu, J. Qu, L. Y. Qu, Y. F. Luo and M. Y. Jiang, Drug Res., 2015, 65, 650–657 CrossRef CAS PubMed.
- A. Navalon, R. Blanc, L. Reyes, N. Navas and J. L. Vilchez, Anal. Chim. Acta, 2002, 454, 83–91 CrossRef CAS.
- B. T. Yin, C. Y. Yan, X. M. Peng, S. L. Zhang, S. Rasheed, R. X. Geng and C. H. Zhou, Eur. J. Med. Chem., 2014, 71, 148–159 CrossRef CAS PubMed.
- D. Wu, Y. Zhai, J. Yan, K. Xu, Q. Wang, Y. Li and H. Li, RSC Adv., 2015, 5, 11036–11042 RSC.
- A. E. Radi, T. Wahdan, Z. Anwar and H. Mostafa, Electroanalysis, 2010, 22, 2665–2671 CrossRef CAS.
- M. Rezaei-Tavirani, S. H. Moghaddamnia, B. Ranjbar, M. Amani and S. A. Marashi, BMB Rep., 2006, 39, 530–536 CrossRef CAS.
- P. Lee and X. Wu, Curr. Pharm. Des., 2015, 21, 1862–1865 CrossRef CAS PubMed.
- Z. Sun, H. Xu, Y. Cao, F. Wang and W. Mi, J. Mol. Liq., 2016, 219, 405–410 CrossRef CAS.
- A. Safarnejad, M. Shaghaghi, G. Dehghan and S. Soltani, J. Lumin., 2016, 176, 149–158 CrossRef CAS.
- S. Li, J. He, Y. Huang, Q. Wang, H. Yang, K. Xu and H. Li, RSC Adv., 2016, 6, 85811–85819 RSC.
- B. Tang, Y. Huang, X. Ma, X. Liao, Q. Wang, X. Xiong and H. Li, Food Chem., 2016, 212, 434–442 CrossRef CAS PubMed.
- M. Rarey, B. Kramer, T. Lengauer and G. Klebe, J. Mol. Biol., 1996, 261, 470–489 CrossRef CAS PubMed.
- M. Rarey, S. Wefing and T. Lengauer, J. Comput.-Aided Mol. Des., 1996, 10, 41–54 CrossRef CAS PubMed.
- E. Krieger, T. Darden, S. B. Nabuurs, A. Finkelstein and G. Vriend, Proteins, 2004, 57, 678–683 CrossRef CAS PubMed.
- Y. Duan, C. Wu, S. Chowdhury, M. C. Lee, G. Xiong, W. Zhang, R. Yang, P. Clieplak, R. Luo, T. Lee, J. Caldwell, J. Wang and P. Kollman, J. Comput. Chem., 2003, 24, 1999–2012 CrossRef CAS PubMed.
- A. Jakalian, D. B. Jack and C. I. Bayly, J. Comput. Chem., 2002, 23, 1623–1641 CrossRef CAS PubMed.
- A. C. Wallace, R. A. Laskowski and J. M. Thomton, Protein Eng., 1995, 8, 127–134 CrossRef CAS PubMed.
- J. He, D. Wu, Y. Zhai, Q. Wang, X. Ma, H. Yang and H. Li, J. Mol. Liq., 2016, 219, 547–553 CrossRef CAS.
- X. Li, D. Chen, G. Wang and Y. Lu, Eur. J. Med. Chem., 2013, 70, 22–36 CrossRef CAS PubMed.
- X. Li and S. Wang, New J. Chem., 2015, 39, 386–395 RSC.
- B. K. Bozoğlan, S. Tunç and O. Duman, J. Lumin., 2014, 155, 198–204 CrossRef.
- J. Chamani, H. Vahedian-Movahed and M. R. Saberi, J. Pharm. Biomed. Anal., 2011, 55, 114–124 CrossRef CAS PubMed.
- M. R. Ajmal, N. Zaidi, P. Alam, S. Nusrat, M. K. Siddiqi, G. Badr, H. M. Mahmoud and R. H. Khan, J. Biomol. Struct. Dyn., 2017, 35, 46–57 CAS.
- P. Mandal, M. Bardhan and T. Ganguly, J. Photochem. Photobiol., B, 2010, 99, 78–86 CrossRef CAS PubMed.
- G. Paramaguru, A. Kathiravan, S. Selvaraj, P. Venuvanalingam and R. Renganathan, J. Hazard. Mater., 2010, 175, 985–991 CrossRef CAS PubMed.
- P. D. Ross and S. Subramanian, Biochemistry, 1981, 20, 3096–3102 CrossRef CAS PubMed.
- C. Challier, P. Beassoni, C. Boetsch, N. A. Garcia, M. A. Biasutti and S. Criado, J. Photochem. Photobiol., B, 2015, 142, 20–28 CrossRef CAS PubMed.
- L. Tang, H. Zuo and L. Shu, J. Lumin., 2014, 153, 54–63 CrossRef CAS.
- Y. J. Hu, Y. Liu, Z. B. Pi and S. S. Qu, Bioorg. Med. Chem., 2005, 13, 6609–6614 CrossRef CAS PubMed.
- H. Tanzadehpanah, A. Asoodeh, H. Mahaki, Z. Mostajabodave, J. Chamani, Z. Mojallal-Tabatabaei, S. Emtenani and M. R. Moradi, Process Biochem., 2016, 51, 2067–2075 CrossRef CAS.
- B. Tu, Z. F. Chen, Z. J. Liu, R. R. Li, Y. Ouyang and Y. J. Hu, RSC Adv., 2015, 5, 73290–73300 RSC.
- Z. Chen, H. Xu, Y. Zhu, J. Liu, K. Wang, P. Wang, S. Shang, X. Yi, Z. Wang, W. Shao and S. Zhang, RSC Adv., 2014, 4, 25410–25419 RSC.
- P. Alam, S. K. Chaturvedi, T. Anwar, M. K. Siddiqi, M. R. Ajmal, G. Badr, M. H. Mahmoud and R. Hasan Khan, J. Lumin., 2015, 164, 123–130 CrossRef CAS.
- N. Sreerama and R. W. Woody, Anal. Biochem., 2000, 287, 252–260 CrossRef CAS PubMed.
- B. Ekman, T. Sjödin and I. Sjöholm, Mol. Pharmacol., 1979, 16, 767–777 Search PubMed.
- A. Divsalar and S. Khodabakhshian, J. Mol. Liq., 2015, 206, 82–88 CrossRef CAS.
- H. Chen, H. Rao, P. He, Y. Qiao, F. Wang, H. Liu, M. Cai and J. Yao, Environ. Sci. Pollut. Res., 2014, 21, 11340–11348 CrossRef CAS PubMed.
|
| This journal is © The Royal Society of Chemistry 2017 |
Click here to see how this site uses Cookies. View our privacy policy here.  Open Access Article
 *
*

![[thin space (1/6-em)]](https://www.rsc.org/images/entities/char_2009.gif) :
:![[thin space (1/6-em)]](https://www.rsc.org/images/entities/char_2009.gif) 1) were obtained at the excitation wavelength range from 200 to 400 nm with 5 nm increments. The emission spectra were monitored between 200 and 500 nm.
1) were obtained at the excitation wavelength range from 200 to 400 nm with 5 nm increments. The emission spectra were monitored between 200 and 500 nm.![[thin space (1/6-em)]](https://www.rsc.org/images/entities/char_2009.gif) :
:![[thin space (1/6-em)]](https://www.rsc.org/images/entities/char_2009.gif) [HSA] = 0
[HSA] = 0![[thin space (1/6-em)]](https://www.rsc.org/images/entities/char_2009.gif) :
:![[thin space (1/6-em)]](https://www.rsc.org/images/entities/char_2009.gif) 1, 1
1, 1![[thin space (1/6-em)]](https://www.rsc.org/images/entities/char_2009.gif) :
:![[thin space (1/6-em)]](https://www.rsc.org/images/entities/char_2009.gif) 1, and 2.5
1, and 2.5![[thin space (1/6-em)]](https://www.rsc.org/images/entities/char_2009.gif) :
:![[thin space (1/6-em)]](https://www.rsc.org/images/entities/char_2009.gif) 1). Each spectrum was obtained from 190 nm to 250 nm with 1 nm step size, 1 nm band width, and 0.5 s average time. An average of three scans was obtained for all spectra. The data were expressed as mean residue ellipticity (MRE; deg cm2 dmol−1) and were calculated using the following equation:
1). Each spectrum was obtained from 190 nm to 250 nm with 1 nm step size, 1 nm band width, and 0.5 s average time. An average of three scans was obtained for all spectra. The data were expressed as mean residue ellipticity (MRE; deg cm2 dmol−1) and were calculated using the following equation:
![[thin space (1/6-em)]](https://www.rsc.org/images/entities/char_2009.gif) :
:![[thin space (1/6-em)]](https://www.rsc.org/images/entities/char_2009.gif) 1 ([HSA] = 2.0 × 10⁻⁶ mol L−1). The binary MOXH–HSA solutions were vortex-mixed and incubation for 30 min. Then, the phenylbutazone and ibuprofen solutions with varied concentrations were gradually added and incubated for another 30 min. Fluorescence spectra were recorded at 298 K under the same experimental conditions as previously described.
1 ([HSA] = 2.0 × 10⁻⁶ mol L−1). The binary MOXH–HSA solutions were vortex-mixed and incubation for 30 min. Then, the phenylbutazone and ibuprofen solutions with varied concentrations were gradually added and incubated for another 30 min. Fluorescence spectra were recorded at 298 K under the same experimental conditions as previously described.


![[thin space (1/6-em)]](https://www.rsc.org/images/entities/char_2009.gif) Ka versus 1/T based on eqn (6) [Fig. 1(d)], and ΔG values were estimated from eqn (7) at corresponding temperatures (Table 1). The negative values for ΔG indicated that the binding of MOXH to HSA occurred spontaneously. The negative ΔH suggested that the binding reaction was an exothermic process, thereby providing a reasonable explanation for the decreasing Ka in Table 1. Besides, the negative values of ΔH and ΔS demonstrated that hydrogen bonds and VDW force were the main forces governing binding in the MOXH–HSA system, according to the theory of Ross and Subramanian.30
Ka versus 1/T based on eqn (6) [Fig. 1(d)], and ΔG values were estimated from eqn (7) at corresponding temperatures (Table 1). The negative values for ΔG indicated that the binding of MOXH to HSA occurred spontaneously. The negative ΔH suggested that the binding reaction was an exothermic process, thereby providing a reasonable explanation for the decreasing Ka in Table 1. Besides, the negative values of ΔH and ΔS demonstrated that hydrogen bonds and VDW force were the main forces governing binding in the MOXH–HSA system, according to the theory of Ross and Subramanian.30

![[thin space (1/6-em)]](https://www.rsc.org/images/entities/char_2009.gif) :
:![[thin space (1/6-em)]](https://www.rsc.org/images/entities/char_2009.gif) 1, the α-helix, β-sheet and turn were changed to 55.1%, 7.8%, 15.6%, respectively. Thus, the interaction of MOXH and HSA altered the secondary structure of HSA. And the original bonding of HSA, which is necessary to form secondary and tertiary protein structures, was affected when MOXH inserted into HSA.
1, the α-helix, β-sheet and turn were changed to 55.1%, 7.8%, 15.6%, respectively. Thus, the interaction of MOXH and HSA altered the secondary structure of HSA. And the original bonding of HSA, which is necessary to form secondary and tertiary protein structures, was affected when MOXH inserted into HSA.
![[thin space (1/6-em)]](https://www.rsc.org/images/entities/char_2009.gif) :
:![[thin space (1/6-em)]](https://www.rsc.org/images/entities/char_2009.gif) MOXH = 1
MOXH = 1![[thin space (1/6-em)]](https://www.rsc.org/images/entities/char_2009.gif) :
:![[thin space (1/6-em)]](https://www.rsc.org/images/entities/char_2009.gif) 1
1![[thin space (1/6-em)]](https://www.rsc.org/images/entities/char_2009.gif) :
:![[thin space (1/6-em)]](https://www.rsc.org/images/entities/char_2009.gif) MOXH = 1
MOXH = 1![[thin space (1/6-em)]](https://www.rsc.org/images/entities/char_2009.gif) :
:![[thin space (1/6-em)]](https://www.rsc.org/images/entities/char_2009.gif) 2.5
2.5


