 Open Access Article
Creative Commons Attribution 3.0 Unported Licence
Folate chitosan conjugated doxorubicin and pyropheophorbide acid nanoparticles (FCDP–NPs) for enhance photodynamic therapy
Wenting Lia,
Guanghui Tanb,
Hongyue Zhanga,
Zhiqiang Wang*a and
Yingxue Jin *a
*a
aKey Laboratory of Photochemistry Biomaterials and Energy Storage Materials of Heilongjiang Province, College of Chemistry & Chemical Engineering, Harbin Normal University, Harbin, 150025, China. E-mail: jyxprof@163.com; wzq70402@163.com; Tel: +86-451-88060569
bKey Laboratory of Molecular Cytogenetics and Genetic Breeding of Heilongjiang Province, Harbin, 150025, China
First published on 15th September 2017
Abstract
We prepared new folate chitosan conjugated doxorubicin (DOX) and pyropheophorbide acid (PPa) nanoparticles (FCDP–NPs) using an ionic gelation method with tripolyphosphate (TPP) to enhance photodynamic therapy activity, based on the considerations of the long absorption wavelength (683 nm) of pyropheophorbide acid (PPa) in water and the excellent chemotherapeutic characteristics of doxorubicin (DOX) in cancer therapy. The obtained FCDP–NPs demonstrated a typical spherosome structure, a strong near infrared (NIR) absorption (705 nm) and significantly improved stability and dispersity in PBS (pH = 5, 7, 9); as well as a high singlet oxygen quantum yield (ΦΔ = 64%) compared to free PPa (ΦΔ = 59.1%). In addition, the in vitro cell experiments suggested that FCDP–NPs could be uptaken by HepG2 cells quickly and were mainly located in the cell nucleus. FCDP–NPs showed improved PDT efficiency over pure PPa and DOX at the same concentration after irradiation. Specifically, FCDP–NPs could lead to a 92% inhibition rate on HepG2 cells at 40 μg mL−1 (equal to 6 μg mL−1 DOX). However, the pure DOX showed little cytotoxicity at 6 μg mL−1, which suggests that a small amount of DOX could effectively enhance the PDT activities of PPa and lead to little “dark” cytotoxicity. Moreover, cell morphological changes after PDT treatment further indicated that FCDP–NPs could induce damage and apoptotic cell death efficiently. Finally, the photochemical mechanism of FCDP–NPs during PDT process was investigated by using specific quenching agents sodium azide (SA, a single oxygen quencher) and D-mannitol (DM, a hydroxyl radicals quencher), respectively. The results suggested that Type I and Type II photodynamic reactions can occur simultaneously, yet Type I reaction (the generation of hydroxyl radicals) might play a more important role. All these studies indicated that the FCDP–NPs could be potential nanoparticles in photodynamic cancer treatment.
1. Introduction
Photodynamic therapy (PDT) has been a potential therapeutic method for the treatment of various cancers with significant efficacy.1–3 Traditional methods such as chemotherapy, radiotherapy and surgery have limitations in clinical treatment. Take the case of chemotherapy, it can successfully kill the cancer cells, yet it can produce systemic toxicity and resistance, severely affecting the physical and mental health of the patients.4,5 Owing to the low side effects, special selectivity and being minimally invasive, PDT overcomes the limitations of traditional treatments. PDT relies on selective accumulation of a photosensitizing agent (photosensitizer) in tumor and subsequent photodynamic effect induced by activation of the photosensitizer by visible light.6,7 Photosensitizers can be excited from its ground state to a triplet excited state by a momentary excited singlet state. The formed triplet states either undergo electron or hydrogen atom transfer reactions with a substrate to produce free radicals such as hydroxyl radical, or transfer its energy directly to oxygen to form excited state singlet oxygen.8–10 These reaction oxygen species (ROS) have a very strong activity to cause destruction through direct cellular damage and activation of an immune response against cancer cells.11 Besides, the photosensitizers can quickly enrichment in the tumour cells, thus PDT can reach a good curative effect on cancer therapy. Therefore, many PSs have been developed for PDT, such as Photofrin, hemoporfin, Chlorin e6 (Ce6).12,13 Nevertheless, some of the disadvantages of the photosensitizers (PSs) are not neglected. Most of the photosensitizers possess porphyrin or porphine structures, which have larger hydrophobic groups, and the solubility in water is not ideal.14 The larger aromatic conjugate system leads to the molecular accumulation and reduces the yield of reactive oxygen. Moreover, some PSs take longer time to metabolize in the tumour site with the blood circulation; therefore the patients should stay in dark for a long period of time. So PDT needs to be studied deeply to overcome the limitation in clinic therapy.Generally, appropriate drug carrier with good biocompatibility and target ability could reduce or overcome the disadvantages of chemotherapy drugs and photosensitizers.15 Such carrier systems could not only control the rate of drug administration that prolongs the duration of the therapeutic effect but also deliver the drug to specific site.16–18 Chitosan is a non-toxic biodegradable polycationic polymer with low immunogenicity.19 Hydrophilic chitosan nanoparticles have shown favourable biocompatibility characteristics and could improve membrane permeability both in vitro and in vivo, and could be degraded by lysozyme in serum.20 Although chitosan nanoparticles are good substrate in drug delivery system, but most of the nanoparticles are ingested by mononuclear phagocytic systems (MPS), it has good effect on the treatment of MPS related diseases, yet it does little for other diseases.21 Folic acid (FA) is a kind of vitamin and is appealing as a ligand for targeting cell membrane, allowing nanoparticle endocytosis via the folate receptor (FR).22,23 Folate receptor (FR) is a single-chain glycoprotein with high specific affinity for folic acid and methotrexate, and is largely shielded from the immune system in normal tissue but highly expressed on a variety of malignant tumour tissues.24–26 More importantly, the high affinity of folic acid to its receptor and the small size allows its use for specific cell targeting. Moreover, the ability of FA to bind its receptor to allow endocytosis is not altered by covalent conjugation of small molecules. Therefore, many researchers have used FA as a ligand with liposome and other polymers for target therapy in many fields.27,28 Doxorubicin and its bioactive derivatives are among the most widely used anticancer drugs in chemotherapy treatment. For example, doxorubicin (DOX) used as a prodrug to formulated nanoparticles for NIR-triggered high-efficient photodynamic and chemocascade therapy.29,30
Considering the advantages of FA, CS and DOX mentioned above, in this paper, we designed and prepared folate chitosan conjugated doxorubicin and pyropheophorbide acid nanoparticles (FCDP–NPs) to enhance photodynamic therapy of PPa, which is the second generation photosensitizer with large molar extinction coefficient to transfer the energy for sufficient ROS generation, and a larger absorption wavelength (683 nm, located in therapeutic window) ensuring the deep penetration of light into tissues, being suitable for the photodynamic therapy. In our strategy, we used folic acid as a specific substance for tumor target, chitosan as the matrix of nanoparticles, PPa as a photosensitizer and DOX as a chemotherapy drug to improve the PDT activities. Firstly, folate chitosan was synthesized by dehydration condensation reaction with the use of dicyclohexylcarbodiimide (DCC) and N-hydroxysuccinimide (NHS). Secondly, the obtained folate chitosan were blended with doxorubicin (DOX) and pyropheophorbide acid (PPa). Then we got the multifunction nanoparticles (FCDP–NPs) by inotropic gelation methods with tripolyphosphate (TPP). The singlet oxygen yield of FCDP–NPs was then tested by using the 1,3-diphenylisobenzofuran (DPBF) as a detector, and compared with pure PPa and folate chitosan conjugated pyropheophorbide acid nanoparticles (FCP–NPs) simultaneously. Furthermore, the chemical and photo-stability of FCDP–NPs in phosphate buffered solution (pH = 5, 7, 9) were investigated to evaluate the potential in PDT. In addition, the in vitro PDT activities, including the cellular uptake experiments, the cell photo-toxicity and dark toxicity experiments were investigated on HepG2 cells, the FCDP–NPs could enter the cells quickly and mainly located in cell nucleus in some degree. Besides, the formation of reactive oxygen species in HepG2 cells after PDT treatment was also studied. All the studies indicated that the small amount of DOX in FCDP–NPs can enhance the photodynamic activities, and the FCDP–NPs can be a great potential candidate in cancer therapy.
2. Results and discussion
2.1 Synthesis of FCDP–NPs
PPa is a good photosensitizer with large molar extinction coefficient and long absorption wavelength (683 nm in water). Meanwhile, DOX was known as the widely used chemotherapy drug, so we selected PPa as PDT drug and DOX as chemotherapy drug to increase the effective of PDT. The prepared methods were shown in Scheme 1, the folate chitosan (FC) was first prepared throw dehydration condensation reaction by DCC and NHS using folic acid and chitosan as the starting materials. The FC was purified from unreacted folic acid and chitosan by Sephadex G-10 gel chromatography, using 2% acetic acid buffer as eluent. Secondly, the obtained FC blended with DOX and PPa under stirring to generate folate chitosan conjugated doxorubicin and pyropheophorbide acid (FCDP), which was transformed into nanoparticles (FCDP–NPs) through tripolyphosphate (TPP) by ionic gelation method. The FCDP–NPs were shown good stability under test conditions.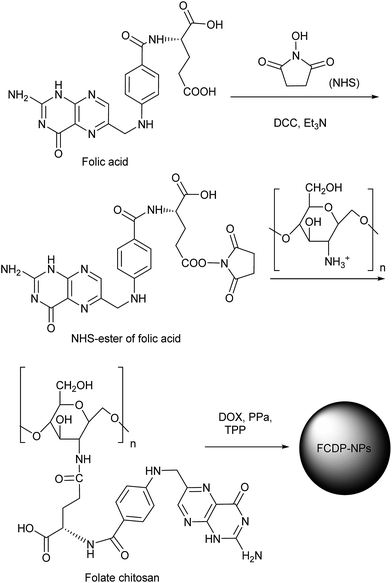 | ||
| Scheme 1 The preparation of folate chitosan conjugated doxorubicin and pyropheophorbide acid nanoparticles (FCDP–NPs). | ||
2.2 Characterization of FCDP–NPs
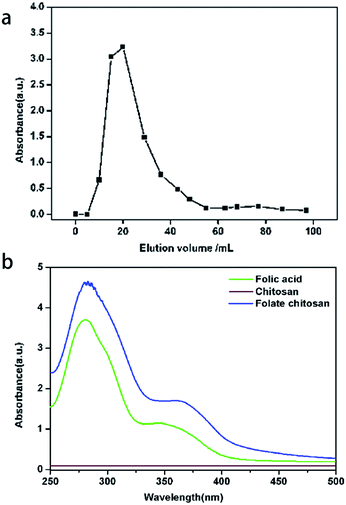
Via inotropic gelation methods, the FCDP–NPs were formed successfully, which was comprehensively confirmed by the following characterization analysis.The folate–chitosan (FC) was prepared through dehydration condensation reaction by DCC and NHS using folic acid and chitosan as the starting materials. The folate chitosan were purified by Sephadex G-10 gel chromatography, during which the fractions with high molecular weight would be eluted firstly followed by the fractions with small molecular weight. Due to that the chitosan has no absorption from 300 to 800 nm, the absorbance of folic acid at 363 nm was used to monitor the different collected fractions. As shown in Fig. 1a, two distinct peaks were observed and the separation was complete. The first one corresponded to folate chitosan with a high molecular weight and the second one corresponded to the unreacted folic acid with a low molecular weight.31 The UV spectra of folic acid, chitosan and folate chitosan were showed in Fig. 1b. The folic acid had two absorption, a weak peak at 363 nm and a strong at 280 nm, chitosan have no absorption from 300 to 800 nm and the absorption of folate chitosan was similar to the folic acid. To evaluate the extent of folate conjugation in folate chitosan, the quantitative UV analysis was performed, and it was found that 8.23% folic acid was linked to chitosan molecules.
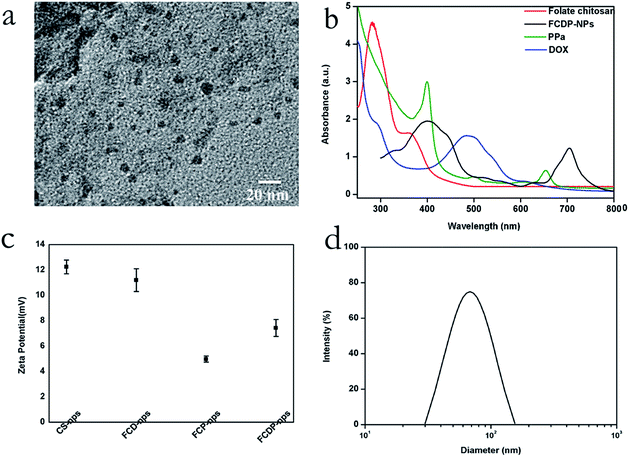
In order to clarify the size and morphology of FCDP–NPs, transmission electron microscope (TEM) were adopted. Fig. 2a showed the TEM image of FCDP–NPs, which clearly displayed that the nanoparticles presented a typical spherosome structure with a diameter of 8 ± 1.23 nm. Meanwhile, the hydrodynamic diameters of FCDP–NPs were measured using dynamic light scattering (DLS) analysis showed in Fig. 2d, and the mean diameters of FCDP–NPs in water was approximately 69.5 ± 4.47 nm, noted that the size of FCDP–NPs characterized by TEM was much smaller than the ones obtained by DLS, which is mainly due to that DLS gives a hydrodynamic size that corresponds to the core and the swollen corona of the micelles, whereas TEM often gives a size of the core for micelles in a dried state as the corona with low electronic density is not visible. Therefore, the nanoparticles size from TEM often stands for the actual size of the nanoparticles. In addition, the functional groups on the surface of the nanoparticles in water solution, such as the hydroxyl group and carboxyl group, will make the nanoparticles absorb together to form a larger agglomeration, which will make DLS more larger than the actual size. Meanwhile, the hydrodynamic sizes of the FCDP–NPs at different storage time periods were also recorded to evaluate their long-term colloidal stability, and the hydrodynamic size does not have any appreciable changes within a time period of 24 h. What's more, the zeta potential of the FCDP–NPs, free chitosan–NPs, FCD–NPs (folate chitosan conjugated DOX nanoparticles) and FCP–NPs (folate chitosan conjugated PPa nanoparticles) at pH 7.0 in water were all investigated. As shown in Fig. 2c, the zeta potential of free chitosan–NPs was 12.45 ± 0.55 mV, FCD–NPs was 11.19 ± 0.9 mV, FCP–NPs was 4.97 ± 0.24 mV, and FCDP–NPs was 7.43 ± 0.67 mV. Based on the above investigation, it was clear that FCDP–NPs had been successfully synthesized, which was also confirmed by the UV spectra. Fig. 2b displayed the UV spectra of folate chitosan, PPa, DOX and FDCP–NPs. PPa presented the typical absorptions of chlorophyll, that is, a strong absorption soret band at 413 nm and a shoulder Qy(0,0) band at 683 nm in water; the DOX showed a strong absorption at 490 nm, and the folate chitosan showed a strong absorption peaks at 280 nm and a shoulder peak at 363 nm. The obtained FCDP–NPs exhibits a broader soret peak (415 nm) and Qy(0,0) bands at 705 nm. It can be easily concluded that the largest absorption wavelength Qy(0,0) of FCDP–NPs showed significant red-shift from 683 nm to 705 nm comparing with PPa, yet it still maintains the normal absorption characteristics of free PPa.
The loading capacity (LC) of the nanoparticles was also determined by the change of absorption of the samples before and after encapsulation. Firstly, pure PPa was determined by measuring its Qy absorbance (A) at 683 nm, the correlation between absorption and the concentrations of PPa was normalized by linear regression, and the standard curve has a well correlation coefficient (R2 = 0.9976), described by the following equation: Y = 0.0066X + 0.0812. Pure DOX was determined by the same methods by measuring its absorbance (A) at 490 nm, and the standard curve also has a well correlation coefficient (R2 = 0.9984), described by the following equation: Y = 0.0048X + 0.0771. According to the formula as describe in the experimental part, the final loading capacity of PPa was 10.24 ± 0.92% and DOX was 15.67 ± 1.2%. The loading capacity was also used to calculate the concentration of PPa and DOX in FCDP–NPs.
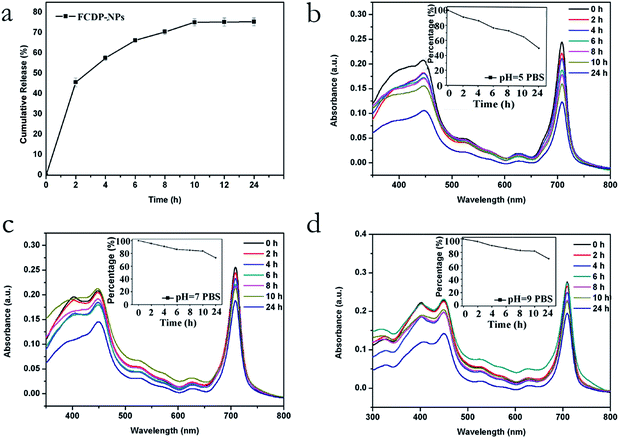
Next, we studied the drug release of FCDP–NPs in Dulbecco's Modified Eagle Medium (DMEM). As shown in Fig. 3a, the FCDP–NPs showed a burst release of 45% at 2 h, followed by an additional release of 36% over 24 h, indicating that the FCDP–NPs could release half of the PPa in a short time, and after 24 h, about 80% of the PPa could be released from FCDP–NPs. Moreover, the absorption FCDP–NPs at 705 nm in PBS (5 × 10⁻⁴ M, pH = 5, 7, 9, respectively) was measured in evaluate the stability of FCDP–NPs. The results were shown in Fig. 3b–d. It was found that FCDP–NPs was degraded in different pH conditions, yet after 24 h, the degradation rate of FCDP–NPs in PBS (pH = 5) was higher than that in PBS (pH = 7) and PBS (pH = 9), indicated that FCDP–NPs were more stable in neutral and alkaline environment than acidic environment. Therefore, it is reasonable to believe that FCDP–NPs has better stability in PBS medium and at physiological pH, which could be served as a potential photosensitizer for in vivo photodynamic therapy.
2.3 Singlet oxygen quantum yield
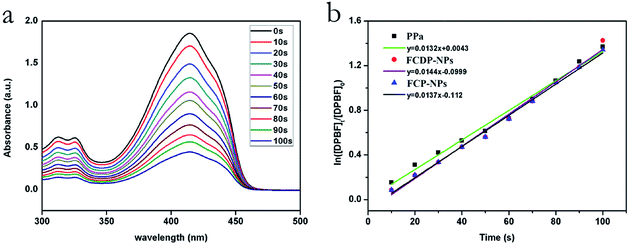
Energy transfer between the triplet state of a PS and ground state molecular oxygen leads to the production of singlet oxygen. It is essential to generate large amounts of singlet oxygen. Generally speaking, single oxygen (1O2) is the mainly reactive agent of photosensitizer induced photodynamic therapy (PDT), and it is necessary for PDT. In order to measure the generation of singlet oxygen, DPBF (1,3-diphenylisobenzofuran), a quencher of singlet oxygen (1O2) with maximum absorption peak at 415 nm was used in this experiment.32,33 Fig. 4a showed the UV absorption spectra of DPBF after reacting with 1O2 produced by FCDP–NPs under different irradiation times (675 ± 10 nm, 10 J cm−2). The gradually decreased absorbance with increasing irradiation time indicated that FCDP–NPs could efficiently produce 1O2, thus leading to the decomposition of DPBF. Meanwhile, the 1O2 quantum yield (ΦΔ) of FCDP–PNs was obtained as 64% (correlation coefficient R2 > 0.9936) according to the calculation by using methylene blue as the reference compound (ΦΔ = 49.1% in DMF).34 However, the 1O2 quantum yield of pure PPa was 59.1% and FCP–NPs was 61.2%, there were little lower than that of FCDP–NPs. Thus, FCDP–NPs may cause excellent cell toxicity in vitro because of the high generation of singlet oxygen in the experimental conditions.2.4 Photobleaching
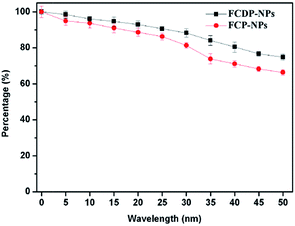
Photobleaching is an important property of a photosensitizer, and it is often completely or partially coupled to the photodynamic reaction. Excellent anti-photobleaching ability is very important for an ideal PS. Photobleaching is usually considered as a disadvantage because it can reduce the yield of reactive oxygen substance (ROS) and decreases the ability to destroy tumours, so the photostability of a PS is great importance for PDT. In this paper, the absorptions of FCDP–NPs and FCP–NPs in PBS (2 × 10⁻⁴ M) at 705 nm were recorded to test the photostability after different irradiation time. The photobleaching curves were drawn according to the absorption at 705 nm and irradiation time. According to the curve in Fig. 5, despite the slightly decreased absorption of FCDP–NPs and FCP–NPs with increasing time, yet the declining trend was slow. Specially, after irradiation of 10 min, there was only 3% photobleaching rate for FCDP–NPs. Considering that the PS could achieve good PDT effect after a 10 min irradiation, the photobleaching of FCDP–NPs has a little influence on PDT effect. Moreover, it is interesting that FCDP–NPs showed lower photobleaching rate than those of FCP–NPs in spite of a not significant different, yet it still suggested that the introduction of DOX would improve the photostability to some extent. We suspect the multicyclic structure of DOX with potential chromophore (multi-conjugated π bonds) could protect the PPA from being photobleached.2.5 Cell uptake
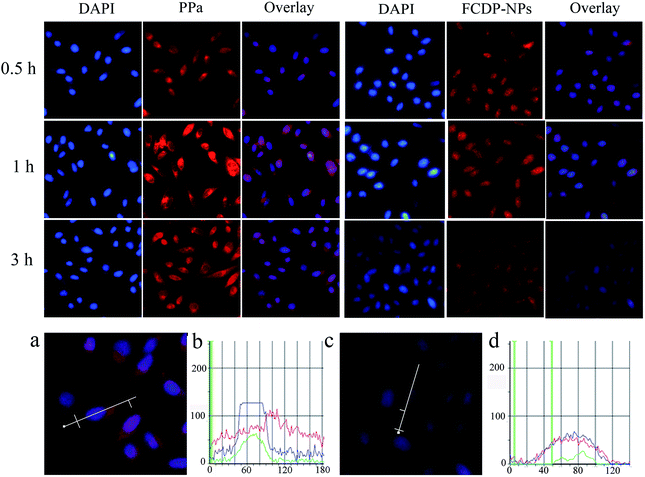
A better therapeutic therapy needs efficient cellular uptaking for photosensitizer. In order to study the cell uptake of FCDP–NPs and efficient cellular location in HepG2 cells, the cells were treated with FCDP–NPs at various incubation times (0.5 h, 1 h, 3 h) were stained using DAPI, which is a fluorescence probe for cell nucleus. After staining the nucleus would display blue fluorescence, and PPa in the FCDP–NPs would emit red fluorescence, which could act as an indicator of the uptake behaviour of FCDP–NPs in cells. The cell uptaking experiments of PPa was also conducted. Fluorescence inverted microscopy was adopted to analyse the uptake behaviour. In our study, the concentration of FCDP–NPs was 50 μg mL−1, and the concentration of PPa was 5 μg mL−1. The amounts of PPa in the two samples were consistent for reasonable comparison. Fig. 6 showed the experimental results, the spots with fluorescence stand for the cell nuclear stained by DAPI, the ‘PPa’ column and ‘FCDP–NPs’ column stand for the location of PPa with red fluorescence, and the ‘Overlay’ column stands for the merge of the DAPI column and the FCDP–NPs or PPa column. The images clearly showed that both FCDP–NPs and PPa can enter the cells quickly, and the fluorescence were observed to be increasing over the cell culture time for all samples. PPa and FCDP–NPs showed similar trend of uptaking for all time. But some remarkable differences of fluorescence intensity can be observed. The red fluorescence in PPa were a little stronger than that in FCDP–NPs after incubated with PSs for 1 h, the reason for which may be that it need time for FCDP–NPs to release free PPa from the nanoparticles. As described earlier, about 46% of PPa would be resealed from FCDP–NPs after 1 h, at this time, part of PPa was still encapsulated in the nanoparticles, so the fluorescence of FCDP–NPs groups were lower than that of the pure PPa. Moreover, the location of nanoparticles in cells could also be observed from the fluorescence signal. We have displayed the enlarged HepG2 cells after incubated with PPa and FCDP–NPs for 3 h in Fig. 6a and c respectively. Meanwhile the fluorescence distribution images of HepG2 cells were displayed in Fig. 6b and d, in which the blue lines stand the fluorescence signal of DAPI, red lines stand for the fluorescence signal of PPa, and the green lines stand for the background absorption. As showed in Fig. 6b, the blue fluorescence mainly distributed in cell nucleus, yet the red fluorescence distributed in a broad district suggesting that PPa was distributed throughout the cell. For FCDP–NPs shown in Fig. 6d, the blue and red fluorescence signal showed similar distribution. Due to DAPI was mainly located in cell nucleus, thus we can conclude that the FCDP–NPs was also mainly located in cell nucleus. This interesting phenomenon may be attributed to the target group folic acid and the existence of the DOX. It has been widely reported that DOX mainly acted in the site of cell nucleus.29,30 Therefore, the introduction of DOX to FCDP–NPs could improve the nucleus targetability to some degree.2.6 Dark toxicity and photodynamic activities toxicity
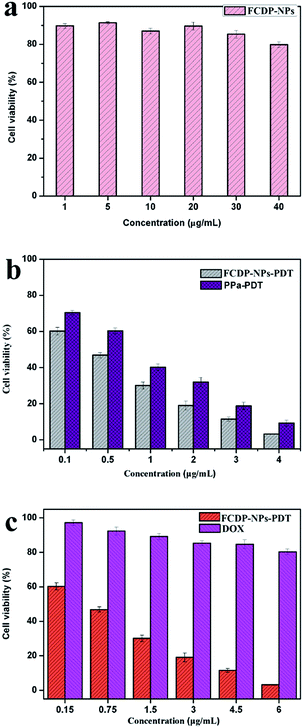
In our previous report, pure PPa showed little dark cytotoxicity. However, due to the cytotoxicity of DOX, the cell dark toxicity of the FCDP–NPs should be evaluated for biomedical applications. Here, the dark toxicity and photodynamic toxicity were measured by MTT assay. As shown in Fig. 7a, the FCDP–NPs at the concentration ranging from 1 to 40 μg mL−1 did not cause any obvious cell toxicity effect compared with the negative control groups (cells treated with DMEM). For cell toxicity experiments, the tests were divided into three groups, that is, FCDP–NPs (1, 5, 10, 20, 30 and 40 μg mL−1) groups, pure DOX groups (0.15, 0.75, 1.5, 3, 4.5, and 6 μg mL−1) and pure PPa groups (0.1, 0.5, 1, 2, 3 and 4 μg mL−1). The concentrations of PPa were equal to that in FCDP–NPs, and the concentrations of DOX were equal to that in FCDP–NPs. The cell toxicity was shown in Fig. 7b, both FCDP–NPs and PPa groups showed a drug concentration-dependent cytotoxicity to HepG2 cells after 5 min irradiation, while FCDP–NPs remarkably led higher cell mortality rate compared with free PPa, indicating that the PDT activity of FCDP–NPs has been effectively improved compared with free PPa. Meanwhile, at the concentration of 40 μg mL−1, FCDP–NPs caused 92% cell mortality rate as shown in Fig. 7c, DOX (whose concentration was 6 μg mL−1 in FCDP–NPs) only cause 20% cell mortality rate. Based on the above analysis, the FCDP–NPs presented higher cell toxicity than pure DOX and pure PPa, and introduction of DOX could effectively improve the PDF effect, with little dark cytotoxicity.2.7 Morphology
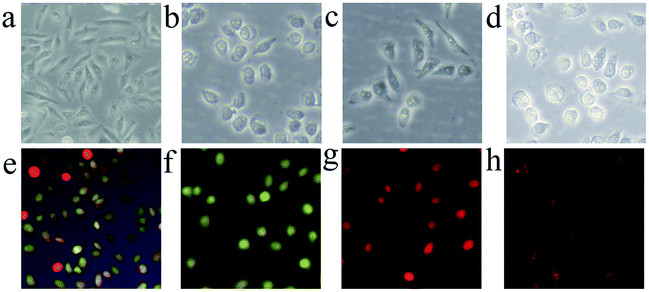
We also assess the cell morphological changes of HepG2 cells by FIM in bright field after FCDP–NPs (20 μg mL−1) PDT treatment and subsequently incubation for 0 h, 3 h, 6 h, 12 h respectively. From Fig. 8a–d, it is clear that the cells treated with FCDP–NPs at the studied concentrations displayed remarkable morphological changes when compared with the control groups treated with PBS. With the increasing of time, the cells were damaged. These results corroborated with the cell toxicity, confirmed the excellent photodynamic activities of the FCDP NPs. In order to further investigate the cell morphology after PDT. Acridine orange (AO) and ethidium bromide (EB) double fluorescent staining were used, then cell imaging was analysed by fluorescent inverted microscope and shown in Fig. 8e–h. Generally speaking, after incubation with AO and EB dyes, the dyes can bind to nucleus DNA of normal cell and necrotic cell, showing yellow-green fluorescence and reddish-orange fluorescence, respectively. Specially, the nucleus of early apoptotic cells would exhibit yellow-green fluorescence and appeared karyopyknosis; late apoptotic cell nucleus would show concentrated and asymmetrical reddish-orange fluorescence and appeared karyopyknosis as well; necrotic cells would show increased nucleus in volume and exhibit uneven reddish-orange fluorescence at their periphery. Based on the above investigation, the cell and nucleus morphological changes after FCDP–NPs treatment clearly indicated that FCDP–NPs had a higher PDT activity to induce damage and apoptotic cell death in HepG2 cells, which were also in good agreement of the significantly improved PDT efficiency in in vitro PDT testing.2.8 Type I and Type II mechanism during PDT progress
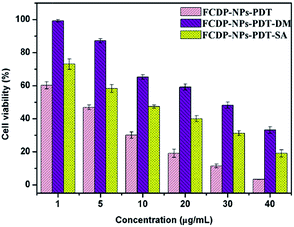
The triplet state photosensitizer can directly interact with a substrate, and then passing an electron to nearby tissue oxygen, producing oxygen centred radicals such as hydroxyl radicals (HR), superoxide anion as well as hydrogen peroxide (Type I PDT). Alternatively, the excitation energy can be directly transferred to nearby tissue oxygen to form 1O2 (Type II PDT). The above ROS has a strong activity to induce tissue damage. In order to visualize the photochemical mechanisms of PDT, sodium azide (SA) and D-mannitol (DM), which has of relative specificity to 1O2 and hydroxyl radicals (HR) respectively, were used to quench corresponding ROS of Type II and Type I originated from photodynamic reaction, and meanwhile confirm the two photodynamic types.35,36 The result were shown in Fig. 9. After adding quencher SA and DM into cells incubated with various concentration of FCDP–NPs, the cell viability of FCDP–NPs–PDT–SA groups and FCDP–NPs–PDT–DM groups were significantly higher than that of FCDP–NPs–PDT groups, indicating that the ROS (1O2 and hydroxyl radicals) generated from FCDP–NPs during PDT reaction have been quenched effectively. From the results, the Type I and Type II occurred simultaneously in this PDT process. Besides, the cell viability of FCDP–NPs–PDT–DM groups was obviously higher than that of FCDP–NPs–PDT–SA groups, indicating that Type I significantly greater effect on photodynamic effects than Type II.3. Experimental
3.1 Materials
Chitosan (Mw > 100 kDa), tripolyphosphate (TPP), dicyclohexylcarbodiimide (DCC), doxorubicin and N-hydroxysuccinimide (NHS) were all purchased from Sigma. Pyropheophorbide acid was prepared according to the previous report. Dulbecco's Modified Eagle Medium (DMEM), dimethyl sulfoxide (DMSO), phosphate buffered saline (PBS), trypsin, 4′,6-diamidino-2-phenylindole (DAPI), 3-(4,5-dimethyl-2-thiazolyl)-2,5-diphenyl-2-H-tetrazolium bromide (MTT), D-mannitol (DM), sodium azide (SA), 1,3-diphenylisobenzofuran (DPBF), acridine orange (AO) and ethidium bromide (EB) were purchased from sigma, and other reagent were of analytical grade and used without any purification. Deionized water with a resistivity of 18.2 M cm was obtained from a Milli-Q Gnadient System and used in all experiments. Human hepatoma cell line (HepG2) was obtained from ATCC.3.2 Synthesis of folate–chitosan conjugated with doxorubicin and pyropheophorbide acid nanoparticles (FCDP–NPs)
The folic acid conjugated chitosan was prepared according to the previous reports.31,37,38 Briefly, for the synthesis of folic acid conjugated chitosan, at first, 300 mg folic acid was dissolved in 10 mL DMSO, then 93 mg dicyclohexylcarbodiimide (DCC), 77 mg N-hydroxysuccinimide (NHS) and 0.5 mL triethylamine were added, 30 °C stirring overnight. Flitted to remove the by-products dicyclohexyl urea, then mixed by driping into cold anhydrous diethyl ether containing 30% acetone, finally got yellow precipitate, filtered, anhydrous diethyl ether washing several times after the vacuum drying, got NHS-ester of folic acid. Second, a DMSO solution of NHS-ester of folic acid was prepared and stirred at room temperature until the NHS-ester of folic acid was well dissolved, then added to a solution of chitosan in acetate buffer (PH = 5.5), the mixture were stirred at room temperature in the dark for 16 h. Then it was brought to PH = 9 by dropping 10 M NaOH, filtrated to get the precipitation, wash by water for several times and resolved in 2% acetic acid aqueous solution, last separated by SepHadex G – 10 gel column ion, removed the free folic acid not reaction. The moving phase 2% acetic acid solution and the velocity was 1.5 mL min−1. A UV-visible spectrophotometer (UV-2000 SHIMADZU, Japan) was used to monitor the cleaning process at 363 nm, collected the first effluent peak and freeze drying reserve to get the folate chitosan. Next a solution of the obtained folate chitosan was prepared in the 3 mL 2% acetic acid aqueous solution to get a final concentration of 2 mg mL−1, 300 μg doxorubicin and 300 μg pyropheophorbide acid were added into the solution, it was brought to PH = 5.5 by dropping 10 M NaOH, then stirred at room in the dark for 24 h to get folate chitosan conjugated doxorubicin and pyropheophorbide acid (FCDP). Finally, the FCDP was prepared in the 1.5 mL 2% acetic acid aqueous solution to get a final concentration of 4 mg mL−1, then it was brought to PH = 5 by dropping 10 M NaOH, after that, 0.5 mL 2 mg mL−1 tripolyphosphate (TPP) was slowly dropped into the solution under magnetic stirring conditions, keeping stirring for 30 min to get the FCDP–NPs.3.3 Physicochemical characterization of FCDP–NPs
UV-vis spectra was collected with a UV-2000 (SHIMADZU, Japan) at room temperature in a quartz cuvette with a path length of 1 cm.39 The hydrodynamic size and zeta potential of composite was carried out with NanoBrook Zeta PALS Zeta Potential Analyzer (Brookhaven) at room temperature in water, the samples were diluted by ultrapure water and the pH value and concentration of the NPs dispersion were fixed before measurement. The shape and size of the FCDP–NPs were observed by a Tecnai G2 F20S-TWIN transmission electron microscope (TEM FEI, America) operating at 200 kV. TEM grids were prepared by depositing a drop of the diluted nanoparticle suspension on a carbon-coated copper support films and drying the grids under vacuum for 2 h.40 The stabilities of FCDP–NPs in PBS (PH = 5, 7, 9), were studied by an ultraviolet visible spectrophotometer (UV-2000, SHIMADZU, Japan). All the measurements were carried out at room temperature in a quartz cuvette with a path length of 1 cm. The same concentration of FCDP–NPs was dissolved in 3 mL PBS (PH = 5, 7, 9) to got a finally concentration of 1 × 10⁻⁴ M respectively, then stored at 4 °C for different times. Then the absorbance at 705 nm was monitored at various time points. The loading capacity of FCDP–NPs was determined by the separation of nanoparticles from the water medium containing non-associated doxorubicin and pyropheophorbide acid by ultracentrifugation at 15![[thin space (1/6-em)]](https://www.rsc.org/images/entities/char_2009.gif) 000 rpm, 4 °C for 40 min. The absorbance of 490 nm (for doxorubicin) and 683 nm (for pyropheophorbide acid) were measured by UV-2000 spectrometry (SHIMADZU, Japan), using a calibration curve of doxorubicin and pyropheophorbide acid in water.41 Loading capacity (LC) of the FCDP–NPs was calculated as follows: LC% = (total drug − free drug)/(NPs weight) × 100. The drug release of PPa was studied in DMEM cell culture medium, in brief, 2 mg FCDP–NPs was dispersed in 3 mL DMEM cell culture medium at 37 °C. At varying time points, the medium were measured by UV-vis spectra. Following supernatant extraction, FCDP–NPs were discarded. Calibration curves were made with the incubation medium, and all the experiments were performed three times, and the results were depressed as mean ± SD.
000 rpm, 4 °C for 40 min. The absorbance of 490 nm (for doxorubicin) and 683 nm (for pyropheophorbide acid) were measured by UV-2000 spectrometry (SHIMADZU, Japan), using a calibration curve of doxorubicin and pyropheophorbide acid in water.41 Loading capacity (LC) of the FCDP–NPs was calculated as follows: LC% = (total drug − free drug)/(NPs weight) × 100. The drug release of PPa was studied in DMEM cell culture medium, in brief, 2 mg FCDP–NPs was dispersed in 3 mL DMEM cell culture medium at 37 °C. At varying time points, the medium were measured by UV-vis spectra. Following supernatant extraction, FCDP–NPs were discarded. Calibration curves were made with the incubation medium, and all the experiments were performed three times, and the results were depressed as mean ± SD.
3.4 Singlet oxygen quantum yield
The singlet oxygen quantum yield of FCDP–NPs, FCP–NPs and PPa after light irradiation were measured by the singlet oxygen induced bleaching of 1,3-diphenylisobenzofuran (DPBF) using methylene blue as the reference compound.42,43 In a typical experiment, 20 μL of solutions of pure PPa, FCP–NPs and FCDP–NPs (containing the same PPa concentration of 2.8 × 10⁻⁵ M) in DMF respectively, and then added into 3 mL of a stock solution of DPBF (6 × 10⁻⁵ M) in DMF which had been transferred to a sealed quartz cuvette. Then irradiation by a calibrated visible light 675 ± 10 nm (10 J cm−2 NBET HS-UV300), the absorbance of the solution at 415 nm was measured every 10 s for a 110 s period with an UV-spectrophotometer (UV 2000, SHIMADZU, Japan). The singlet oxygen quantum yield (ΦΔ) was calculated using following equations:| ΦΔ(S) = ΦΔ(R)kSIaT(R)/kRIaT(S) | (1) |
| Ia = I0(1 − e−2.3A) | (2) |
3.5 Photobleaching of FCDP NPs
For the photobleaching experiments,44,45 FCDP–NPs was dissolved in PBS to get a final concentration of 5 × 10⁻⁴ M, and transfer the solution to 1 × 1 cm glass cuvettes, then irradiation with a calibrated visible light every 5 min (675 ± 10 nm, 10 J cm−2 NBET HS-UV300), the absorption at 705 nm were recorded using a UV-spectrophotometer at interval of 5 min before irradiation and during the irradiation, after irradiation for 0 min, 5 min, 10 min, 15 min, 20 min, 25 min, 30 min, 35 min, 40 min, 45 min, 50 min, the absorptions at 705 nm had been tested respectively. All the experiments were carried out at room temperature and in dark. The experiments were performed three times; the results were showed as mean ± SD.3.6 Cell culture
Human hepatica cell line (HepG2) were cultured in Dulbecco's modified Eagle's medium (DMEM medium) supplemented with 10% FBS, 100 units per mL of penicillin and 100 units per mL of streptomycin at 37 °C in a humid 5% CO2 incubator. Cells were grown in 75 cm2 culture flacks with 7 mL of medium that was changed every second days until a sufficient number of cells were obtained. Cells were than washed three times with PBS and incubated with trypsin–EDTA solution (0.25% trypsin, 1 mM EDTA) for 2 min at 37 °C to detach them from the flask. The cells were then suspended in medium in preparation for reseeding. Cells density was determined by counting cells using a haemocytometer with 0.9 mm3 counting chamber.46 And cell viability were determined by MTT (3-(4,5-dimethylthiazol-2-yl)-2,5-diphenyltetrazolium bromide) assay and a Biotek ELx800 absorbance microplate reader was used in MTT assay.3.7 Dark toxicity assay
The dark toxicity was tested by MTT colorimetric assay,47 in brief, HepG2 cells were seeded into 96-well plates with 100 μL fresh medium at a density of 1 × 10⁴ cells per well. After incubation for 12 h to bring the cells to confluence, the medium was replaced with 200 μL fresh medium containing FCDP–NPs with different final concentrations (1, 5, 10, 20, 30, and 40 μg mL−1, respectively) and the cells were incubated for 24 h at 37 °C and 5% CO2. Thereafter, MTT solution (20 μL, 5 mg mL−1 in PBS buffer) was added into each well and the cells were incubated for another 4 h. The assays were carried out according to the manufacturer's instruction. The absorbance at 570 nm of each well was measured using a Biotek ELx800 absorbance microplate reader. Cell viability (%) was then calculated by the equation:| Cell viability (%) = (As − Ab)/(Ac − Ab) × 100% |
3.8 Cell uptake
Fluorescence Inverted Microscope (FIM) was used to investigated the cell uptake on HepG2 cell. HepG2 cells (1 × 10⁶ cells per well) were seeded in 6-well plates and incubated overnight at 37 °C in a humidified CO2 atmosphere. After being rinsed with PBS, the cells were incubated with 1 mL, 50 μg mL−1 of FCDP–NPs or pure 5 μg mL−1 PPa for 0.5 h, 1 h and 3 h respectively at 37 °C in the dark under the same conditions. For observed, the cells were rinsed with PBS, then fixed with glutaraldehyde for 10 min and stained with DAPI (1 μg mL−1 in PBS) for 10 min, observed via a Fluorescence Inverted Microscope (Leica DM IL LED, Leica Microsystems, Germany).47,483.9 Cytotoxicity and cell morphology observation
MTT assay was used to quantify the viability of the cells after treated with FCDP–NPs, pure DOX and pure PPa at different concentration. Briefly, HepG2 cells were seeded into a 96-well plate at an initial density of 1 × 10⁴ cells per well in 100 μL DMEM medium. After overnight incubation to bring the cell to confluence, the medium was replaced with 100 μL fresh medium containing pure PBS buffer (set as blank), FCDP–NPs (1, 5, 10, 20, 30 and 40 μg mL−1), pure DOX (0.15, 0.75, 1.5, 3, 4.5 and 6 μg mL−1), pure PPa (0.1, 0.5, 1, 2, 3 and 4 μg mL−1) were added into the 96 cell plates respectively. After 4 h incubation, exposed the cells to visible light for 5 min (675 ± 10 nm, 10 J cm−2 NBET HS-UV300), incubation at 37 °C and 5% CO2 for another 24 h. Then 20 μL MTT (0.5 mg mL−1 in PBS buffer) was added to each well to detect the metabolically active cells. After further incubation for 4 h in an incubator at 37 °C, 150 μL DMSO was added to each well to replace the culture medium and dissolve the insoluble formazan crystals. The assays were carried out according to the manufacturer's instructions and the absorbance of each well was measured using a (a Biotek ELx800 absorbance microplate reader) at 570 nm. The results were shown mean ± SD, all the experiments were performed three times. For morphology observation, HepG2 cells were seeded into a 6-well plate at an initial density of 1 × 10⁶ cells per well in 1000 μL DMEM medium. After overnight incubation to bring the cell to confluence, the medium was replaced with 1000 μL FCDP–NPs (20 μg mL−1), after 4 h, the cells were exposed under light (675 ± 10 nm, 10 J cm−2 NBET HS-UV300), then continue incubated for 0 h, 3 h, 6 h, 12 h respectively, then stained by acridine orange (AO, 100 μg mL−1) and ethidium bromide (EB, 100 μg mL−1), finally, the cells morphology were observed by a Fluorescence Inverted Microscope (FIM, Leica DM IL LED, Leica Microsystems, Germany).3.10 Type I and Type II mechanism during PDT progress
Type I and Type II mechanism of PDT on HepG2 cells was investigated by MTT colorimetric assay and cell viability were monitored. The quenchers sodium azide (SA, Sigma-Aldrich) and D-mannitol (DM, Sigma-Aldrich), which have relative specificity for singlet oxygen (1O2) and hydroxyl radicals respectively,49 can quench the corresponding ROS generated from photodynamic reaction. The experiments were divided into three groups: FCDP–NPs photo-toxicity experiment groups, FCDP–NPs–SA photo-toxicity experiment groups, FCDP–NPs–DM photo-toxicity experiment groups. HepG2 cells were seeded into 96-well plates at a density of 1 × 10⁴ cells per well in DMEM and incubated for 24 h. Then, the medium were replaced by 100 μL of different concentrations of FCDP–NPs in all of the three experiment groups. The final concentrations of FCDP–NPs were 1, 5, 10, 20, 30, and 40 μg mL−1. In addition, added 20 μL SA (20 μM) to each well of the FCDP–NPs–SA photo-toxicity experiment groups and added 20 μL DM (40 μM) to each well of the FCDP–NPs–DM photo-toxicity experiment groups. Then, the three groups were incubated for 4 h followed by exposure to visible light (675 ± 10 nm, 10 J cm−2 NBET HS-UV300) for 5 min, and then cultured in the dark for an additional 24 h in DMEM media at 37 °C under 5% CO2 conditions. Cell viability was determined by MTT assay. Each experiment was repeated three times, the results were described as mean ± SD.3.11 Statistical analysis
Results were expressed as the mean ± SD from three independent experiments, comparison between different groups were determined using T-text and significant differences were assumed at P-value < 0.05. The dates were analysed using SPSS 19.0 software.4. Conclusions
In summary, we have successfully prepared multifunctional folate chitosan conjugated DOX and PPa nanoparticles (FCDP–NPs). FCDP–NPs showed good chemical stability in PBS (pH = 5, 7, 9), and excellent photo-stability in PBS (pH = 7.4), and high singlet oxygen yield (64%). FCDP–NPs possess tumor targeting due to the introduction of folic acid, and remarkable anti-tumor activity against HepG2 cells because of DOX. Meanwhile, through cell uptaking experiments, we have found that DOX could improve the nuclear targeting capability of FCDP–NPs to some degree. FCDP–NPs showed higher cell toxicity after irradiation by light, but low dark toxicity without irradiation despite the introduction of DOX. The morphological changes of HepG2 cells further indicated that FCDP–NPs can induce damage and apoptotic cell death. Meanwhile, we confirmed that Type I and Type II photodynamic reactions occurred simultaneously during PDT process, and Type I reaction (the generation of hydroxyl radicals) plays a predominant role. All the results showed the FCDP–NPs would have great potential in applications in clinical patients with tumour cancer.Conflicts of interest
There are no conflicts to declare.Acknowledgements
Financial support of this research was provided by the National Natural Science Foundation of China (No. 21272048), the Natural Science Youth Foundation of Heilongjiang Province (No. QC2016011) and the Scientific Research Fund of Heilongjiang Provincial Education Department (No. 12531194, 12541234) and the Graduate Innovation Foundation of Harbin Normal University.References
- X.-H. Zhang, L.-J. Zhang, J.-J. Sun, Y.-J. Yan, L.-X. Zhang, N. Chen and Z.-L. Chen, Biomed. Pharmacother., 2016, 81, 265–272 CrossRef CAS PubMed.
- Z. Meng, B. Shan, L. Zhang, G.-Y. Han, M.-H. Liu, N.-Y. Jia, Z.-Y. Miao, W.-N. Zhang, C.-Q. Sheng and J.-Z. Yao, Chin. Chem. Lett., 2016, 27, 623–626 CrossRef CAS.
- G.-J. Cao, R.-X. Rong, Y.-N. Wang, Q. Xu, K.-R. Wang and X.-L. Li, Dyes Pigm., 2017, 136, 569–576 CrossRef CAS.
- D. Zhang, M. Wu, Y. Zeng, L. Wu, Q. Wang, X. Han, X. Liu and J. Liu, ACS Appl. Mater. Interfaces, 2015, 7, 8176–8187 CAS.
- H. Ding, H. Yu, Y. Dong, R. Tian, G. Huang, D. A. Boothman, B. D. Sumer and J. Gao, J. Controlled Release, 2011, 156, 276–280 CrossRef CAS PubMed.
- A. Roby, S. Erdogan and V. P. Torchilin, Eur. J. Pharm. Biopharm., 2006, 62, 235–240 CrossRef CAS PubMed.
- G. Kirdaite, N. Lange, N. Busso, H. V. D. Bergh, P. Kucera and A. So, Arthritis Rheum., 2002, 46, 1371–1378 CrossRef CAS PubMed.
- A. Mateašík, M. Trnka, K. Kajo, M. Vallová and B. Čunderlíková, J. Photochem. Photobiol., B, 2016, 166, 94 CrossRef PubMed.
- M. Korbelik, Lasers Surg. Med., 2006, 38, 500–508 CrossRef PubMed.
- Y. G. Qiang, C. M. N. Yow and Z. Huang, Med. Res. Rev., 2008, 28, 632–644 CrossRef CAS PubMed.
- T. C. Zhu and J. C. Finlay, Med. Phys., 2008, 35, 3127 CrossRef CAS PubMed.
- A. Kamkaew, S. H. Lim, B. L. Hong, L. V. Kiew, L. Y. Chung and K. Burgess, Chem. Soc. Rev., 2013, 42, 77–88 RSC.
- D. A. Bellnier, W. R. Greco, G. M. Loewen, H. Nava, A. R. Oseroff, R. K. Pandey, T. Tsuchida and T. J. Dougherty, Cancer Res., 2003, 63, 1806–1813 CAS.
- S. J. Mora, M. P. Cormick, M. E. Milanesio and E. N. Durantini, Dyes Pigm., 2010, 87, 234–240 CrossRef CAS.
- P. D. Senter and J. Kopecek, Mol. Pharm., 2004, 1, 395 CrossRef CAS.
- Y. Kato, H. Onishi and Y. Machida, Biomaterials, 2004, 25, 907–915 CrossRef CAS PubMed.
- M. S. Islam, P. Haque, T. U. Rashid, M. N. Khan, A. K. Mallik, M. N. Khan, M. Khan and M. M. Rahman, J. Mater. Sci.: Mater. Med., 2017, 28, 55 CrossRef PubMed.
- Y. S. Lin, R. Radzi, M. Morimoto, H. Saimoto, Y. Okamoto and S. Minami, J. Biomater. Sci., Polym. Ed., 2012, 23, 1401–1420 CrossRef CAS PubMed.
- S. M. Reza, R. M. Tabatabaie, A. Maharramov and R. M. Ali, Int. J. Biol. Macromol., 2011, 49, 1059–1065 CrossRef PubMed.
- Y. Wu, W. Yang, C. Wang, J. Hu and S. Fu, Int. J. Pharm., 2005, 295, 235–245 CrossRef CAS PubMed.
- G. Storm, S. O. Belliot, T. Daemen and D. D. Lasic, Adv. Drug Delivery Rev., 1995, 17, 31–48 CrossRef CAS.
- M. R. Saboktakin, R. M. Tabatabaie, A. Maharramov and M. A. Ramazanov, Int. J. Biol. Macromol., 2011, 49, 1059–1065 CrossRef PubMed.
- A. C. Antony, Annu. Rev. Nutr., 1996, 16, 501 CrossRef CAS PubMed.
- H. Wang, L. Zheng, C. Peng, M. Shen, X. Shi and G. Zhang, Biomaterials, 2013, 34, 470–480 CrossRef CAS PubMed.
- W. Qi, A. Wang, Y. Yang, M. Du, M. N. Bouchu, P. Boullanger and J. Li, J. Mater. Chem., 2010, 20, 2121–2127 RSC.
- C. H. M. Ng and A. L. Jackman, Potential for α-Folate Receptor-Targeted Treatment for Ovarian Cancer, Springer, New York, 2011 Search PubMed.
- X. C. Qin, Z. Y. Guo, Z. M. Liu, W. Zhang, M. M. Wan and B. W. Yang, J. Photochem. Photobiol., B, 2013, 120, 156–162 CrossRef CAS PubMed.
- H. Azaïs, P. Foucher, A. Bassil, S. K. Bach, B. Leroux, J. B. Tylcz, C. Frochot, N. Betrouni, P. Collinet and S. Mordon, Photodiagn. Photodyn. Ther., 2017, 17, A10 CrossRef.
- N. U. Khaliq, F. C. Sandra, D. Y. Park, J. Y. Lee, K. S. Oh, D. Kim, Y. Byun, I.-S. Kim, I. C. Kwon, S. Y. Kim and S. H. Yuk, Biomaterials, 2016, 101, 131–142 CrossRef CAS PubMed.
- N. Zhao, B. Wu, X. Hu and D. Xing, Biomaterials, 2017, 141, 40–49 CrossRef CAS PubMed.
- B. Stella, S. Arpicco, M. T. Peracchia, D. Desmaële, J. Hoebeke, M. Renoir, J. D'Angelo, L. Cattel and P. Couvreur, J. Pharm. Sci., 2000, 89, 1452–1464 CrossRef CAS PubMed.
- Z. Musil, P. Zimcik, M. Miletin, K. Kopecky, P. Petrik and J. Lenco, J. Photochem. Photobiol., A, 2007, 186, 316–322 CrossRef CAS.
- Y. Cheng, A. C. Samia, J. D. Meyers, I. Panagopoulos, B. Fei and C. Burda, J. Am. Chem. Soc., 2008, 130, 10643–10647 CrossRef CAS PubMed.
- L. Zhang, K. Yan, Y. Zhang, R. Huang, J. Bian, C. Zheng, H. Sun, Z. Chen, N. Sun and R. An, Proc. Natl. Acad. Sci., 2007, 104, 4606–4611 CrossRef CAS PubMed.
- S. F. Mujtaba, A. Dwivedi, N. Yadav, R. S. Ray and G. Singh, J. Hazard. Mater., 2013, 252–253, 258–271 CrossRef CAS PubMed.
- H. Li, X. Yi, K. Yuichiro, Z. Timur, T. Masamitsu and H. Michael, Lasers Surg. Med., 2012, 44, 490–499 CrossRef PubMed.
- K. A. Janes, M. P. Fresneau, A. Marazuela, A. Fabra and M. a. J. Alonso, J. Controlled Release, 2001, 73, 255–267 CrossRef CAS PubMed.
- H. Jian, S. Duan, Y. Xia, Z. Qian, S. Zhou, Z. Zhang, X. Huang, H. Yong, S. Jing and C. Lai, Theranostics, 2016, 6, 752–761 CrossRef PubMed.
- J. Li, Y. Hu, J. Yang, P. Wei, W. Sun, M. Shen, G. Zhang and X. Shi, Biomaterials, 2015, 38, 10–21 CrossRef CAS PubMed.
- J. Li, L. Zheng, H. Cai, W. Sun, M. Shen, G. Zhang and X. Shi, Biomaterials, 2013, 34, 8382–8392 CrossRef CAS PubMed.
- S. Mansouri, Y. Cuie, F. Winnik, Q. Shi, P. Lavigne, M. Benderdour, E. Beaumont and J. C. Fernandes, Biomaterials, 2006, 27, 2060–2065 CrossRef CAS PubMed.
- X. Chen, Z. Zhao, M. Jiang, D. Que, S. Shi and N. Zheng, New J. Chem., 2013, 37, 1782–1788 RSC.
- B. Meesaragandla, D. Sarkar, V. N. K. B. Adusumalli and V. Mahalingam, New J. Chem., 2016, 40, 3080–3085 RSC.
- A. Manuel, C. Pierre, M. O. Farine and M. Serge, Lasers Surg. Med., 2008, 40, 332–341 CrossRef PubMed.
- J. Ann, F. Florian, K. Gesa, D. Phys, H. Stepp, R. Sroka, E. Rupert and W. Beyer, Lasers Surg. Med., 2013, 45, 225–234 CrossRef PubMed.
- C. Sun, R. Sze and M. Zhang, J. Biomed. Mater. Res., Part A, 2006, 78, 550–557 CrossRef PubMed.
- M. Ahir, S. Bhattacharya, S. Karmakar, A. Mukhopadhyay, S. Mukherjee, S. Ghosh, S. Chattopadhyay, P. Patra and A. Adhikary, Biomaterials, 2016, 76, 115–132 CrossRef CAS PubMed.
- P. Huang, L. Bao, C. Zhang, J. Lin, T. Luo, D. Yang, M. He, Z. Li, G. Gao and B. Gao, Biomaterials, 2011, 32, 9796–9809 CrossRef CAS PubMed.
- J. Cheng, G. Tan, W. Li, H. Zhang, X. Wu, Z. Wang and Y. Jin, New J. Chem., 2016, 40, 8522 RSC.
| This journal is © The Royal Society of Chemistry 2017 |

