 Open Access Article
Creative Commons Attribution 3.0 Unported Licence
HCl post-processing BiOBr photocatalyst: structure, morphology, and composition and their impacts to activity†
Min Hua,
Rui Lia,
Xiaochao Zhang *a,
Changming Zhanga,
Hui Zhang*b,
Caimei Fan*a and
Jesse Zhub
aCollege of Chemistry and Chemical Engineering, Taiyuan University of Technology, Taiyuan 030024, PR China. E-mail: zhangxiaochao@tyut.edu.cn; fancm@163.com; Fax: +86-351-6018554
bParticle Technology Research Centre, Department of Chemical and Biochemical Engineering, The University of Western Ontario, London, Ontario N6A 5B9, Canada. E-mail: hzhang1@uwo.ca
First published on 27th October 2017
Abstract
This work reports a systematic investigation on the structure, morphology, and composition, and their impacts on photocatalytic performance, for a HCl post-processing BiOBr photocatalyst. We dispersed BiOBr powders into different concentration HCl aqueous solutions to synthesize a series of samples at room temperature. With the HCl concentration increasing, SEM images revealed that as-prepared flower-like BiOBr microspheres transformed gradually into the interweaved nanosheets, and ultimately, obtaining the stacked nanosheet structures. The XRD, EDX, BET, UV-vis DRS and photocurrent data demonstrated that HCl post-processing had in-deep effects on the element composition, specific surface area, optical property and photoelectrochemical properties of samples. Moreover, the detailed formation mechanism and good correlations among their structure, composition, morphology, and enhanced activity have been established by degrading methyl orange (MO) dye molecules under simulated solar light. The HCl post-processing BiOBr samples exhibited better photocatalytic activity and stability than the pure BiOBr sample. Results indicate that there is particular emphasis placed on the roles of H+ and Cl− ions in the micro- and macro-performance improvements of BiOBr photocatalysts. Our findings should provide important knowledge for further understanding the roles of H+ and Cl− ions in such ‘like-BiOX’ layered-structure systems.
1. Introduction
Photocatalysis, as one of the most effective and promising methods for wastewater treatment and energy conversion, has garnered growing research interest.1,2 The main advantage of photocatalytic degradation in dye wastewater is that the non-polluting products are CO2, H2O and other inorganic constituents over solar energy and photocatalysts.3 To exploit efficient and eco-friendly photocatalysts, several studies have focused on the synthesis and research of visible-light-response semiconductor-based materials.4–6 Recently, bismuth oxyhalides (BiOX, X = Cl, Br, I), with alternative stacking of [Bi2O2]2+ slabs interleaved by double halogen atom slabs, have become prevalent research topics due to their desirable band gap energies, good optical properties, thermally stimulated conductivities, and excellent photocatalytic abilities.7–9 More importantly, there exists a formed internal static electric field between the positive [Bi2O2]2+ slabs and the negative halogen slabs facilitating the separation and transfer of photo-generated charge carriers, achieving their superior photocatalytic activities.10–12 However, the shortcoming of stacked [X–Bi–O–Bi–X] layers by small nonbonding (van der Waals) interaction along the c-axis will result in the sensitivity of solution acidity or alkalinity and the instability of internal structure.13,14Recent studies found that the acidity or alkalinity of the growth environment could affect the crystal facets, compositions, and morphologies of photocatalysts during the synthesis process.15–19 For instance, in the synthesis processes of BiOCl using a facile method, it is found that BiOCl, BiOCl/Bi2O2CO3 composites and Bi2O2CO3 could be successfully prepared by controlling the concentration of NaOH under the same conditions. The superiorities in the structure, morphology and electronic properties made BiOCl/Bi2O2CO3 composites possess the higher activity than individual BiOCl and Bi2O2CO3 for the degradation of MO under simulated sunlight irradiation.20 Chang et al. synthesized NaBiO3/BiOCl composite and BiOCl photocatalyst using a novel in situ formation approach by regulating the molar ratio of NaBiO3 and HCl aqueous solutions. The NaBiO3/BiOCl composite showed the higher photocatalytic activity of RhB than pure BiOCl under visible light irradiation because the efficient charge separation on the NaBiO3/BiOCl interface.21 What's more, Cao et al. developed a precipitation transformation method to prepare the microrod Bi5O7I by adding NaOH solution into anomalous smooth plate BiOI precursor suspension, and the higher CB and lower VB positions of Bi5O7I brought about the better photocatalytic activity than BiOI precursor for the degradation on RhB under visible light irradiation.22 Therefore, to regulate the acidity or alkalinity of the growth environment could not only affect the composition and structural morphology of photocatalyst, but also improve the photocatalytic performance.
Combined with above enlightenment and the intrinsic structural features of BiOX, we explored the effect of HCl post-processing on the compositions, structural morphologies and properties of BiOBr sample by regulating the concentration of HCl solution. The as-prepared samples were characterized by XRD, EDX, SEM, BET and UV-vis DRS. Besides, the photocatalytic activities were evaluated by degrading MO dye molecule under simulated solar light. The formation behaviours of BiOClxBr1−x solid solutions and BiOCl crystal, as well as their structures, morphologies, specific surface areas, photoelectrochemical properties, band gap energies, and photocatalytic activities were discussed. More importantly, NaCl solution was considered as a substitute of HCl solution under the same experiment conditions to further understand the role of H+ ions compared with HCl solution. We find that H+ ions can accelerate Br− ions to dissociate from BiOBr lattices. Finally, the possible formation and photocatalytic mechanisms of as-prepared samples are proposed and investigated. It is expected for us to provide the new significant research method for synthesizing a series of such Bi-based layer-structure photocatalytic materials.
2. Experimental
2.1 Raw materials and synthesis of samples
Bismuth nitrate pentahydrate (Bi(NO3)3·5H2O) and potassium bromide (KBr) were purchased from Tianjin Sinopharm Chemical Reagent (Co. Ltd.) and Tianjin Zhiyuan Reagent (Co. Ltd.) respectively. Ethylene glycol and Anhydrous ethanol were provided by Tianjin Kemiou Chemical Reagent (Co. Ltd.) and Tianjin Guangfu Chemical Reagent (Co. Ltd.), respectively. HCl was obtained from Tianjin Medical Company. All the reagents belong to the analytic purity. Deionized water was used throughout this work.In a typical procedure, 0.02 mol Bi(NO3)3·5H2O was dissolved in 80 mL EG solution at room temperature with continuous stirring until the solution became transparent. Subsequently, 0.02 mol KBr was poured into the previous solution for 1 h. After adding 40 mL H2O into the mixture solution for 4 h with continuous stirring, the white precipitates were filtrated and washed successively with deionized water and ethanol, then dried at 60 °C for 12 h. The obtained sample was denoted as BOB.
1.00 g BOB powders were dispersed in X mL (X = 0.25, 0.50, 0.75, 1.00, 1.25) HCl solutions with 40 mL H2O for 1 h at room temperature with continuous stirring. The white precipitates were collected, washed with deionized water and ethanol several times, then dried at 60 °C overnight. The as-prepared samples were obtained and denoted as BOB-HC1, BOB-HC2, BOB-HC3, BOB-HC4, and BOB-HC5.
2.2 Characterization
The crystal structures of as-prepared samples were measured by X-ray diffraction (XRD) (DX-2700 diffractometer, Japan) with Cu Kα radiation and a scanning rate of 8° min−1 in the range from 10° to 80°. The morphologies and chemical compositions were observed on a Nanosem 430 (FEI, America) field emission scanning electron microscopy at an operating voltage of 10 kV, with an energy dispersive X-ray (EDX) microanalysis system. The specific surface area and porous structures were determined by nitrogen adsorption and desorption and using the V-Sorb 4800P analyzer. The photocurrent was measured with a CHI660D electrochemistry workstation using a three-electrode system. The UV-vis diffuse reflectance spectra (DRS) were acquired on a UV-vis spectrophotometer (UV-3600, Shimadzu, Japan).2.3 Photocatalytic test
The photocatalytic activities of all the as-prepared samples were measured from degradation of MO dye under simulated solar light irradiation. Experiments were carried out in a 100 mL beaker at room temperature in air, 0.10 g sample was dispersed in 100 mL MO solution (10 mg L−1) and stirred magnetically for 20 min in the dark to reach adsorption–desorption equilibrium. The reactor was then irradiated by a 500 W Xe lamp as the simulated solar light source. During irradiation times, 3 mL of suspension was taken from the reaction cell at irradiation time intervals of 10 min. The concentration of MO solution was analyzed by a Varian Cary-50 UV-vis spectrophotometer. The degradation efficiency (D) of MO was calculated by the following formula:| D = (1 − ct/c0) × 100% |
3. Results and discussion
3.1 Structure and composition
To identify the influence of different concentration HCl solutions post-processing on the structure and composition of BiOBr photocatalyst, XRD measurement was performed, as shown in Fig. 1. It is found that the XRD patterns of all the as-prepared samples have the similar diffraction peaks, demonstrating that there exist the isostructural compounds and no separated phase. All the diffraction peaks of as-prepared BOB sample are readily indexed to tetragonal phase BiOBr (JCPDS card no. 78-0348).23 With the HCl concentration increasing, the main strong peaks corresponding to {001}, {002}, {101}, {112} crystal planes of BOB-HC1, BOB-HC2, BOB-HC3 and BOB-HC4 gradually shift to the larger angles compared with BOB sample, indicating the formation behaviour of solid solution.24–27 Besides, the XRD pattern of BOB-HC5 sample is indexed to tetragonal phase BiOCl (JCPDS card no. 06-0249),28 indicating the formation of BiOCl crystal. Therefore, with the HCl concentration increasing, more and more Cl− ions react with BiOBr, and BiOBr sample gradually transforms into BiOClxBr1−x solid solutions and ultimately turns into BiOCl. The results reveal that HCl post-processing plays a vital role in composition and structure changes of BiOBr.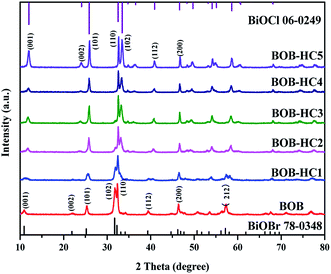 | ||
| Fig. 1 XRD patterns of as-prepared samples via different concentration HCl solutions post-processing BiOBr. | ||
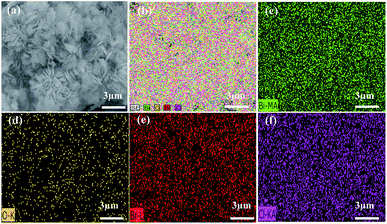
In order to further clarify the chemical composition of as-prepared samples, the typical EDX of BOB, BOB-HC2, BOB-HC3 and BOB-HC5 samples was carried out. As shown in Fig. S1,† the peaks near 1.50 keV and 2.65 keV correspond to the Br and Cl elements, respectively. With the HCl concentration increasing, the content of Br element gradually decreases and that of Cl element gradually increases. A detailed analysis of the element composition and distribution of BOB-HC3 sample by elemental mapping was shown in Fig. 2. It should be noted that Bi, O, Cl and Br elements revealed the uniform distribution feature, indicating the formation of BiOClxBr1−x solid solution rather than a heterostructure composite of BiOBr and BiOCl. The result is good agreement with XRD analysis, further confirming that HCl post-processing BiOBr should affect the composition and distribution of as-prepared samples.
3.2 Morphology and formation mechanism
Fig. 3 gives the SEM images of as-prepared BOB, BOB-HC2, BOB-HC3, and BOB-HC5 samples. The BOB sample presents the hierarchical flower-like microspheres assembled by nanosheets with a high yield and the approximated diameter of single BOB microsphere structure ranges from 0.8–1.0 μm (Fig. 3a and b). Compared with BOB sample, the morphologies of BOB-HC2 and BOB-HC3 samples have the notable variations. The flower-like microspheres are destroyed and the nanosheets loosely interweaved, leaving an obvious space between inter-sheet voids (Fig. 3c–f). For BOB-HC5 sample, we could hardly see the whole flower-like microspheres and many inhomogeneous nanoplates are closely stacked together (Fig. 3g and h). Thus, HCl post-processing BiOBr affects the structural morphologies of as-prepared samples.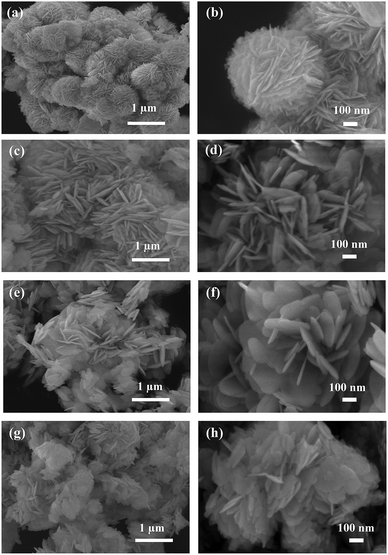 | ||
| Fig. 3 SEM images of (a and b) BOB, (c and d) BOB-HC2, (e and f) BOB-HC3, and (g and h) BOB-HC5 samples. | ||
The changes of structure, composition, and morphology could be described as a recrystallization process, as shown in Fig. 4. BiOBr photocatalyst synthesized by hydrolysis method is inclined to the flower-like microspheres because the viscosity of EG solvent and the minimization of total surface energy in Ostwald ripening process will lead to the growth of nanosheets in the direction of bending and formation of hierarchical flowerlike structures.29,30 When BiOBr powders are dispersed into different concentration HCl solutions, the BiOBr microspheres are destroyed quickly under the strong acid environment because the corrosive effects of H+ ions make Br− ions dissociate from BiOBr lattice, and the [Bi2O2]2+ ions and Br− ions dissolve into solution, which will be further discussed in later section about the effect of H+ ions of HCl. Moreover, the solubility product constant (Ksp) of BiOCl (1.8 × 10⁻³¹, 298.15 K) is much smaller than that of BiOBr (3.0 × 10⁻⁷, 298.15 K),31,32 so that BiOBr crystal could adopt a thermodynamically favored direction to transform into BiOCl crystal. Thus, [Bi2O2]2+ ions would immediately react with Cl− and Br− ions to form BiOClxBr1−x solid solution. With the HCl concentration increasing in the reaction process, more and more Cl− ions react with [Bi2O2]2+ ions, resulting in the formation of BiOCl crystal (in Fig. 4). As can be seen from the SEM images of as-prepared samples, the flower-like microspheres of BiOBr transform gradually into the interweaved nanosheets, and ultimately turn into the closely stacked nanosheets to decrease the total surface energy of crystal. What's more, the morphologies of BiOClxBr1−x solid solutions and BiOCl crystal were affected by the small viscosity of water solvent and nanosheets anisotropic growth.33
3.3 Surface area analysis
The variation in the structural morphology of photocatalyst could bring about the different specific surface areas and porous structures, which will play an important role in the photocatalytic performance. The surface areas and porous structures of samples were obtained based on nitrogen adsorption and desorption (in Fig. S2†). The isotherms of BOB, BOB-HC2, BOB-HC3 and BOB-HC5 samples corresponded to type IV with H3 hysteresis loop, indicating their mesoporous materials.34,35 Besides, the pore size distribution of sample was measured using the Barrett–Joyner–Halenda (BJH) method from nitrogen adsorption–desorption isotherm. The formation of mesopores could be explained to the interspaces caused from intercrossed nanosheets. The BET surface areas (in Table 1) of as-prepared samples increase gradually, and reach the maximum of BOB-HC2 sample, then decrease with the HCl concentration increasing. The change trend is in good agreement with the morphology variation feature, where the flower-like microspheres of samples become interweaved nanosheets gradually, and ultimately turn into closely stacked nanosheets with the HCl concentration increasing. Thus, the composition changes of as-prepared samples will lead to the various morphologies through regulating the concentration HCl solutions, which further affects their surface areas or pore structures. However, the variations in specific surface areas and porous structures were too small to affect the adsorption for MO, thus the change of BET surface areas was not the key factor for enhanced photocatalytic performance.| Samples | BOB | BOB-HC1 | BOB-HC2 | BOB-HC3 | BOB-HC4 | BOB-HC5 |
|---|---|---|---|---|---|---|
| SBET (m2 g−1) | 20.123 | 21.984 | 24.092 | 17.669 | 15.016 | 14.119 |
| Pore size (nm) | 20.563 | 33.584 | 27.109 | 19.887 | 25.870 | 27.451 |
3.4 Optical absorption property
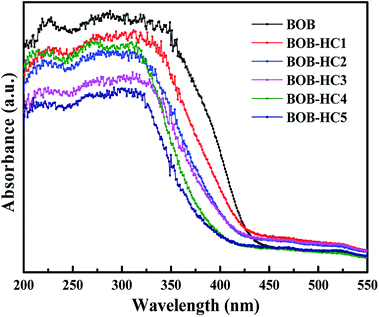
The UV-vis diffuse reflectance spectra (in Fig. 5) of all as-prepared samples were provided for further verifying the experimental results that BiOBr samples could turn into the BiOClxBr1−x solid solutions and BiOCl samples via different concentration HCl solutions post-processing BiOBr samples on the basis of the different optical absorption properties. With the HCl concentration increasing, it is obviously found that the optical absorption edges of as-prepared samples shift monotonically to the shorter wavelength, indicating that there is indeed the formation of BiOClxBr1−x solid solution.36 Moreover, the band gap energy (Eg), conduction band (CB) and valence band (VB) positions of as-prepared samples can be calculated from diffused reflectance spectra to understand the changes in band structures of as-prepared samples caused by their different compositions. The band gap (Eg) of each sample is estimated using equation Eg = 1239/λg,3 where λg is the band gap wavelength. Based on DRS results, the estimated band gaps energy (in Table 2) ranges from 2.79 to 3.14 eV with the HCl concentration increasing.| Samples | χ (eV) | Eg (eV) | ECB (V) | EVB (V) |
|---|---|---|---|---|
| BOB | 6.17 | 2.79 | 0.28 | 3.07 |
| BOB-HC1 | 6.21 | 2.85 | 0.29 | 3.14 |
| BOB-HC2 | 6.25 | 2.92 | 0.29 | 3.21 |
| BOB-HC3 | 6.28 | 2.97 | 0.30 | 3.27 |
| BOB-HC4 | 6.32 | 3.09 | 0.30 | 3.39 |
| BOB-HC5 | 6.36 | 3.14 | 0.30 | 3.43 |
As well-known from the theory calculations, BiOBr, BiOClxBr1−x solid solutions, and BiOCl with similar structures have different electronic properties due to the existence of difference halogen atoms. The conduction band minimum (CBM) of BiOClxBr1−x compound is composed of Bi 6p states and the valence band maximum (VBM) consists of Bi 6s, O 2p, Cl 3p and Br 4p states.37 The redox abilities of compounds depend on the potential of CB and VB. The XRD, EDX and DRS data indicate that HCl post-processing has an important effect on the compositions of BiOBr samples, so that BOB-HC1, BOB-HC2, BOB-HC3, BOB-HC4 and BOB-HC5 samples will exhibit the different CB and VB edge positions and photocatalytic activities compared with BOB samples. The VB and CB edge positions of as-prepared samples can be calculated through the following equations:38
| ECB = χ − EC − 0.5Eg |
| EVB = ECB + Eg |
3.5 Photoelectrochemical properties
As we widely known that the separation efficiency of electrons and holes is a key factor for photocatalytic reaction. Fig. 6 shows the transient photocurrent responses of BOB, BOB-HC3 and BOB-HC5 samples under intermittent Xe lamp irradiation. In general, the higher photocurrent intensity means the better separation efficiency of electrons and holes.39 As can be seen, the photocurrent density is low in dark, then the photocurrent density rapidly increased after that the lamp is turned on. Compared with BOB sample, the BOB-HC3 solid solution exhibits a noticeable enhanced photocurrent density, which is about two times than that of BOB. While BOB-HC5 sample shows the weaker photocurrent density than BOB. Thus, the most enhanced photocurrent density of BOB-HC3 solid solution reveals the greatest inhabitation of the recombination of photoinduced electrons and holes. Moreover, the results indicate HCl post-processing BiOBr should play a vital role in the enhanced separation efficiency of photoinduced electrons and holes.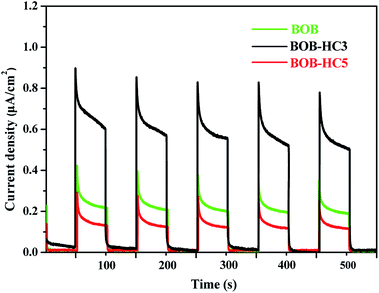 | ||
| Fig. 6 Photocurrent responses of BOB, BOB-HC3 and BOB-HC5 samples measured in 1 M Na2SO4 solutions under Xe-lamp irradiation. | ||
3.6 Photocatalytic activity and stability
The photocatalytic activities of as-prepared samples were evaluated by the degradation of MO dye under simulated solar light irradiation, as shown in Fig. 7a. It can be clearly found that BOB and BOB-HC5 samples show the poor photocatalytic activities for the degradation on MO with the percentages of 63.24% and 43.49% after 40 min, respectively. Whereas, the BOB-HC1, BOB-HC2, BOB-HC3 and BOB-HC4 solid solutions exhibit the better photocatalytic activities than BOB and BOB-HC5 samples. Among them, the BOB-HC3 sample displays the best activity and the maximum removal efficiency of 93.9% for 30 min. With the time increasing from 30 min to 40 min, the photocatalytic MO degradation efficiency increases up to 98.77%. Moreover, the recycling experiments (in Fig. 7b) indicate that the removal efficiency of BOB-HC3 sample still maintains about 93.50% after four-time recycling runs. Moreover, compared with fresh BOB-HC3 sample (in Fig. S3a†), the structural morphology of BOB-HC3 sample after recycle has no obvious change (in Fig. S3b†). The results reveal that the BOB-HC3 sample has highly stable photocatalytic performance.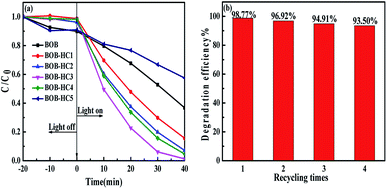 | ||
| Fig. 7 (a) Photocatalytic degradation efficiencies of MO under simulated solar light irradiation with as-prepared samples, (b) recycling test of photocatalytic degradation over BOB-HC3 sample. | ||
3.7 Active species and photocatalytic mechanism of BOB-HC3 sample
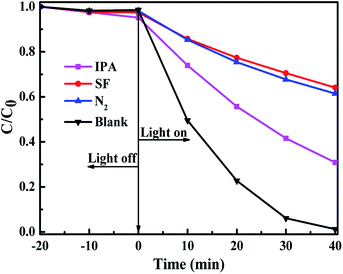
Fig. 8 displays the effect of active species scavengers on the photocatalytic degradation of MO over BOB-HC3 sample. The scavengers of isopropanol (IPA) and sodium formate (SF) are added to the reaction system to examine the roles of reactive species hydroxyl radicals (˙OH) and holes (h+), respectively. The addition of IPA has a slight effect on the photocatalytic degradation MO efficiency, implying that ˙OH should be not the key active oxidative species. However, the addition of SF causes an obvious decrease of MO degradation efficiency, confirming the main active species of h+. To understand the role of superoxide radical (˙O2−), N2 purging experiment was performed, and the photocatalytic degradation efficiency on MO is suppressed. Hence, ˙O2− plays a significant role in such photocatalytic process. Therefore, h+ and ˙O2− should be the main active species for photocatalytic degradation on MO over BOB-HC3 catalyst, achieving the efficient separation of photo-induced electron–hole pairs.The higher photocatalytic activities of BiOClxBr1−x solid solutions than BiOBr and BiOCl samples on the degradation of MO dye under simulated solar light irradiation are discussed and summarized, as followings: (1) the as-prepared samples with different compositions have different Eg values, VB and CB edge positions (as seen in Scheme 1). The Eg values increased with the HCl content increasing, confirming the lower utilization efficiency of energy.40 The trapping experiments results show that the photoinduced electrons from the higher conduction band could be captured by surface-absorbed oxygen to form superoxide radical (˙O2−), which would contribute to achieve the improvement of photocatalytic activity. What's more, there is no any obvious variation of CB edge positions, indicating the existence of similar reducing ability. Furthermore, the more positive VB edge potentials (as seen in Table 2) of as-treated BiOBr with a higher concentration of HCl demonstrates the stronger oxidation ability. Thus, the holes (h+) in VB of photocatalyst could react with OH−/H2O to form ˙OH or directly react with organic molecules to resolve into the smaller organic molecules.41 The competition between the utilization efficiency of energy and the oxidation ability for as-prepared samples may be a key factor for enhanced photocatalytic activity of BiOClxBr1−x solid solution. (2) The analysis results of transient photocurrent responses of as-prepared samples reveal that the photocurrent density of BOB-HC3 solid solution was about two times than BOB, confirming the enhanced separation efficiencies of photogenerated carriers through proper concentration HCl solution post-processing BiOBr. Therefore, mutual competition between these factors may achieve the highest photocatalytic activities of BOB-HC3 among the as-prepared samples.
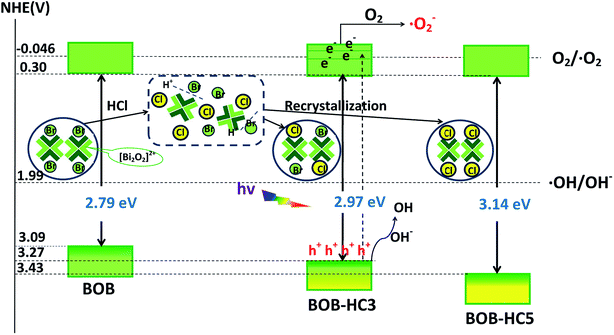 | ||
| Scheme 1 The possible formation processes of BOB-HC3 and BOB-HC5 samples, and photocatalytic mechanism of BOB-HC3. | ||
3.8 Effect of H+ ions on the formation behaviors of as-prepared samples
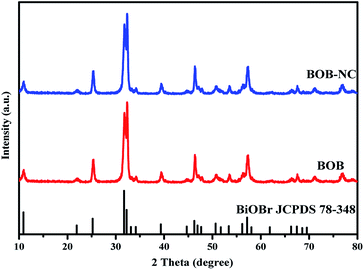
To further confirm the effect of H+ ions of HCl solution on the composition and morphology of BiOBr samples in the reaction system, 0.88 g NaCl solution is used to replace 1.25 mL HCl solution under the same conditions. The precipitate is collected and regarded as BOB-NC. Finally, the BOB-NC sample is characterized by XRD and SEM. All the diffraction peaks of BOB-NC sample can be indexed to tetragonal phase BiOBr (JCPDS card no. 78-0348), and the intensity of diffraction peaks of BOB-NC sample is almost the same as that of BOB sample (in Fig. 9). Compared with SEM images of BOB-NC (in Fig. S4a†) and BOB samples (in Fig. S4b†), the morphologies of BOB-NC sample still maintain the structure of flower-like microspheres, and the average diameter of single microsphere is about 0.8–1.0 μm. The results indicate that NaCl post-processing BiOBr has no significant influence on the structure, composition and morphology of BiOBr sample. However, HCl post-processing plays an in-deep role in the element composition, morphology and photocatalytic activity on BiOBr sample. Obviously, the existence of H+ ions in HCl solution could lead to the effective separation of Br− ions and [Bi2O2]2+ ions, helping to achieve the subsequent reactions among Cl− ions, Br− ions and [Bi2O2]2+ ions.4. Conclusions
In summary, we dispersed BiOBr powders into different concentration HCl solutions to synthesize BiOClxBr1−x solid solution and BiOCl sample. Compared with pure BiOBr, as-prepared BiOClxBr1−x solid solution and BiOCl sample possess the similar structures and different compositions. The changes of structure and composition could induce the variations of the morphology, surface area, band gaps energy, and other properties, further affect the photocatalytic performance. The BOB-HC3 solid solution displays the highest photocatalytic removal efficiency of MO dye that reaches 98.77% after 40 min under simulated solar light, higher than 35.53% over pure BiOBr sample. After the 4th recycling test, the photocatalytic removal efficiency of MO dye still maintains about 93.50%, indicating the more favorable photocatalytic stability. The enhanced photocatalytic performance of BOB-HC3 sample is closely related to the suitable band-gap structure and better separation efficiency of electrons and holes. Moreover, the corrosive effect of H+ ions of HCl ruptures the original layered structure of BiOBr, resulting in that Cl− ions react with [Bi2O2]2+ and Br− ions to form the BiOClxBr1−x solid solution. Our findings should provide a new idea and method to synthesize efficient photocatalysts based on the sensitivity of BiOBr to the acidity of growth environment and the solubility product constant (Ksp) of other photocatalysts with such BiOBr-layer structures.Conflicts of interest
There are no conflicts to declare.Acknowledgements
This work was financially supported by the National Natural Science Foundation of China (No. 21506144, 21176168, 21706179), Natural Science Foundation of Shanxi Province for Young Scientists (201701D221037), the Science and Technology Innovation Project of Shanxi Provincial Higher Education Institutions, China.Notes and references
- S. Malato, P. Fernández-Ibáñez, M. I. Maldonado, J. Blanco and W. Gernjak, Catal. Today, 2009, 147, 1–59 CrossRef CAS.
- V. P. Indrakanti, J. D. Kubicki and H. H. Schobert, Energy Environ. Sci., 2009, 2, 745–758 CAS.
- S. Shenawi-Khalil, V. Uvarov, S. Fronton, I. Popov and Y. Sasson, Appl. Catal., B, 2012, 117, 148–155 CrossRef.
- H. L. Lin, X. Li, J. Cao, S. F. Chen and Y. Chen, Catal. Commun., 2014, 49, 87–91 CrossRef CAS.
- Y. Liu, X. Z. Yuan, H. Wang, X. H. Chen, S. S. Gu, Q. Jiang, Z. B. Wu, L. B. Jiang and G. M. Zeng, RSC Adv., 2015, 5, 33696–33704 RSC.
- W. N. Wang, W. J. An, B. Ramalingam, S. Mukherjee, D. M. Niedzwiedzki, S. Gangopadhyay and P. Biswas, J. Am. Chem. Soc., 2012, 134, 11276–11281 CrossRef CAS PubMed.
- H. J. Zhang, L. Liu and Z. Zhou, RSC Adv., 2012, 2, 9224–9229 RSC.
- X. Xiao, C. Liu, R. P. Hu, X. X. Zuo, J. M. Nan, L. S. Li and L. S. Wang, J. Mater. Chem., 2012, 22, 22840–22843 RSC.
- H. B. Yin, X. F. Chen, R. J. Hou, H. J. Zhu, S. Q. Li, Y. N. Huo and H. X. Li, ACS Appl. Mater. Interfaces, 2015, 7, 20076–20082 CAS.
- H. F. Cheng, B. B. Huang and Y. Dai, Nanoscale, 2014, 6, 2009–2026 RSC.
- Q. Q. Du, W. P. Wang, Y. Z. Wu, G. Zhao, F. K. Ma and X. P. Hao, RSC Adv., 2015, 5, 31057–31063 RSC.
- Y. Y. Li, H. C. Yao, J. S. Wang, N. Wang and Z. J. Li, Mater. Res. Bull., 2011, 46, 292–296 CrossRef CAS.
- G. Chen, G. L. Fang and G. D. Tang, Mater. Res. Bull., 2013, 48, 1256–1261 CrossRef CAS.
- J. Li, Y. Yu and L. Z. Zhang, Nanoscale, 2014, 6, 8473–8488 RSC.
- J. Jiang, K. Zhao, X. Y. Xiao and L. Z. Zhang, J. Am. Chem. Soc., 2012, 134, 4473–4476 CrossRef CAS PubMed.
- C. S. Lim, J. H. Ryu, D. H. Kim, S. Y. Cho and W. C. Oh, J. Ceram. Process Res., 2010, 11, 736–741 Search PubMed.
- Y. Lu, Y. Zhao, J. Z. Zhao, Y. Song, Z. F. Huang, F. F. Gao, N. Li and Y. W. Li, Cryst. Growth Des., 2015, 15, 1031–1042 CAS.
- J. L. Wang, Y. Yu and L. Zhang, Appl. Catal., B, 2013, 136, 112–121 CrossRef.
- H. P. Li, T. X. Hu, J. Q. Liu, S. Song, N. Du, R. J. Zhang and W. G. Hou, Appl. Catal., B, 2016, 182, 431–438 CrossRef CAS.
- X. C. Zhang, T. Y. Guo, X. W. Wang, Y. W. Wang, C. M. Fan and H. Zhang, Appl. Catal., B, 2014, 150, 486–495 CrossRef.
- X. F. Chang, G. Yu, J. Huang, Z. Li, S. F. Zhu, P. F. Yu, C. Cheng, S. B. Deng and G. B. Ji, Catal. Today, 2010, 153, 193–199 CrossRef CAS.
- J. Cao, X. Li, H. L. Lin, B. V. Xu, B. D. Luo and S. F. Chen, Mater. Lett., 2012, 76, 181–183 CrossRef CAS.
- N. N. Guo, Y. L. Cao, Y. L. Rong and D. Z. Jia, RSC Adv., 2016, 6, 106046–106053 RSC.
- X. Zhang, L. W. Wang, C. Y. Wang, W. K. Wang, Y. L. Chen, Y. X. Huang, W. W. Li, Y. J. Feng and H. Q. Yu, Chem.–Eur. J., 2015, 21, 11872–11877 CrossRef CAS PubMed.
- Y. Y. Liu, W. J. Son, J. B. Lu, B. B. Huang, Y. Dai and M. H. Whangbo, Chem.–Eur. J., 2011, 17, 9342–9349 CrossRef CAS PubMed.
- H. Gnayem and Y. Sasson, ACS Catal., 2013, 3, 186–191 CrossRef CAS.
- K. X. Ren, J. Liu, J. Liang, K. Zhang, X. Zheng, H. D. Luo, Y. B. Huang, P. J. Liu and X. B. Yu, Dalton Trans., 2013, 42, 9706–9712 RSC.
- X. N. Wang, H. C. Chen, H. J. Li, G. Mailhot and W. B. Dong, J. Colloid Interface Sci., 2016, 478, 1–10 CrossRef CAS PubMed.
- Z. S. Liu, B. T. Wu, D. H. Xiang and Y. B. Zhu, Mater. Res. Bull., 2012, 47, 3753–3757 CrossRef CAS.
- J. Zhang, F. J. Shi, J. Lin, D. F. Chen, J. M. Gao, Z. X. Huang, X. X. Ding and C. C. Tang, Chem. Mater., 2008, 20, 2937–2941 CrossRef CAS.
- L. W. Shan, G. L. Wang, L. Z. Liu and Z. Wu, J. Mol. Catal. A: Chem., 2015, 406, 145–151 CrossRef CAS.
- C. H. Deng and H. M. Guan, Mater. Lett., 2013, 107, 119–122 CrossRef CAS.
- R. Li, X. Y. Gao, C. M. Fan, X. C. Zhang, Y. W. Wang and Y. F. Wang, Appl. Surf. Sci., 2015, 355, 1075–1082 CrossRef CAS.
- Y. H. Ao, H. Tang, P. F. Wang, C. Wang, J. Hou and J. Qian, Composites, Part B, 2014, 59, 96–100 CrossRef CAS.
- X. Y. Gao, X. C. Zhang, Y. W. Wang, S. Q. Peng, B. Yue and C. M. Fan, Chem. Eng. J., 2015, 263, 419–426 CrossRef CAS.
- S. Shenawi-Khalil, V. Uvarov, Y. Kritsman, E. Menes, I. Popov and Y. Sasson, Catal. Commun., 2011, 12, 1136–1141 CrossRef CAS.
- H. J. Zhang, L. Liu and Z. Zhou, Phys. Chem. Chem. Phys., 2012, 14, 1286–1292 RSC.
- C. Q. Wen, Z. Y. Fan and X. C. Song, Ceram. Int., 2016, 42, 14533–14542 CrossRef.
- J. Xie, Y. L. Cao, D. Z. Jia and Y. Z. Li, J. Colloid Interface Sci., 2017, 503, 115–123 CrossRef CAS PubMed.
- X. M. Mao and C. M. Fan, Int. J. Miner., Metall. Mater., 2013, 20, 1089–1096 CrossRef CAS.
- X. C. Zhang, B. Q. Lu, R. Li, X. L. Li, X. Y. Gao and C. M. Fan, Sep. Purif. Technol., 2015, 154, 68–75 CrossRef CAS.
Footnote |
| † Electronic supplementary information (ESI) available. See DOI: 10.1039/c7ra08871j |
| This journal is © The Royal Society of Chemistry 2017 |

