 Open Access Article
Creative Commons Attribution 3.0 Unported Licence
Mesoporous silica-based carbon dot–carbon nitride composite for efficient photocatalysis†
Yulan Penga,
Fenghui Liua,
Lingzhi Wang a,
Yongdi Liub,
Juying Lei
 *b and
Jinlong Zhang
 *a
*a
aKey Lab for Advanced Materials and Institute of Fine Chemicals, School of Chemistry and Molecular Engineering, East China University of Science and Technology, 130 Meilong Road, Shanghai 200237, P. R. China. E-mail: jlzhang@ecust.edu.cn
bState Environmental Protection Key Laboratory of Environmental Risk Assessment and Control on Chemical Process, School of Resources and Environmental Engineering, East China University of Science and Technology, 130 Meilong Road, Shanghai 200237, P. R. China. E-mail: leijuying@ecust.edu.cn
First published on 14th November 2017
Abstract
In this work, graphene carbon nitride (g-C3N4, CN) is loaded into the carbon dots (CD) modified SBA-15 mesoporous silica by a precursor impregnation method. The obtained samples are characterized by various spectroscopy techniques and applied in the visible-light-driven photocatalytic degradation of phenol. The photocatalytic activity of the obtained SBA15–CN is 2 times as high as that of pure g-C3N4 due to the high dispersion of g-C3N4 into SBA-15 channels. For CD-SBA15–CN, the visible light driven photocatalytic activity is further increased, which is 4 times as high as that of pure g-C3N4. This promotion can be attributed to carbon dots with the ability to transfer photogenerated electrons as well as the compound catalyst having a bigger surface area and pore volume. When the weight ratio of CD-SBA15/g-C3N4 was 1![[thin space (1/6-em)]](https://www.rsc.org/images/entities/char_2009.gif) :
:![[thin space (1/6-em)]](https://www.rsc.org/images/entities/char_2009.gif) 6, the catalyst (1
6, the catalyst (1![[thin space (1/6-em)]](https://www.rsc.org/images/entities/char_2009.gif) :
:![[thin space (1/6-em)]](https://www.rsc.org/images/entities/char_2009.gif) 6 CD-SBA15–CN) performed best. The 1
6 CD-SBA15–CN) performed best. The 1![[thin space (1/6-em)]](https://www.rsc.org/images/entities/char_2009.gif) :
:![[thin space (1/6-em)]](https://www.rsc.org/images/entities/char_2009.gif) 6 CD-SBA15–CN photocatalyst had enhanced visible absorption and the interaction between CDs and g-C3N4 can further promote the separation of photo-generated electrons and holes, achieving the highest photocatalytic activity of CD-SBA15–CN compared to SBA15–CN and g-C3N4.
6 CD-SBA15–CN photocatalyst had enhanced visible absorption and the interaction between CDs and g-C3N4 can further promote the separation of photo-generated electrons and holes, achieving the highest photocatalytic activity of CD-SBA15–CN compared to SBA15–CN and g-C3N4.
1. Introduction
The degradation of organic pollutants in water and the production of H2 or O2 from water by using semiconductor-based photocatalysts have attracted great attention because of the global environment pollution and energy crisis.1,2 To date, various efficient photocatalysts have been developed, such as TiO2,3,4 CdS,5,6 and so on. In particular, g-C3N4 as a novel organic semiconductor with a special layered structure, has been considered to be a fascinating candidate for photocatalysis due to its unique properties.7,8 In 2009, Wang et al. first reported the excellent photocatalytic ability of g-C3N4 for hydrogen production.9 Since then, the photocatalytic performance of g-C3N4 for degradation of organic pollutants in wastewater has also been investigated.10,11However, the photocatalytic efficiency of g-C3N4 is relatively low, mainly due to the small surface area, quick recombination of photo-generated electron–hole pairs and limited visible light utilization.12 In order to address these problems, a variety of methods have been developed such as morphology control,13,14 element doping,15 coupling with other semiconductor,16,17 and modification with carbon materials.18 Zhang et al. reported the carbon dots decorated g-C3N4 nanosheet and demonstrated that the composite catalyst had superior visible light photocatalytic activity as compared to pure g-C3N4.18
Meanwhile, mesoporous silica with high specific surface area can act as good host for semiconductor photocatalysts, leading to greatly improved photocatalytic performance by reducing the recombination of photo-generated electron–hole pairs in these semiconductors. Guo et al. discovered a CdS@Ti-MCM-41 composite with much higher visible light photocatalytic activity than the bulk CdS for hydrogen production from water.19 Li et al. dispersed nanophase g-C3N4 into SBA-15 by a two-step vapor-deposition method. The obtained materials are active catalysts for CO2 activation and conversion.20 In addition, in our previous work, mesoporous silica materials embedded with amide-containing carbon dots (CD) have been developed.21 Inspired by these works, we envision that CD modified SBA15-supported g-C3N4 materials will demonstrate higher photocatalytic performance than g-C3N4.
Herein, we report a facial route for the fabrication of CD-SBA15-supported g-C3N4 materials. When g-C3N4 is loaded into SBA-15, obtained SBA15–CN shows better visible-light photocatalytic activity than pure g-C3N4. In addition, the photocatalytic efficiency for degradation of phenol is further improved for CD-SBA15–CN. The mechanism for the enhanced photocatalytic activity has also been discussed.
2. Experimental
2.1 Chemicals
Citric acid (CA), hexane, hydrochloric acid, tetraethoxysilane, melamine, phenol are all obtained from Shanghai Ling Feng Chemical Reagent Co, Ltd. Pluronic P123, N-(β-aminoethyl)-γ-aminopropylmethyldimethoxysilane (AEAPMS) are purchased from Aldrich reagent plant. The reagents are all used as received from the suppliers without further purification. And deionized water is used for all solution experiments.2.2 Preparation of silylated carbon dots (Si-CDs)
Si-CDs are prepared through a one-step synthetic procedure according to a method reported previously.22–25 The reaction proceeds through pyrolysis of anhydrous CA. 10 mL of AEAPMS is put in a three-necked flask with 50 mL of volume and the temperature is raised to 240 °C with stirring under N2 atmosphere. Then 0.5 g of CA is quickly added into the flask. The heating is stopped after 1 minute reaction. When the reaction mixture is cooled to room temperature, it is washed twice using hexane, after which the oily liquid product is obtained. Then the product is sealed with hexane and stored for use in refrigerator.2.3 Preparation of the CD incorporated SBA-15 mesoporous silica (CD-SBA15)
SBA-15 is prepared with Pluronic P123 as template via a method similar to previous report.26 Then, an amount of CDs and SBA-15 are refluxed in dehydrated toluene (250 mL) at 110 °C for 24 h under N2 flow. The obtained products are washed for three times with deionized water and dried over night at 60 °C. The resultant sample is denoted as CD-SBA15.2.4 Preparation of g-C3N4 and CD-SBA15–CN
Pure g-C3N4 is prepared by the pyrolysis method. 4 g of melamine are put into a porcelain ark, heated to 520 °C in argon gas with a heating rate of 2 °C min−1 and then maintained at 520 °C for 4 h.The CD-SBA15–CN photocatalysts are prepared by calcining mixed CD-SBA15 and melamine in argon gas. In details, desired amounts of CD-SBA15 and melamine are put into 200 mL of deionized water at 90 °C and vigorously stirred for 2 h. Then the temperature is raised to 100 °C for evaporating the water. The obtained powder mixture of CD-SBA15 and melamine is collected and heated to 520 °C in argon gas with a heating rate of 2 °C min−1 and then maintained at 520 °C for 4 h to get the final product. By this method, samples using mass ratio of CD-SBA15 to melamine of 1![[thin space (1/6-em)]](https://www.rsc.org/images/entities/char_2009.gif) :
:![[thin space (1/6-em)]](https://www.rsc.org/images/entities/char_2009.gif) 1, 1
1, 1![[thin space (1/6-em)]](https://www.rsc.org/images/entities/char_2009.gif) :
:![[thin space (1/6-em)]](https://www.rsc.org/images/entities/char_2009.gif) 2, 1
2, 1![[thin space (1/6-em)]](https://www.rsc.org/images/entities/char_2009.gif) :
:![[thin space (1/6-em)]](https://www.rsc.org/images/entities/char_2009.gif) 4, 1
4, 1![[thin space (1/6-em)]](https://www.rsc.org/images/entities/char_2009.gif) :
:![[thin space (1/6-em)]](https://www.rsc.org/images/entities/char_2009.gif) 6 and 1
6 and 1![[thin space (1/6-em)]](https://www.rsc.org/images/entities/char_2009.gif) :
:![[thin space (1/6-em)]](https://www.rsc.org/images/entities/char_2009.gif) 8 are prepared, and denoted as 1
8 are prepared, and denoted as 1![[thin space (1/6-em)]](https://www.rsc.org/images/entities/char_2009.gif) :
:![[thin space (1/6-em)]](https://www.rsc.org/images/entities/char_2009.gif) x CD-SBA15–CN (x = 2, 4, 6, 8), respectively. The reference sample of SBA15–CN is prepared by the same method using SBA-15 instead of CD-SBA-15 and the mass ratio of SBA15 to melamine is 1
x CD-SBA15–CN (x = 2, 4, 6, 8), respectively. The reference sample of SBA15–CN is prepared by the same method using SBA-15 instead of CD-SBA-15 and the mass ratio of SBA15 to melamine is 1![[thin space (1/6-em)]](https://www.rsc.org/images/entities/char_2009.gif) :
:![[thin space (1/6-em)]](https://www.rsc.org/images/entities/char_2009.gif) 6.
6.
2.5 Characterizations
The morphology of the obtained CD-SBA15–CN series samples are observed by transmission electron microscopy (TEM, JEM2000EX). The crystal structure of the samples are characterized by powder X-ray diffraction (XRD), which are recorded on a Rigaku D/MAX-2550 diffract meter using Cu Kα radiation of wavelength 1.5406 Å, typically running at a voltage of 40 kV and current of 100 mA. UV-visible absorbance spectra are achieved for the dry-pressed disk samples using a Scan UV-visible spectrophotometer (SHIMADZU, uv-2450), and using BaSO4 as a reflectance sample. BET surface area measurements are carried out by N2 adsorption at 77 K using an ASAP2020 instrument. By utilizing the Barrett–Joyner–Halenda (BJH) model, the pore volumes and pore size distributions are got from the adsorption branches of isotherms. X-Ray photoelectron spectroscopy (XPS) studies are taken by a Perkin-Elmer PHI 5000CESCA system with Al Kα radiation operated at 250 W. FTIR of the samples are recorded in transmission mode from KBr pellets at room temperature on a Bruker Tensor spectrometer with a resolution of 4 cm−1, using 32 scans per spectrum in the region of 400–4000 cm−1. The mass ratio of every sample to KBr is constant at 1![[thin space (1/6-em)]](https://www.rsc.org/images/entities/char_2009.gif) :
:![[thin space (1/6-em)]](https://www.rsc.org/images/entities/char_2009.gif) 200. TG measurements of the catalysts are conducted on a Netzsch TG 209 F3 apparatus. The samples are placed in α-Al2O3 crucibles and heat in flowing argon gas (20 mL min−1) from room temperature to 800 °C at a rate of 10 °C min−1. The analysis of photoluminescence spectra (PL) and time resolved PL decay spectra is carried out at room temperature using a PTI QM-4 fluorescence spectrophotometer. Electrochemical Impedance Spectroscopy (EIS) are carried on the classical three-electrode system, using Zahner electrochemical station to test the electrochemical property of the samples. The supporting electrolyte is the mixed solution of 25 mmol L−1 K3Fe(CN)6 and K4Fe(CN)3 and 0.1 mol L−1 KCl. The counter, reference and working electrode are Pt electrode, saturated calomel electrode (SCE) and FTO glass coated with thin film sample, respectively. The electrode potential is 0.2 V versus SCE. The frequency range is from 0.1 to 106 Hz.
200. TG measurements of the catalysts are conducted on a Netzsch TG 209 F3 apparatus. The samples are placed in α-Al2O3 crucibles and heat in flowing argon gas (20 mL min−1) from room temperature to 800 °C at a rate of 10 °C min−1. The analysis of photoluminescence spectra (PL) and time resolved PL decay spectra is carried out at room temperature using a PTI QM-4 fluorescence spectrophotometer. Electrochemical Impedance Spectroscopy (EIS) are carried on the classical three-electrode system, using Zahner electrochemical station to test the electrochemical property of the samples. The supporting electrolyte is the mixed solution of 25 mmol L−1 K3Fe(CN)6 and K4Fe(CN)3 and 0.1 mol L−1 KCl. The counter, reference and working electrode are Pt electrode, saturated calomel electrode (SCE) and FTO glass coated with thin film sample, respectively. The electrode potential is 0.2 V versus SCE. The frequency range is from 0.1 to 106 Hz.
2.6 Photocatalytic activity test
Photodegradation of a phenol solution (10 mg L−1) is performed to evaluate the photocatalytic performance of the synthesized catalysts. The catalyst (50 mg) is added into the phenol solution (50 mL). Prior to irradiation, the suspension has a dark adsorption for half an hour. Then it was irradiated by a 300 W Xe lamp with a 420 nm cut off filter. At given time intervals, aliquots of the irradiated suspension are collected, centrifuged and analyzed by a HPLC system. In details, the aliquots were analyzed using “SHIMADZU LC-20A” which set with a two-channel UV-vis light absorption detector set at 270 nm absorbance for phenol detection. A Inertsil ODS-3 4.6 mm × 150 mm × 5 μm C18 column was used, injected volume 10 μL, column temperature of 40 °C and a flow of mobile phase acetonitrile: water (20![[thin space (1/6-em)]](https://www.rsc.org/images/entities/char_2009.gif) :
:![[thin space (1/6-em)]](https://www.rsc.org/images/entities/char_2009.gif) 80, v/v) at a flow rate of 1.0 mL min−1.
80, v/v) at a flow rate of 1.0 mL min−1.
3. Results and discussion
3.1 Characterization results
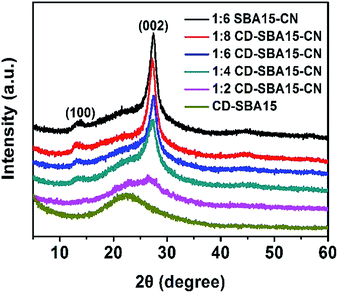
![[thin space (1/6-em)]](https://www.rsc.org/images/entities/char_2009.gif) :
:![[thin space (1/6-em)]](https://www.rsc.org/images/entities/char_2009.gif) 6 SBA15–CN and CD-SBA15–CN photocatalysts. As can be seen from the figure, a broad peak at 22° which is attributed to amorphous silica is shown.27 Compare with the diffraction peaks of CD-SBA15, two distinct peaks located at 13.1° and 27.4° are shown and the characteristic peak intensity of composites is stronger and stronger with increasing melamine amounts. The two peaks are indexed to the (100) and (002) diffraction planes of g-C3N4 and correspond to the interlayer stacking peak of aromatic systems and the in-plane structural packing motif of tri-s-triazine units.28,29 These two peaks together prove the successful synthesis of carbon nitride in the composite catalysts.
6 SBA15–CN and CD-SBA15–CN photocatalysts. As can be seen from the figure, a broad peak at 22° which is attributed to amorphous silica is shown.27 Compare with the diffraction peaks of CD-SBA15, two distinct peaks located at 13.1° and 27.4° are shown and the characteristic peak intensity of composites is stronger and stronger with increasing melamine amounts. The two peaks are indexed to the (100) and (002) diffraction planes of g-C3N4 and correspond to the interlayer stacking peak of aromatic systems and the in-plane structural packing motif of tri-s-triazine units.28,29 These two peaks together prove the successful synthesis of carbon nitride in the composite catalysts.
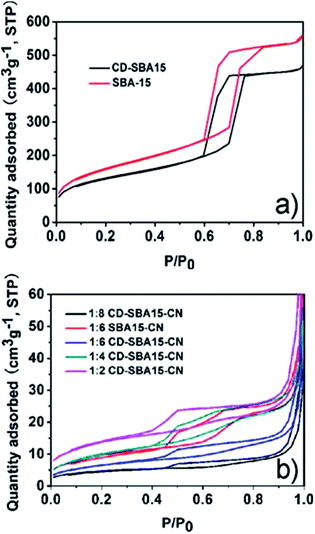 | ||
| Fig. 2 N2 adsorption–desorption isotherms of (a) SBA-15 and CD-SBA15, (b) CD-SBA15–CN series samples. | ||
| Samples | SBET (m2 g−1) | Pore volume (cm3 g−1) | Pore size (nm) |
|---|---|---|---|
| g-C3N4 | 8.43 | 0.04 | 25.65 |
| SBA-15 | 565.54 | 0.87 | 5.65 |
| CD-SBA15 | 455.35 | 0.71 | 5.45 |
1![[thin space (1/6-em)]](https://www.rsc.org/images/entities/char_2009.gif) : :![[thin space (1/6-em)]](https://www.rsc.org/images/entities/char_2009.gif) 6 SBA15–CN 6 SBA15–CN |
38.11 | 0.10 | 3.80 |
1![[thin space (1/6-em)]](https://www.rsc.org/images/entities/char_2009.gif) : :![[thin space (1/6-em)]](https://www.rsc.org/images/entities/char_2009.gif) 2 CD-SBA15–CN 2 CD-SBA15–CN |
47.58 | 0.15 | 3.99 |
1![[thin space (1/6-em)]](https://www.rsc.org/images/entities/char_2009.gif) : :![[thin space (1/6-em)]](https://www.rsc.org/images/entities/char_2009.gif) 4 CD-SBA15–CN 4 CD-SBA15–CN |
36.47 | 0.09 | 3.81 |
1![[thin space (1/6-em)]](https://www.rsc.org/images/entities/char_2009.gif) : :![[thin space (1/6-em)]](https://www.rsc.org/images/entities/char_2009.gif) 6 CD-SBA15–CN 6 CD-SBA15–CN |
23.35 | 0.08 | 3.79 |
1![[thin space (1/6-em)]](https://www.rsc.org/images/entities/char_2009.gif) : :![[thin space (1/6-em)]](https://www.rsc.org/images/entities/char_2009.gif) 8 CD-SBA15–CN 8 CD-SBA15–CN |
16.05 | 0.05 | 3.69 |
After the loading of g-C3N4, the mesoporous structure of all CD-SBA15–CN photocatalysts is maintained (Fig. 2b). As presented in Table 1, pure g-C3N4 has small specific surface area, small pore volume, and large pore size. After compositing CD-SBA15 or SBA-15 with g-C3N4, SBA15–CN and CD-SBA15–CN photocatalysts show relatively higher specific surface area, larger pore volume and smaller pore size as compared to the pure g-C3N4, but with increasing g-C3N4 amounts, the surface area, pore size and pore volume of the CD-SBA15–CN reduced, indicating the successful dispersed g-C3N4 into the pores of CD-SBA15 and existing a optimum content of g-C3N4.
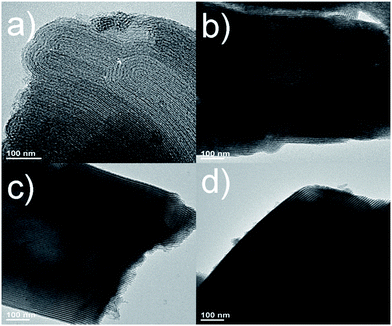
![[thin space (1/6-em)]](https://www.rsc.org/images/entities/char_2009.gif) :
:![[thin space (1/6-em)]](https://www.rsc.org/images/entities/char_2009.gif) 6 SBA15-CN, CD-SBA15 and 1
6 SBA15-CN, CD-SBA15 and 1![[thin space (1/6-em)]](https://www.rsc.org/images/entities/char_2009.gif) :
:![[thin space (1/6-em)]](https://www.rsc.org/images/entities/char_2009.gif) 6 CD-SBA15–CN. As shown in Fig. 3a and c, both SBA-15 and CD-SBA15 present highly ordered mesoporous structures, which are consistent with the N2 adsorption–desorption isotherms (Fig. 2a). As for SBA15–CN in Fig. 3b and CD-SBA15–CN in Fig. 3d, the mesoporous have been partially filled with carbon nitride materials without obvious aggregation of carbon nitride observed and the hollow mesostructures are dominant, meaning the well dispersion of carbon nitride in CD-SBA15.
6 CD-SBA15–CN. As shown in Fig. 3a and c, both SBA-15 and CD-SBA15 present highly ordered mesoporous structures, which are consistent with the N2 adsorption–desorption isotherms (Fig. 2a). As for SBA15–CN in Fig. 3b and CD-SBA15–CN in Fig. 3d, the mesoporous have been partially filled with carbon nitride materials without obvious aggregation of carbon nitride observed and the hollow mesostructures are dominant, meaning the well dispersion of carbon nitride in CD-SBA15.
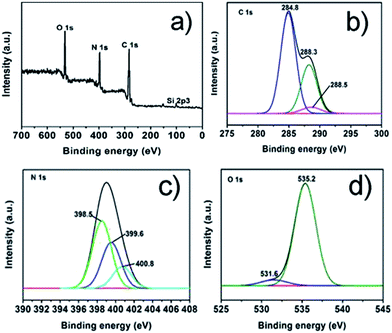
![[thin space (1/6-em)]](https://www.rsc.org/images/entities/char_2009.gif) :
:![[thin space (1/6-em)]](https://www.rsc.org/images/entities/char_2009.gif) 6 CD-SBA15–CN, which reveals that elements of the sample including Si, O, C and N. As displayed in Fig. 4b, the high resolution spectrum of C 1 s can be de-convoluted to three peaks at 288.5 eV, 288.3 eV and 284.8 eV. The peak at 284.8 eV corresponds to graphene carbon, and the weaker one at 288.3 eV is associated with sp2-bonded carbon (N–C
6 CD-SBA15–CN, which reveals that elements of the sample including Si, O, C and N. As displayed in Fig. 4b, the high resolution spectrum of C 1 s can be de-convoluted to three peaks at 288.5 eV, 288.3 eV and 284.8 eV. The peak at 284.8 eV corresponds to graphene carbon, and the weaker one at 288.3 eV is associated with sp2-bonded carbon (N–C![[double bond, length as m-dash]](https://www.rsc.org/images/entities/char_e001.gif) N) which usually appear in the XPS spectra of g-C3N4. In addition, the C 1s peak at 288.5 eV is identified as the bond of C
N) which usually appear in the XPS spectra of g-C3N4. In addition, the C 1s peak at 288.5 eV is identified as the bond of C![[double bond, length as m-dash]](https://www.rsc.org/images/entities/char_e001.gif) O.33 This result coincides well with the high resolution spectrum of O 1s (Fig. 4d), in which the de-convoluted peaks around 535.2 eV and 531.6 eV corresponded to –OH and HO–C
O.33 This result coincides well with the high resolution spectrum of O 1s (Fig. 4d), in which the de-convoluted peaks around 535.2 eV and 531.6 eV corresponded to –OH and HO–C![[double bond, length as m-dash]](https://www.rsc.org/images/entities/char_e001.gif) O, respectively,34 what have identified the existence of carbon dot. Besides, as we can see from the N 1s core level in Fig. 4c, the de-convoluted peak centered at 398.5 eV belong to sp2-hybridized nitrogen (C–N
O, respectively,34 what have identified the existence of carbon dot. Besides, as we can see from the N 1s core level in Fig. 4c, the de-convoluted peak centered at 398.5 eV belong to sp2-hybridized nitrogen (C–N![[double bond, length as m-dash]](https://www.rsc.org/images/entities/char_e001.gif) C). And the peaks at 399.6 eV and 400.8 eV correspond to the nitrogen in N–(C)3 and C–N–H which come from the g-C3N4, respectively.35,36 All above results further confirmed the formation of samples composed of g-C3N4 and carbon dots, suggesting the g-C3N4 have been introduced into the CD-SBA15 successfully.
C). And the peaks at 399.6 eV and 400.8 eV correspond to the nitrogen in N–(C)3 and C–N–H which come from the g-C3N4, respectively.35,36 All above results further confirmed the formation of samples composed of g-C3N4 and carbon dots, suggesting the g-C3N4 have been introduced into the CD-SBA15 successfully.
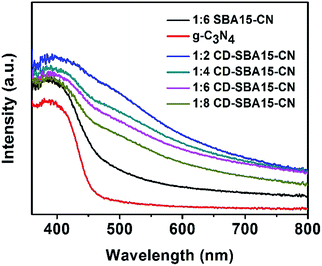
![[thin space (1/6-em)]](https://www.rsc.org/images/entities/char_2009.gif) :
:![[thin space (1/6-em)]](https://www.rsc.org/images/entities/char_2009.gif) 6 SBA15–CN in visible light region can also be observed. This indicates that the modification of SBA-15 can improve visible light utilization of SBA15–CN photocatalysts due to the high dispersion of g-C3N4 in SBA-15 channel. By contrast, the visible light harvesting capability of the CD-SBA15–CN composites increase with the decrease of g-C3N4 due to the intrinsic optical absorbance of the CDs, which indicates that CD-SBA15–CN can absorb more energy from the visible light that leads to enhance photocatalytic activity. A further observation is that the absorption edge of CD-SBA15–CN shift, which suggests the incorporation of CDs into the g-C3N4.
6 SBA15–CN in visible light region can also be observed. This indicates that the modification of SBA-15 can improve visible light utilization of SBA15–CN photocatalysts due to the high dispersion of g-C3N4 in SBA-15 channel. By contrast, the visible light harvesting capability of the CD-SBA15–CN composites increase with the decrease of g-C3N4 due to the intrinsic optical absorbance of the CDs, which indicates that CD-SBA15–CN can absorb more energy from the visible light that leads to enhance photocatalytic activity. A further observation is that the absorption edge of CD-SBA15–CN shift, which suggests the incorporation of CDs into the g-C3N4.
3.2 Photocatalytic performances
![[thin space (1/6-em)]](https://www.rsc.org/images/entities/char_2009.gif) :
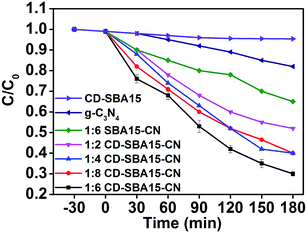
:![[thin space (1/6-em)]](https://www.rsc.org/images/entities/char_2009.gif) 6 SBA15–CN reaches 36%, which is 2 times as high as that of bare g-C3N4. After loading of CDs into the mesoporous channels of SBA-15, the phenol degradation rate can be further enhanced. In addition, by optimizing the mass ratio of CD-SBA15 to g-C3N4, the best photocatalytic performance of CD-SBA15–CN photocatalysts can be achieved for 1
6 SBA15–CN reaches 36%, which is 2 times as high as that of bare g-C3N4. After loading of CDs into the mesoporous channels of SBA-15, the phenol degradation rate can be further enhanced. In addition, by optimizing the mass ratio of CD-SBA15 to g-C3N4, the best photocatalytic performance of CD-SBA15–CN photocatalysts can be achieved for 1![[thin space (1/6-em)]](https://www.rsc.org/images/entities/char_2009.gif) :
:![[thin space (1/6-em)]](https://www.rsc.org/images/entities/char_2009.gif) 6 CD-SBA15–CN, whose phenol degradation rate almost reaches 70%.
6 CD-SBA15–CN, whose phenol degradation rate almost reaches 70%.
![[thin space (1/6-em)]](https://www.rsc.org/images/entities/char_2009.gif) :
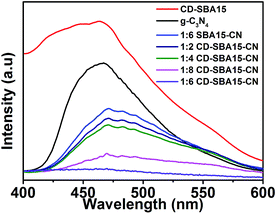
:![[thin space (1/6-em)]](https://www.rsc.org/images/entities/char_2009.gif) 6 SBA15–CN shows weaker emission intensity than that of g-C3N4. The significant PL quenching of g-C3N4 may be because of the well dispersion of g-C3N4 fragments with decreased particle size in the SBA-15 channels, shortening the transfer distance of the photo-generated charge carriers to the active sites on the surface and consequently effectively promoting the separation of the photo-generated charge carriers in 1
6 SBA15–CN shows weaker emission intensity than that of g-C3N4. The significant PL quenching of g-C3N4 may be because of the well dispersion of g-C3N4 fragments with decreased particle size in the SBA-15 channels, shortening the transfer distance of the photo-generated charge carriers to the active sites on the surface and consequently effectively promoting the separation of the photo-generated charge carriers in 1![[thin space (1/6-em)]](https://www.rsc.org/images/entities/char_2009.gif) :
:![[thin space (1/6-em)]](https://www.rsc.org/images/entities/char_2009.gif) 6 SBA15–CN. For 1
6 SBA15–CN. For 1![[thin space (1/6-em)]](https://www.rsc.org/images/entities/char_2009.gif) :
:![[thin space (1/6-em)]](https://www.rsc.org/images/entities/char_2009.gif) 6 CD-SBA15–CN, the PL intensity is further decreased, indicating the interaction between CDs and g-C3N4 can promote the separation of charges more effectively,37–39 which is consistent with the photocatalytic activity of the samples.
6 CD-SBA15–CN, the PL intensity is further decreased, indicating the interaction between CDs and g-C3N4 can promote the separation of charges more effectively,37–39 which is consistent with the photocatalytic activity of the samples.
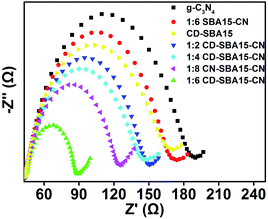
Besides the PL measurement, electrochemical impedance spectroscopy (EIS) is another important measurement to investigate the charge transfer ability of the catalysts.40–42 A smaller arc radius means a higher utilization of visible light and a higher photocatalytic activity. As shown in Fig. 8 as we can see that g-C3N4 has the largest arc radius, suggesting a high charge transport resistance of the material. After g-C3N4 loading on SBA-15, high disperse g-C3N4 has a smaller charge transport resistance, which means a more quickly transfer photo-generated electrons. When the carbon dots combine with SBA15, carbon dots can quickly transfer photogenerated electrons (that's why CD-SBA15 has a smaller arc radius) showed a much smaller arc radius. As a result, compare with SBA15–CN, arc radius of CD-SBA15–CN is smaller, and 1![[thin space (1/6-em)]](https://www.rsc.org/images/entities/char_2009.gif) :
:![[thin space (1/6-em)]](https://www.rsc.org/images/entities/char_2009.gif) 6 CD-SBA15–CN is smallest, which means photogenerated electrons on 1
6 CD-SBA15–CN is smallest, which means photogenerated electrons on 1![[thin space (1/6-em)]](https://www.rsc.org/images/entities/char_2009.gif) :
:![[thin space (1/6-em)]](https://www.rsc.org/images/entities/char_2009.gif) 6 CD-SBA15–CN can be quickly transfered then have an excellent photocatalytic performance.
6 CD-SBA15–CN can be quickly transfered then have an excellent photocatalytic performance.
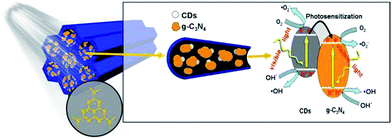
Based on the above results, a mechanism for the enhanced photocatalytic phenol degradation and charge transfer over the CD-SBA15–CN composite photocatalyst is proposed and schematically illustrated in Fig. 9. The high dispersion of g-C3N4 into CD-SBA15 leads to reduced recombination of photo-generated electrons and holes, as proved by the PL analysis. In addition, the combination of g-C3N4 and CDs in the mesoporous can make the catalyst absorb more visible light, resulting in more photo-generated electrons and holes. Moreover, CDs could inject electrons to g-C3N4 under visible light irradiation, serving as photosensitizer to g-C3N4.43 Lastly, the interaction between CDs and g-C3N4 could help the photogenerated electrons transfer more efficiently as demonstrated by the EIS result, further reduce the recombination rate of electron–hole pairs as well as greatly promote the generation of active species on the surface. Collectively, all the above contributed to the enhanced photocatalytic activity, accelerated the phenol degradation.
Conclusion
To sum up, g-C3N4 has been successfully loaded into the CD-SBA15 by an impregnation method. The obtained SBA15–CN composites exhibit better photocatalytic performance than the pure g-C3N4 under visible light irradiation. The well dispersion of g-C3N4 into SBA-15 can shorten the distance for charge transfer and inhibit the recombination of charges in g-C3N4. Moreover, for CD-SBA15–CN, the photocatalytic activity under visible light is further improved because the CDs can enhance the adsorption of visible light and the interaction between CDs and g-C3N4 can promote the separation of photo-generated electron–hole pairs. This thought of charge transfer enhancement by the CD-SBA15 will provide a new route to develop advanced composite catalysts for water purification.Conflicts of interest
There are no conflicts to declare.Acknowledgements
This work was financially supported by National Nature Science Foundation of China (21407049, 21377038, 21237003, 21677048), Science and Technology Commission of Shanghai Municipality (16JC1401400, 17520711500), National Key Research and Development Program (2016YFA0204200), China Postdoctoral Science Foundation (2015T8049), the Fundamental Research Funds for the Central Universities (222201714061).Notes and references
- C. Chen, W. Ma and J. Zhao, Chem. Soc. Rev., 2010, 39, 4206 RSC.
- J. Schneider, M. Matsuoka, M. Takeuchi, J. Zhang, Y. Horiuchi, M. Anpo and D. W. Bahnemann, Chem. Rev., 2014, 114, 9919 CrossRef CAS PubMed.
- H. Li, X. Shen, Y. D. Liu, L. Z. Wang, J. Y. Lei and J. L. Zhang, J. Alloys Compd., 2015, 646, 380–386 CrossRef CAS.
- H. Li, L. Zhou, L. Z. Wang, Y. D. Liu, J. Lei and J. L. Zhang, Phys. Chem. Chem. Phys., 2015, 17, 17406–17412 RSC.
- Y. Liu, P. Zhang, B. Z. Tian and J. L. Zhang, ACS Appl. Mater. Interfaces, 2015, 7, 13849 CAS.
- Y. Liu, P. Zhang, B. Z. Tian and J. L. Zhang, Catal. Commun., 2015, 70, 30 CrossRef CAS.
- J. Y. Lei, Y. Chen, F. Shen, L. Z. Wang, Y. D. Liu and J. L. Zhang, J. Alloys Compd., 2015, 631, 328 CrossRef CAS.
- H. Li, L. Z. Wang, Y. D. Liu, J. Y. Lei and J. L. Zhang, Res. Chem. Intermed., 2016, 42, 3979 CrossRef CAS.
- X. C. Wang, K. Maeda, A. Thomas, K. Takanabe, G. Xin, J. M. Carlsson, K. Domen and M. Antonietti, Nat. Mater., 2009, 8, 76 CrossRef CAS PubMed.
- D. Masih, Y. Ma and S. Rohani, Appl. Catal., B, 2017, 206, 556 CrossRef CAS.
- Y. M. Liu, J. P. Wang and P. Yang, RSC Adv., 2016, 6, 34334 RSC.
- Z. W. Zhao, Y. J. Sun and F. Dong, Nanoscale, 2015, 7, 15 RSC.
- S. Patnaik, S. Martha and K. M. Parida, RSC Adv., 2016, 52, 46929 RSC.
- W. Iqbal, B. C. Qiu, J. Y. Lei, L. Z. Wang, J. L. Zhang and M. Anpo, Dalton Trans., 2017, 46, 10678–10684 RSC.
- L. Zhou, L. Z. Wang, J. Y. Lei, Y. D. Liu and J. L. Zhang, Catal. Commun., 2017, 89, 125 CrossRef CAS.
- J. Y. Lei, F. H. Liu, L. Z. Wang, Y. D. Liu and J. L. Zhang, RSC Adv., 2017, 7, 27377 RSC.
- L. Zhou, L. Z. Wang, J. L. Zhang, J. Y. Lei and Y. D. Liu, Eur. J. Inorg. Chem., 2016, 34, 5387 CrossRef.
- H. Zhang, L. X. Zhao, F. L. Geng, L. H. Guo, B. Wan and Y. Yang, Appl. Catal., B, 2016, 180, 656 CrossRef CAS.
- S. Shen and L. Guo, Mater. Res. Bull., 2008, 43, 437 CrossRef CAS.
- Z. Huang, F. B. Li, B. F. Chen, T. Lu, Y. Yuan and G. Q. Yuan, Appl. Catal., B, 2013, 136, 269 CrossRef.
- C. Cheng, X. J. Tan and J. Zhang, Chem.–Eur. J., 2015, 21, 17944 CrossRef CAS PubMed.
- F. Wang, Z. Xie, H. Zhang, C. Y. Liu and Y. G. Zhang, Adv. Funct. Mater., 2011, 21, 1027 CrossRef CAS.
- J. Y. Lei, L. G. Yang, X. F. Yan, C. Cheng, Y. D. Liu, L. Z. Wang and J. L. Zhang, Adv. Opt. Mater., 2015, 3, 57 CrossRef CAS.
- L. G. Wang, C. Cheng, S. Tapas, J. Y. Lei, M. Matsuoka, J. L Zhang and F. Zhang, J. Mater. Chem. A, 2015, 3, 13357 CAS.
- C. Cheng, X. J. Tan, D. Lu, L. Z. Wang, T. Sen, J. Y. Lei, A. M. El-Toni, J. L. Zhang, F. Zhang and D. Zhao, Chem.–Eur. J., 2015, 21, 17944 CrossRef CAS PubMed.
- D. Y. Zhao, J. L. Feng, Q. S. Huo, N. Melosh, G. H. Fredrickson, B. F. Chmelka and G. D. Stucky, Science, 1998, 279, 548 CrossRef CAS PubMed.
- D. Y. Zhao, Q. S. Huo, J. L. Feng, B. F. Chmelka and G. D. Stucky, J. Am. Chem. Soc., 1998, 120, 6024 CrossRef CAS.
- Y. M. Wu, L. Tao, J. Zhao, X. Yue, W. Y. Deng, Y. X Li and C. Y. Wang, Res. Chem. Intermed., 2016, 42, 3609 CrossRef CAS.
- C. Z. Zhu, Z. F. Jiang, W. Wei, L. L. Chen, D. Liu, K. Qian, X. M. Lu and J. M. Xie, Res. Chem. Intermed., 2016, 42, 6483 CrossRef CAS.
- J. Y Lei, L. G. Yang, D. Lu, X. F. Yan, C. Cheng, Y. D. Liu, L. Z. Wang and J. L. Zhang, Adv. Opt. Mater., 2015, 3, 57–63 CrossRef.
- J. Y. Lei, L. Z. Wang and J. Zhang, ACS Nano, 2011, 5, 3447 CrossRef CAS PubMed.
- J. Lei, L. Wang and J. Zhang, Chem. Commun., 2010, 46, 8445 RSC.
- Y. Wu, M. Xing and J. Zhang, J. Hazard. Mater., 2011, 192, 368 CAS.
- J. Mao, T. Peng, X. Zhang, K. Li, L. Ye and L. Zan, Catal. Sci. Technol., 2013, 3, 1253 CAS.
- X. Lu, K. Xu, P. Chen, K. Jia, S. Liu and C. Wu, J. Mater. Chem. A, 2014, 2, 18924 CAS.
- Y. Hou, Z. Wen, S. Cui, X. Guo and J. Chen, Adv. Mater., 2013, 25, 6291 CrossRef CAS PubMed.
- B. Subash, B. Krishnakumar, M. Swaminathan and M. Shanthi, Res. Chem. Intermed., 2013, 39, 3181 CrossRef CAS.
- F. H. Liu, J. Yu, G. Y. Tu, L. Qu, J. C. Xiao, Y. D. Liu, L. Z. Wang, J. Lei and J. L. Zhang, Appl. Catal., B, 2017, 201, 1 CrossRef CAS.
- X. F. Wang, J. J. Cheng, H. G. Yu and J. G. Yu, Catal. Sci. Technol., 2013, 1 Search PubMed.
- M. Chen, L. L. Shao, Y. X. Guo and X. Q. Cao, Chem. Eng. J., 2016, 304, 303 CrossRef CAS.
- X. Liu, L. J. Chen, R. Y. Chen, Z. Chen, X. Chen and X. Zheng, Res. Chem. Intermed., 2015, 41, 3623 CrossRef CAS.
- S. M. Yin, J. Y. Han, T. H. Zhou and R. Xu, Catal. Sci. Technol., 2015, 5, 5048 CAS.
- J. C. Bian, C. Huang, L. Y. Wang, T. F. Hung, A. W. Daoud and R. Q. Zhang, ACS Appl. Mater. Interfaces, 2014, 6, 4883 CAS.
Footnote |
| † Electronic supplementary information (ESI) available. See DOI: 10.1039/c7ra08969d |
| This journal is © The Royal Society of Chemistry 2017 |

