 Open Access Article
Creative Commons Attribution 3.0 Unported Licence
Role of porosity and polarity of nanoporous carbon spheres in adsorption applications†
Hee Soo
Kim
a,
Seunghun
Lee
a,
Dong Kwan
Kim
a,
Yong-Woo
Lee
*ab and
Won Cheol
Yoo
 *ab
*ab
aDepartment of Applied Chemistry, Hanyang University, Ansan 15588, Republic of Korea. E-mail: yongwoolee@hanyang.ac.kr; wcyoo@hanyang.ac.kr
bDepartment of Chemical and Molecular Engineering, Hanyang University, Ansan 15588, Republic of Korea
First published on 6th October 2017
Abstract
The role of porosity (pore size distribution (PSD) and specific surface area (SSA)) and polarity (N-doping) of carbonaceous materials for selective separation of CH4 over N2 and adsorption of heavy metal ions are presented herein. Two different carbons (resorcinol-formaldehyde carbon (RFC) and highly N-doped melanin carbon (MC)) with different N-doping levels are utilized and further activated by hot CO2 treatment to finely control PSD and SSA. For CH4 adsorption, the accumulated ultramicropore (<1 nm) volume of both carbons is strongly correlated with CH4 adsorption regardless of surface polarity of carbons (R2 = 0.94). This is probably due to the high polarizability and nonpolar nature of CH4. Carbons with the highest ultramicropore volumes (RFC_C60 and MC_C55) show ultrahigh CH4 uptake capacities of 2.64 and 2.41 mmol g−1 at 273 K under 1 bar, respectively; these carbons also have superb CH4 over N2 selectivity of 6.8 and 7.4 obtained at 298 K, respectively. RFC_C60 and MC_C55 present excellent CH4 adsorption capacities and selectivities for CH4 over N2, which are comparable with the best values reported from various porous materials. In addition, heavy metal ion (Fe2+, Sb3+, and Sb5+) adsorption was achieved to identify the importance of SSA and the polarity of carbons. The SSA of RFC samples is highly correlated with Fe2+ metal ion adsorption capacity (R2 = 0.98). Conversely, highly N-doped MC series are located on the upper region of the plotted line of RFC samples due to their basic nature, which is caused by high loading of N-doping within the carbon framework. Furthermore, RFC_C60 and MC_C55 samples with similar porosity but different N-doping levels are utilized for selective adsorption of Sb3+ over Sb5+. The more basic MC_C55 has higher selectivity of 3.3 compared to that of its less basic counterpart (2.0), strongly inferring that carbon polarity is involved in metal ion adsorption. Distinct correlations between carbon porosity and polarity, adsorption capacity for CH4, ultrahigh selectivity for CH4 over N2, adsorption capacity, and selectivity of metal ions are exclusively elucidated here, providing design principles of nanoporous carbonaceous materials for specific adsorption applications.
1. Introduction
Carbonaceous materials are highly porous, lightweight, chemically and physically stable, and relatively cheap, making them suitable for numerous applications. Carbons have been intensively utilized as sorbents for gas molecules and metal ions because of textural features such as controllable PSD, high SSA, and surface polarity associated with heteroatom doping within the graphitic framework. Textural features and polarity should be judiciously considered when applying carbon materials for specific adsorption applications.Several porous materials have been implemented for adsorption-based separation of CH4 over N2, including silica gels,1 activated carbons,2–4 zeolites,5,6 Metal–Organic Frameworks (MOFs),7–10 and microporous organic polymers (MOPs).11 For example, ultramicropores (<1 nm) have a pivotal role in CH4 adsorption and adsorption-based separation of CH4 over N2. The effective separation of CH4 over N2 is needed for unconventional natural gases (UCNs), such as landfill gas and shale gas,7,8,12 which inevitably contain impurities such as CO2 and N2. These UCNs need to be upgraded to meet pipeline quality (typically >90% methane).13 Although adsorption-based separation of CH4 over N2 is an effective process for removing N2 from UCN, the process is difficult due to the similar sizes and nonpolar nature of CH4 and N2. Therefore, adsorbents that are highly selective for CH4 over N2 are needed. Largely developed ultramicropore and moderate adsorbent polarizability have shown improved adsorption selectivity for CH4 over N2 (ref. 7 and 14–19) in equilibrium separation. The higher polarizability of CH4 (2.59 Å3) over N2 (1.74 Å3) mainly accounts for the higher adsorption of CH4 over N2 within ultramicropores.7,14–19 A similar trend of CO2 over N2 is due to the higher polarizability of CO2 (2.91 Å3).20–24
Recently, MOFs with a 1-D micro-channel have shown outstanding adsorption-based selectivity up to 8.34 at 298 K.7 Hyper-cross-linked heterocyclic MOPs also presented high adsorption-based selectivity of 8.0 at 273 K and 7.6 at 298 K.11 However, the adsorption capacities of these MOFs and MOPs at 1 bar with the above temperatures are less than 1 mmol g−1, which is not sufficient for practical purposes.
Recent reports on carbonaceous materials have shown promising adsorption capacity of CH4 at ambient conditions. El-Kaderi et al. synthesized N-doped porous carbons activated by KOH with outstanding CH4 uptake capacity of 2.7 mmol g−1 at 273 K and 1.7 mmol g−1 at 298 K.25 The Qiu group reported KOH activated carbons derived from a porous aromatic framework with high CH4 adsorption capacity of 2.4 mmol g−1 at 273 K.19 Both research groups reported carbons with ultrahigh CH4 uptake at ambient conditions and ultramicropores developed by a judicious KOH activation process as the key component.
On the other hand, contamination of water by heavy metal ions is a serious issue for health and environmental reasons due to their toxic and nonbiodegradable properties.26–30 For example, antimony (Sb) has been widely utilized in numerous industrial areas, such as production of batteries, ceramics, chemicals, and flame retardants.31–35 Antimony species are highly toxic compounds known as high priority pollutants determined by the USEPA and EU, by which the maximum permissible concentrations for Sb species in drinking water are 6 and 5 µg l−1, respectively.33,35 In environmental species, antimony is mainly found in two oxidation states of Sb3+ and Sb5+. Most oxygenated systems contain predominately Sb5+ formed as Sb(OH)6−.32,33 Sb3+ mainly formed as Sb(OH)3 is almost ten times more toxic than Sb5+.31,33,36
Among various methods for removing heavy metal ions, an adsorption-based removal process is the most widely utilized due to its effectiveness and economic benefits.26,27,29,30 In general, large SSA and basic surface functionality of adsorbents forming complexes with metal ions are needed for effective removal of metal ions from aqueous solutions.26–30 As efficient adsorbents for metal ion adsorption, carbonaceous materials have been widely implemented due to the aforementioned features.27,29,30
Herein, the role of porosity (i.e., PSA and SSA) and polarity (i.e., N-doping) of carbonaceous materials for adsorption applications are presented. Different precursors of resorcinol-formaldehyde (RF) and highly N-containing dopamine are utilized to prepare RFC and highly N-doped MC spheres that are further activated by hot CO2 treatment to finely control PSD, SSA, and pore volume. The importance of carbon ultramicroporosity is revealed in that CH4 adsorption and adsorption-based selective separation of CH4 over N2 are strongly correlated with accumulated pore volumes of 0.7 nm and 1 nm of both carbons regardless of surface polarity. This result is ascribed to the high polarizability and nonpolar nature of CH4. Carbons with highest ultramicropore volumes show ultrahigh CH4 uptake capacities and superb selectivity for CH4 over N2, comparable with the best results from MOFs, MOPs, zeolites, and carbonaceous materials.
In addition, adsorption of heavy metal ions (Fe2+, Sb3+, and Sb5+) is achieved to reveal the role of SSA and polarity of carbons. The SSAs of the RFC series are highly correlated with Fe2+ adsorption capacity (R2 = 0.98). Conversely, MC samples are located in the upper region of the plotted line for RFC samples due to their basic nature caused by high loading of N-doping within a carbon framework. Furthermore, RFC_C60 and MC_C55 with similar porosity but different N-doping levels are utilized for selective adsorption of Sb3+ over Sb5+. The more basic MC_C55 has higher selectivity, indicating the role of carbon surface polarity. The structure–property relationship of carbons for adsorption of gas molecules and heavy metal ions is elucidated herein along with design principles of nanoporous carbonaceous materials for use in specific adsorption applications.
2. Experimental section
2.1 Reagents and chemicals
Resorcinol (Junsei), formaldehyde (38%, Amresco), dopamine hydrochloride (Sigma Aldrich), and ammonia solution (28%, Daejung) were used for synthetic carbons. Iron(III) nitrate hexahydrate (99%, Sigma Aldrich), potassium antimonyl tartrate hemihydrate (99.5%, Daejung), potassium hexahydroxoantimonate (99%, Sigma Aldrich), and pH 5 buffer solution (98%, Daejung) were used for metal ion adsorption experiments. High purity gas was used for all adsorption experiments (N2: 99.999%, CH4: 99.95%).2.2 Synthesis of RFP, MP and RFC, MC samples
To synthesize resorcinol-formaldehyde polymers (RFP), resorcinol (0.14 g) and formaldehyde (0.16 g, 28%) were mixed with a solution containing (200 ml) deionized water (H2O) and aqueous ammonia (0.7 g, 28% NH4OH). After stirring for 24 h at room temperature, the reaction mixture was moved to an oven and was subsequently heated for 24 h at 90 °C without stirring. Solid product was recovered by centrifugation and was washed several times with deionized water.To synthesize melanin polymers (MP), 1.08 g of dopamine hydrochloride was dissolved in 280 ml of deionized water and 80 ml of ethanol. Under vigorous stirring, 1 ml of aqueous ammonia solution (28% NH3 (aq.)) was added to a dopamine hydrochloride solution at room temperature. After stirring for 12 hours, melanin-like nanoparticles were retrieved by centrifugation and were washed with deionized water and ethanol several times.
To obtain carbon samples, RFP was heated from ambient temperature to 800 °C under a N2 atmosphere over 3 h at a heating rate of 4.3 °C per min, and then denoted as RFC. In the melanin polymer carbonization process, MP samples underwent carbonization at 800 °C (N2 atmosphere over 3 h at a heating rate of 4.3 °C per min). These carbon samples were denoted as MC.
2.3 CO2 activation process
CO2 activation was performed using 250 mg of carbon samples. The samples were placed in an alumina boat in a quartz tube in the isothermal zone of a tubular furnace that was purged with flowing nitrogen. The samples were heated to 900 °C (heating rate 30 °C per min) under inert conditions (N2), followed by changing the gas flux to CO2 (1000 cc per min) for various times (e.g., 60, 120, 250, and 380 min). CO2 activated carbon samples were denoted as RFC_CX and MC_CX, where X is CO2 activation time.2.4 Adsorption measurements for Fe2+ ion and calculation of adsorption capacity using Langmuir method
A stock solution of Fe ions was prepared by dissolving Fe(NO3)2·6H2O in deionized pH 5 buffer solution at 2.1 mM (410 ppm). Different carbon samples (10 mg) were added to 10 ml of pH 5 buffer solution, and the mixture was stirred for various amounts of time (e.g., 30, 60, 120, 360, and 720 min). Next, an aliquot of the sample was removed and centrifuged to separate the solid and liquid. Finally, the concentration of metal ion in the supernatant was analyzed by UV-vis spectrometry. The calibration curve of the different concentrations of Fe2+ and UV-vis results for carbon samples are in the Fig. S1.† The adsorption capacity of adsorbent at equilibrium was calculated by the following equation:where qe is equilibrium adsorption capacity of adsorbent in mg g−1, C0 is initial concentration in mg l−1, Ce is equilibrium concentration of Fe ion in mg l−1, V is volume in l of Fe ion solution, and W is weight in g of adsorbent (carbon sample).
The isotherm data were correlated with Langmuir models. A Langmuir isotherm is based on monolayer sorption of metal ion on the surface of adsorbent and is described by the following equation:
2.5 Adsorption measurements for Sb3+ and Sb5+ ions and capacity
To make Sb(III) 1000 ppm solutions, potassium antimonyl tartrate hemihydrate (1.38 g) was mixed with a solution containing (500 ml) deionized water (H2O). To make Sb(V) 1000 ppm solutions, potassium hexahydroxoantimonate (1.08 g) was mixed with a solution containing (500 ml) deionized water (H2O). And the two solutions were mixed 1![[thin space (1/6-em)]](https://www.rsc.org/images/entities/char_2009.gif) :
:![[thin space (1/6-em)]](https://www.rsc.org/images/entities/char_2009.gif) 1 and serial diluted to the target concentration (50, 500 ppb). An aqueous solution (30 ml) with a suitable concentration of Sb ions was shaken with a suitable amount of adsorbent at 20 °C for a definite period. Acid (hydrochloric acid) and base (potassium hydroxide) solutions were added to adjust pH, which was measured with a digital pH meter. After removing the adsorbent by centrifugation, the concentrations of anions remaining in the supernatant were determined by anodic stripping voltammetry (PDV 6000 plus, Modern Water, UK) to determine each Sb ion (Sb3+ and Sb5+) and inductive coupled plasma mass spectroscopy (NexION 300X, Perkin Elmer, USA) to determine total Sb ions. The adsorption isotherms were studied with varying initial concentrations of Sb ions at a fixed dose of adsorbent (10 mg). The adsorption density, given as µmol-Sb/g adsorbent, was calculated from the residual concentrations of Sb ions, known initial concentrations of Sb ions (µM), and amount of adsorbent used (g).
1 and serial diluted to the target concentration (50, 500 ppb). An aqueous solution (30 ml) with a suitable concentration of Sb ions was shaken with a suitable amount of adsorbent at 20 °C for a definite period. Acid (hydrochloric acid) and base (potassium hydroxide) solutions were added to adjust pH, which was measured with a digital pH meter. After removing the adsorbent by centrifugation, the concentrations of anions remaining in the supernatant were determined by anodic stripping voltammetry (PDV 6000 plus, Modern Water, UK) to determine each Sb ion (Sb3+ and Sb5+) and inductive coupled plasma mass spectroscopy (NexION 300X, Perkin Elmer, USA) to determine total Sb ions. The adsorption isotherms were studied with varying initial concentrations of Sb ions at a fixed dose of adsorbent (10 mg). The adsorption density, given as µmol-Sb/g adsorbent, was calculated from the residual concentrations of Sb ions, known initial concentrations of Sb ions (µM), and amount of adsorbent used (g).
2.6 Calculation of Henry's law selectivity
Selectivity is calculated using the ratio of Henry's law constants, which is estimated from the initial slopes of CH4 (ICH4) and N2 (IN2) adsorption isotherms (0–0.1 bar):2.7 Töth isotherm calculation for carbon samples
The Töth model was applied to all of CH4 and N2 adsorption isotherms of activated carbon samples. The Töth isotherm equation can be expressed:where q and qm are the absolute amount adsorbed and the maximum amount adsorbed capacity. Ki is the adsorption constant, related to the adsorption energy and the affinity of gas molecules. n is an exponent related to the heterogeneity of the adsorbent surface.
2.8 Characterizations
Low temperature nitrogen adsorption–desorption isotherms were measured at −196 °C on an adsorption volumetric analyzer BEL MAX manufactured by BEL, Inc (Japan). CH4 and N2 adsorption isotherms were located at 0 °C and 25 °C on the adsorption volumetric analyzer (BEL MINI). All samples were degassed at 200 °C for 12 h under static vacuum before adsorption measurements. Specific surface area was determined by the Brunauer–Emmet–Teller (BET) method from nitrogen adsorption isotherms in the relative pressure range of 0.05–0.20. Total pore volume (Vt) was estimated from the amount of gas adsorbed at relative pressure P/P0 = 0.99. PSD and accumulated pore volume of RFC and MC samples were calculated from adsorption branches of nitrogen sorption isotherms using the NLDFT (nonlocal density functional theory) method for slit-like pores available in BEL master software from BEL Inc. The volume of pores below 0.7, 1, and 2 nm were calculated on the basis of accumulated pore volumes. Isosteric heat of adsorption (Qst) was calculated using the Clausius–Clapeyron equation. Surface functional groups of carbon samples were determined by recording FTIR spectra on a Varian Corporation (USA) Varian Scimitar 1000 FT-IR. Scanning electron microscopy (SEM) images were obtained with a HITACHI S-4800 microscope with accelerating voltage of 15.0 kV. Elemental analyses (EA) were obtained using FLASH EA1112. TEM images were recorded on a transmission electron microscope (JEM-2100F). UV-vis spectrometer data was recorded by Optizen 2120UV (MECASYS Inc.). The pH value was obtained from is inoLab_IDS Multi 9420 and ICP results was recorded from NexION 300X (Perkin elmer Inc). The zeta potential results were obtained from EPELS-Z1 (Otsuka Inc).3. Results and discussion
3.1 Synthesis of carbon spheres and their textural features
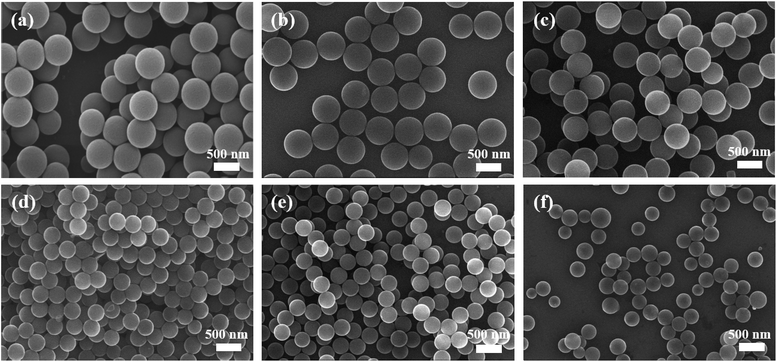
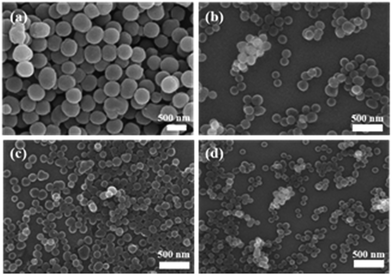
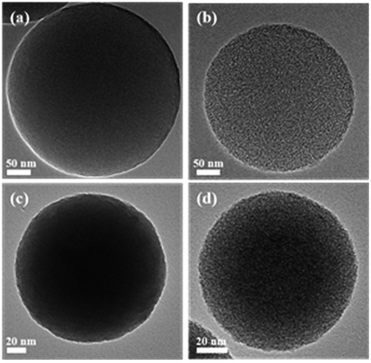
Two carbon spheres (RFC and MC) with different N-containing levels are chosen to elucidate the role of porosity and polarity of carbon spheres for CH4 adsorption, adsorption-based separation of CH4 over N2, and heavy metal ion adsorption. First, Monodisperse RFP spheres with size of 548 ± 23 nm are synthesized by the modified sol–gel method reported elsewhere38,39 (Fig. 1a). RF precursor is polymerized under water–ethanol mixture as a solvent with NH3 catalyst for 24 h and is subsequently aged for 24 h at 100 °C. It was revealed that NH3 acts as a base catalyst as well as a nitrogen additive, resulting in polymer spheres with nitrogen content less than 2.8 wt% (Table 1).38 Conversely, dopamine is chosen as a precursor to synthesize highly N-containing polymer spheres. Dopamine precursor is cross-linked via spontaneous oxidation under basic ammonia solution with O2,40 resulting in melanin-like polymer (MP) spheres with size of 393 ± 21 nm and N-content of 19.2 wt% (Fig. 2a and Table 1). Both carbons are subsequently carbonized at 800 °C and denoted as RFC and MC. The RFC sphere is reduced to 440 ± 21 nm, probably due to radial shrinkage during carbonization (Fig. 1b).38,40–43 To control PSD and SSA, hot CO2 treatment at 900 °C is carried out for RFC spheres, denoted as RFC_C50, C120, C250, and C380, respectively, where C indicates CO2 activation time. According to SEM investigation (Fig. 1c–f), the sizes of CO2-activated RFC spheres (RFC_C50, C120, C250, and C380) are reduced to 400 ± 20, 358 ± 19, 301 ± 18, and 256 ± 27 nm, respectively, which is attributed to carbon loss during the activation process (CO2(g) + C(s) → 2CO(g)).39,41–43 Such carbon loss is also identified under TEM investigation, in which the highly porous nature of the RFC_C380 sphere compared to the RFC sphere is observed (Fig. 3a and b). A similar shrinkage trend is observed for MC reduced to 162 ± 17 nm, and the sizes of CO2-activated MC spheres of MC_C55 and C125 are 130 ± 18 and 108 ± 18 nm, respectively (Fig. 2b–d). Successful CO2 activation for MC_C125 with a highly porous nature compared to MC is also identified under TEM investigation (Fig. 3c and d).| Sample | Pore volume (cm3 g−1) | BET surface areac (m2 g−1) | N (wt%) | CH4 adsorption (273 K/298 K) (mmol g−1) | Selectivity (CH4/N2) (273 K/298 K) | Q st CH4 [kJ mol−1] | Q st N2 [kJ mol−1] | Fe2+ adsorption (qm) (mg g−1) | Selectivity (Sb3+/Sb5+) (500 ppb) at pH 5 | |||
|---|---|---|---|---|---|---|---|---|---|---|---|---|
| 0.7a nm | 1a nm | 2a nm | Totalb | |||||||||
| a Accumulated pore volume obtained from NLDFT method. b Measured at P/P0 = 0.99. c Obtained from BET method. | ||||||||||||
| RFC | 0.11 | 0.22 | 0.28 | 0.38 | 628 | 1.61 | 1.83/1.26 | 3.8/4.2 | 18.2 | 5.1 | 16 | — |
| RFC_C60 | 0.67 | 0.9 | 0.91 | 0.88 | 1649 | 1.55 | 2.64/1.75 | 5.7/6.8 | 21.8 | 5.7 | 33 | 2.0 |
| RFC_C120 | 0.5 | 0.71 | 1.23 | 1.25 | 2688 | 1.34 | 2.26/1.50 | 4.9/5.3 | 20.3 | 6.1 | 61 | — |
| RFC_C250 | — | — | — | 1.61 | 3572 | 1.1 | — | — | — | — | 72 | — |
| RFC_C380 | — | — | — | 2.4 | 3958 | 0.8 | — | — | — | — | 101 | — |
| MC | 0.17 | 0.24 | 0.28 | 0.35 | 561 | 11.7 | 1.78/0.93 | 4.7/5.3 | 16.1 | 4.9 | 21 | — |
| MC_C55 | 0.58 | 0.81 | 0.88 | 0.86 | 1550 | 5.9 | 2.41/1.62 | 6.1/7.4 | 20.2 | 5.4 | 42 | 3.3 |
| MC_C125 | 0.43 | 0.65 | 1.2 | 1.23 | 2544 | 2.4 | 2.15/1.39 | 5.7/6.0 | 18.9 | 6.0 | 70 | — |
The textural features of RFC and MC series were analyzed by nitrogen sorption isotherm measurements. As-prepared RFC shows intrinsic microporosity of a type I isotherm (Fig. 4a). As CO2 activation prolongs, the amount adsorbed at low relative pressure abruptly increases, indicating the development of microporosity (Fig. 4a). Features of type IV isotherms appeared for RFC_C250 and C380, in which more carbon loss with longer activation treatment generates larger mesopores (Fig. 4a).39,41–43 According to PSD analysis determined by the NLDFT model, sharp increases in ultramicropores centered around 0.6–0.7 nm are identified for RFC_C60 and C120 samples, strongly suggesting that relative fine-tuning of ultramicropores is possible for carbonaceous materials with CO2 activation (Fig. 4b). SSAs obtained from the BET method for RFC samples (RFC, RFC_C50, C120, C250, and C380) increased from 628 to 1649, 2688, 3572, and 3958 m2 g−1, respectively, indicating the power of this activation process (Table 1). In addition, a similar pattern was observed for MC samples (MC, MC_C55 and C125). There was a sharp increase in the amount adsorbed at a relative pressure, with abrupt development of ultramicropores around 0.6–0.7 nm and large increases in SSAs from 561 to 1550 and 2544 m2 g−1, respectively (Fig. 4c and d, and Table 1).
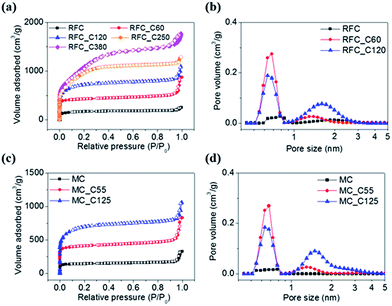 | ||
| Fig. 4 Nitrogen isotherm of RFC (a) and MC (c) samples at 77 K. Pore size distribution of RFC (b) and MC (d) samples by NLDFT method. | ||
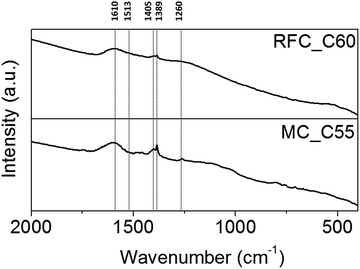
The nitrogen contents of RFC series (RFC, RFC_C60, C120, 250, and C380) are 1.61, 1.55, 1.34, 1.1, and 0.8 wt% (Table 1), respectively, indicating a gradual decrease in nitrogen content that is probably due to the less stabilized nature of nitrogen species during activation.38 In contrast, the nitrogen contents of MC series (MC, MC_C55, and C125) are 11.7, 5.9, and 2.4 wt%, definitely showing higher nitrogen content than the RFC series (Table 1). There are huge nitrogen content differences of 1.55 and 5.9 wt% for RFC_C60 and MC_C55, respectively. Considering the similar textural features, SSA, and PSD of both carbons, a polarity issue derived from N-doping could be of interest in specific adsorption applications. FR-IR measurements (Fig. 5 and Table S1†) identify the development of several peaks indicating nitrogen species within the carbon framework: 1260 cm−1 for out of plane mode of pyrrole ring, 1389 cm−1 for C–N stretching, and 1405 cm−1 for vibration peak of N![[double bond, length as m-dash]](https://www.rsc.org/images/entities/char_e001.gif) O.
O.
According to the zeta potential measurements for all carbon samples, it is identified that as prolonged CO2-activation process, the zetapotential values slightly and gradually changes from −14 mV (RFC) to −7 mV (RFC_C380) in the Fig. S2.† This is probably that hot CO2 treatment at 900 °C, relatively less stable N moiety is more damaged and disappeared easily, eventually reducing the surface polarity of the carbons with prolonged CO2-activation, which also identified from the N contents obtained from EA analysis in the Table 1. Similarly, the zetapotential values from −26, −22, and −19 mV were identified for MC and MC_C55 and C125 samples, respectively (Fig. S2†), confirming the disappearance of N content along prolonged CO2-activation process, in which the decrease of N content is also observed from EA analysis (Table 1).
3.2 Adsorption-based separation of CH4 over N2: role of ultramicroposity
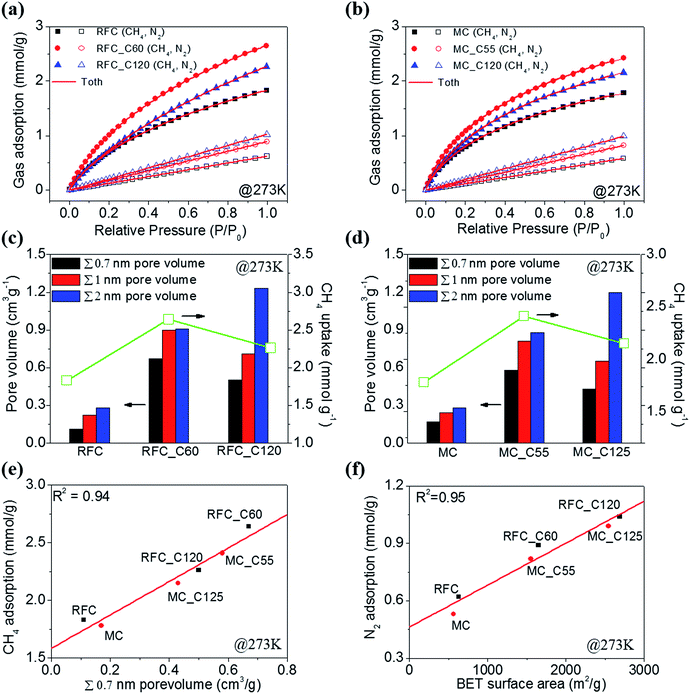
CH4 adsorption isotherms for RFC samples (RFC, RFC_C60, and C120) and MC samples (MC, MC_C55, and C125) are measured at 273 K and 298 K (Fig. 6 and S3†). The CH4 uptake capacities of RFC samples (RFC, RFC_C60, and C120) at 273 K (1 bar) are 1.83, 2.64, and 2.26 mmol g−1, respectively; those of MC samples are 1.78, 2.41, and 2.15 mmol g−1, respectively (Fig. 6a and b and Table 1). CH4 adsorption capacities of 2.64 mmol g−1 for RFC_C60 and 2.41 mmol g−1 for MC_C60 at 273 K (1 bar) are ranked among the highest CH4 uptake capacities from MOFs, MOPs, and carbonaceous materials (Table 2). In addition, CH4 adsorption capacities of RFC samples (RFC, RFC_C60, and C120) and MC samples (MC, MC_C55, and C125) at 298 K (1 bar) are 1.26, 1.75, and 1.50, and 0.93, 1.62, and 1.39 mmol g−1, respectively, demonstrating the ultrahigh CH4 adsorption ability of both carbons (Fig. S3,†Tables 1 and 2). Strong correlation is observed between the accumulated ultramicropore volumes (<0.7 nm and <1 nm) for both RFC and MC series and CH4 adsorption capacities (Fig. 6c and d). Both carbons (RFC_C60 and MC_C55) with higher accumulated ultramicropore volumes present the highest CH4 uptake capacities compared to others, strongly suggesting how to effectively enhance adsorption capacity within ultramicropores for small CH4 molecules (3.80 Å).2,37| Sample | CH4 adsorption 273 K/298 K (1 bar, mmol g−1) | Selectivity 273 K/298 K (CH4/N2) | Reference |
|---|---|---|---|
| [Ni3(HCOO)6]/MOF | —/0.791 | —/6.02 | Ref. 1 |
| [Cu(INA)2]/MOF | —/0.827 | —/8.34 | Ref. 1 |
| Ni formate/MOF | —/0.75 | —/6.1 | Ref. 2 |
| AC G2X7/carbon | 1.9/1.3 | 6.17/4.38 | Ref. 3 |
| MAC/carbon | —/0.98 | —/3 | Ref. 4 |
| K-PAF-600/carbon | 2.4/- | — | Ref. 10 |
| sOMC/carbon | 0.9/1.3 | 3.8/3.7 | Ref. 17 |
| BPL calgon/carbon | —/0.8 | —/5.0 | Ref. 18 |
| Poly(vinylidene chloride)-based carbon/carbon | —/1.8 | — | Ref. 19 |
| Hb/zeolite | 0.8/0.6 (303 K) | —/2 (303 K) | Ref. 20 |
| Nab/zeolite | 0.6/0.4 (303 K) | —/1.75 (303 K) | Ref. 20 |
| DBT/porous polymer | 1.1/0.9 | 8.0/7.6 | Ref. 21 |
| Basolite A 100/MOF | 1.12/0.71 | 4.8/3.7 | Ref. 22 |
| Cu(Me-4py-trz-ia)/MOF | 1.8/1.5 | 4.6/4.2 | Ref. 22 |
| MOF-505/MOF | 1.39/- | — | Ref. 23 |
| CPC550/carbon | 2.7/1.7 | — | Ref. 25 |
| RFC_C60 | 2.64/1.75 | 5.7/6.8 | In this work |
| MC_C55 | 2.41/1.62 | 6.1/7.4 | In this work |
N2 adsorption isotherms for RFC and MC series are measured at 273 K and 298 K (Fig. 6a and b, S3a and b and S4d and e†). Unlike CH4 adsorption, which is well correlated with ultramicropore volumes, N2 adsorption is well correlated with the SSA (R2 = 0.95) of both carbon samples (Fig. 6f and S3f†). There is no relationship between surface polarity and N2 loading levels, which is probably ascribed to the moderate polarity of the carbon surface and small quadrupole moment of N2 (−4.72 × 10−40 cm2)2. The Qst values for RFC_C60 and MC_C55 are 5.7 and 5.4 kJ mol−1, respectively. Considering the nitrogen content of both carbons, 1.55 and 5.9 wt%, respectively, the polarity effect for N2 adsorption does not exist for either carbon series (Table 1).
All the CH4 and N2 isotherms were well fitted to Töth model (Fig. 6a and b and S3a and b†) and the parameters of the fitting are presented in Table S2.† The Töth model is a semi-empirical expression that effectively describes many systems with sub-monolayer coverage and presents correct behavior at both the low and high pressure ends, reducing deviation errors between experimental data and calculated values of adsorption equilibrium.44–49 It is noteworthy that the parameter n presents the system heterogeneity.22,44–49 If it the heterogeneity parameter n becomes unity, it is identical to the Langmuir model presenting homogeneous surface; in contrast, if this parameter is lower than unity, the more heterogeneous system is expected.44–46 According to the heterogeneity parameters of CH4 on the carbon samples (Table S2†), the values are in the range 0.5–0.67, inferring that the surface heterogeneity of carbon surfaces strongly favors CH4 adsorption.4,46,47 Since the carbon samples with highest CH4 uptake present lowest n values (0.5–0.52 for RFC_C60 and 0.51–0.54 for MC_C55), it turns out that the role ultramicroporosity is pivotal to enhance the CH4 uptake capacity. On the other hands, the values of heterogeneity parameters of N2 on the carbon samples (Table S2†) are closed to unity, suggesting the less interaction between N2 and the carbon surface.
The isosteric heat of adsorption (Qst) values of carbon samples also suggest the same trend (Table 1). Therefore, the development of ultramicropores is pivotal to enhance CH4 adsorption capacity at equilibrium adsorption under ambient conditions. To further elucidate the importance of ultramicropores for CH4 adsorption, CH4 adsorption capacities of both carbon samples are plotted with respect to accumulated ultramicropore volume (<0.7 nm and <1 nm) (Fig. 6e and S4a†).
Good correlation (R2 = 0.94) is obtained for accumulated ultramicropore volumes. In contrast, no correlation is obtained for accumulated pore volume up to 2 nm and SSA (Fig. S4b and c†), strongly indicating the importance of ultramicropore development. Such high correlation also indicates that polarity derived from N-doping on the carbon surface is not related to CH4 adsorption due to the nonpolar nature of CH4.1,2,17
The adsorption-based selectivities of CH4 over N2 for RFC and MC samples at 273 K and 298 K are calculated using the ratio of Henry's law constants derived from single gas isotherms (Tables 1 and S3†).
The selectivity trend at 298 K for RFC samples (RFC, RFC_C60, and C120) and MC samples (MC, MC_C55, and C125) is very similar to the CH4 uptake capacities, which are 4.2, 6.8, and 5.3, and 5.3, 7.4, and 6.0, respectively. A similar trend is also observed for selectivities measured at 273 K (Table 1). Higher CH4 adsorption capacity due to the development of more ultramicropores results in higher CH4 over N2 selectivity, suggesting that differences in CH4 adsorption capacities between carbons is more sensitive than differences in N2 adsorption.
This result is further identified as a difference in Henry's constants (Table S3†). The development of ultramicropores is not only helpful for enhanced CH4 adsorption but also for high selectivity of separating CH4 over N2. With its higher polarizability value, CH4 is more sensitively adsorbed within ultramicropores rather than the less polarizable N2.1,2,17 Ideal adsorption selectivities of 6.8 for RFC_C60 and 7.4 for MC_C55 at 298 K are ones of the highest values comparable with those of MOFs, MOPs, and carbonaceous materials (Table 2). With combining the superb CH4 uptake capacities, such ultrahigh selectivities of CO2-activated RFC and MC carbons are highly desirable for adsorption-based UCN upgrading.
3.3 Adsorption of heavy metal ions: role of SSA and polarity
In attempts to elucidate the role of SSA and polarity of carbons, adsorption of heavy metal ions (Fe2+, Sb3+, and Sb5+) is carried out using aqueous solutions at pH 5 under ambient condition. First, Fe2+ adsorption equilibrium isotherms for RFC samples (RFC, RFC_C60, C120, C250, and C380) and MC samples (MC, MC_C55, and C120) are measured as functions of time (Fig. 7a and b). The carbon samples of RFC, RFC_C60 and C120, MC, and MC_C55 reach adsorption equilibrium in less than 2 h. Conversely, RFC_C250, C380, and MC_C125 require more than 6 h for adsorption saturation, strongly indicating the relationship of adsorption capacity and porosity. Then, equilibrium isotherms are fitted with the Langmuir isotherm model26–30 (detailed parameters are explained in the Experimental section). | ||
| Fig. 7 Equilibrium isotherms of Fe ion adsorption of RFC (a) and MC (b) samples. Relationship plot of Fe ion adsorption capacities with respect to BET surface area (c). | ||
Obtained qm values from RFC samples are plotted with respect to SSA (Fig. 7c). A good relationship (R2 = 0.97) between the qm values and SSAs of RFC samples is identified, as has been reported in the literature.49–53 Thus, the superb qm value (101 mg g−1) for RFC_C390 is attributed to ultrahigh SSA of 3958 m2 g−1 derived from a prolonged CO2 activation process. When the qm vales of MC samples are compared with those of RFC samples, they are located on the upper region of the plotted line, indicating a good correlation of the qm values of RFC samples with SSA (Fig. 7c). According to nitrogen content and FT-IR analyses, surface polarity caused by N-doping is attributed to higher adsorption capacity of Fe2+ under ambient conditions.
Another adsorption experiment that evaluates the polarity effect of carbons for selective adsorption of Sb3+ over Sb5+ is also performed. The selective adsorption experiment for Sb3+ over Sb5+ is achieved using RFC_C60 and MC_C55 samples with similar SSAs but different nitrogen contents (Table 1). Equimolar amounts of 50 and 500 ppb of two Sb species are adsorbed on RFC_C60 and MC_C55 samples at pH 5. The adsorption capacities with associated selectivities for Sb3+ over Sb5+ of RFC_C60 and MC_C55 on different concentrations are plotted in Fig. 8a and b, respectively. The adsorption capacities for Sb3+ are very similar for both carbons, whereas the adsorption capacity trend for Sb5+ is quite different.
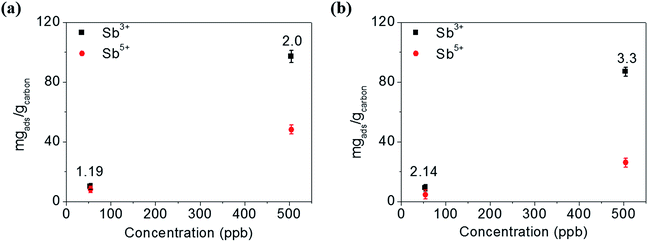 | ||
| Fig. 8 Selectivity of Sb3+/Sb5+ using RFC_C60 (a) and MC_C55 (b) at 50 and 500 ppb in pH 5 buffer solution. (Inset number in figure is Sb3+/Sb5+ selectivity). | ||
MC_C55 adsorbs substantially less Sb5+ than RFC_C60. Considering the charge characters of Sb species, Sb3+ (neutral charge as Sb(OH)3) and Sb5+ (negative charge as Sb(OH)6−), the different adsorption trends for Sb5+ are ascribed to the more basic MC_C55 preferentially adsorbing less negatively charged Sb5+ under the specific conditions. Therefore, the higher selectivity of MC_C55 compared to RFC_C60 of up to 3.3 for Sb3+ over Sb5+ is accomplished. This result indicates the role of polarity in selective adsorption of metal ions.
4. Conclusions
The role of porosity and polarity of carbonaceous materials for selective separation of CH4 over N2, adsorption of heavy metal ions, and selective adsorption of Sb species were elucidated using synthesized carbon spheres with different N-doping levels. Hot CO2 treatment allows fine-control of the PSA and SSA of RFC and highly N-doped MC samples. The development of ultramicropores is highly desirable for enhanced CH4 uptake regardless of the surface polarity of carbons, which eventually results in ultrahigh selectivity for CH4 over N2. The CH4 adsorption capacities of the most developed ultramicopores of RFC_C60 and MC_C55 are 2.64 and 2.41 mmol g−1 at 273 K (1 bar), respectively, and there carbons also have superb selectivities of CH4 over N2 of 6.8 and 7.1 at 298 K, respectively, which are ones of the best values for CH4 adsorbents. In addition, Fe2+ ion is more adsorbed on carbons with higher SSAs. N-doped MC samples present higher adsorption capacities over RFC samples. Higher selective adsorption for Sb3+ over Sb5+ is accomplished for the basic MC_C55 sample, strongly suggesting that the choice of carbon surface polarity is important for selective metal ion adsorption. Distinct correlations between porosity and polarity of carbons, adsorption capacities for CH4, ultrahigh selectivity for CH4 over N2, and metal ions are exclusively elucidated. The results provide design principles for nanoporous carbonaceous materials and use in specific adsorption applications.Conflicts of interest
There are no conflicts to declare.Acknowledgements
The authors thank Prof. H. Chun regarding CH 4 adsorption. This work was supported by the Korea Environmental Industry and Technology Institute (KEITI, No. 2016000200005).References
- J. A. Delgado, M. A. Uguina, J. L. Sotelo and B. Ruiz, Sep. Purif. Technol., 2006, 50, 192–203 CrossRef CAS.
- B. Yuan, X. Wu, Y. Chen, J. Huang, H. Luo and S. Deng, Environ. Sci. Technol., 2013, 47, 5474–5480 CrossRef CAS PubMed.
- M. S. A. Baksh, R. T. Yang and D. D. L. Chung, Carbon, 1989, 27, 931–934 CrossRef CAS.
- J. Cai, J. Qi, C. Yang and X. Zhao, ACS Appl. Mater. Interfaces, 2014, 6, 3703–3711 CAS.
- X. Xu, X. Zhao, L. Sun and X. Liu, J. Nat. Gas Chem., 2008, 17, 391–396 CrossRef CAS.
- N. K. Jensen, T. E. Rufford, G. Watson, D. K. Zhang, K. I. Chan and E. F. May, J. Chem. Eng. Data, 2011, 57, 106–113 CrossRef.
- J. Hu, T. Sun, X. Liu, Y. Guo and S. Wang, RSC Adv., 2016, 6, 64039–64046 RSC.
- X. Ren, T. Sun, J. Hu and S. Wang, Microporous Mesoporous Mater., 2014, 186, 137–145 CrossRef CAS.
- J. Möllmer, M. Lange, A. Möller, C. Patzschke, K. Stein, D. Lässig, J. Lincke, R. Gläser, H. Krautscheid and R. Staudt, J. Mater. Chem., 2012, 22, 10274–10286 RSC.
- Y.-X. Hu, S.-C. Xiang, W.-W. Zhang, Z.-X. Zhang, L. Wang, J.-F. Bai and B. Chen, Chem. Commun., 2009, 7551–7553 RSC.
- M. Saleh, H. M. Lee, K. C. Kemp and K. S. Kim, ACS Appl. Mater. Interfaces, 2014, 6, 7325–7333 CAS.
- A. Olajossy, A. Gawdzik, Z. Budner and J. Dula, Chem. Eng. Res. Des., 2003, 81, 474–482 CrossRef CAS.
- H. Yi, F. Li, P. Ning, X. Tang, J. Peng, Y. Li and H. Deng, Chem. Eng. J., 2013, 215, 635–664 CrossRef.
- R. T. Yang, Adsorbents: fundamentals and applications, John Wiley & Sons, 2003 Search PubMed.
- R. T. Yang, Gas separation by adsorption processes, Butterworth-Heinemann, 2013 Search PubMed.
- D. M. Ruthven, Chem. Eng. Technol., 2011, 83, 44–52 CAS.
- S. Ma and H.-C. Zhou, Chem. Commun., 2010, 46, 44–53 RSC.
- D. Lässig, J. Lincke, J. Moellmer, C. Reichenbach, A. Moeller, R. Gläser, G. Kalies, K. A. Cychosz, M. Thommes and R. Staudt, Angew. Chem., Int. Ed., 2011, 50, 10344–10348 CrossRef PubMed.
- Y. Li, T. Ben, B. Zhang, Y. Fu and S. Qiu, Sci. Rep., 2013, 3, 2420–2425 CrossRef PubMed.
- L. Bastin, P. S. Bárcia, E. J. Hurtado, J. A. Silva, A. E. Rodrigues and B. Chen, J. Phys. Chem. C, 2008, 112, 1575–1581 CAS.
- B. Liu and B. Smit, Langmuir, 2009, 25, 5918–5926 CrossRef CAS PubMed.
- Y. Zhu, H. Long and W. Zhang, Chem. Mater., 2013, 25, 1630–1635 CrossRef CAS.
- B. Liu and B. Smit, J. Phys. Chem. C, 2010, 114, 8515–8522 CAS.
- E. Haldoupis, S. Nair and D. S. Sholl, J. Am. Chem. Soc., 2012, 134, 4313–4323 CrossRef CAS PubMed.
- B. Ashourirad, A. K. Sekizkardes, S. Altarawneh and H. M. El-Kaderi, Chem. Mater., 2015, 27, 1349–1358 CrossRef CAS.
- X. Luo, X. Lei, N. Cai, X. Xie, Y. Xue and F. Yu, ACS Sustainable Chem. Eng., 2016, 4, 3960–3969 CrossRef CAS.
- B. Yang, C. Yu, Q. Yu, X. Zhang, Z. Li and L. Lei, RSC Adv., 2015, 5, 7182–7191 RSC.
- X. Li, H. Zhou, W. Wu, S. Wei, Y. Xu and Y. Kuang, J. Colloid Interface Sci., 2015, 448, 389–397 CrossRef CAS PubMed.
- G.-X. Yang and H. Jiang, Water Res., 2014, 48, 396–405 CrossRef CAS PubMed.
- Z. Zhang, Z. Dong, Y. Dai, S. Xiao, X. Cao, Y. Liu, W. Guo, M. Luo and Z. Le, RSC Adv., 2016, 6, 102462–102471 RSC.
- K. Simeonidis, V. Papadopoulou, S. Tresintsi, E. Kokkinos, I. A. Katsoyiannis, A. I. Zouboulis and M. Mitrakas, Sustainability, 2017, 9, 238 CrossRef.
- X. Guo, Z. Wu, M. He, X. Meng, X. Jin, N. Qiu and J. Zhang, J. Hazard. Mater., 2014, 276, 339–345 CrossRef CAS PubMed.
- A. Sarı, G. N. R. Şahinoğlu and M. Tüzen, Ind. Eng. Chem. Res., 2012, 51, 6877–6886 CrossRef.
- U. EPA, US Environmental Protection Agency, Washington, DC, EPA, 2006.
- S. Risica and S. Grande, RAPPORTI ISTISAN, 2000.
- M. Krachler, H. Emons and J. Zheng, Trends Anal. Chem., 2001, 20, 79–90 CrossRef CAS.
- L. Nemes and L. Bulgariu, Open Chem., 2016, 14, 175–187 Search PubMed.
- J. Liu, S. Z. Qiao, H. Liu, J. Chen, A. Orpe, D. Zhao and G. Q. M. Lu, Angew. Chem., Int. Ed., 2011, 50, 5947–5951 CrossRef CAS PubMed.
- H. S. Kim, M. S. Kang and W. C. Yoo, J. Phys. Chem. C, 2015, 119, 28512 CAS.
- K.-Y. Ju, Y. Lee, S. Lee, S. B. Park and J.-K. Lee, Biomacromolecules, 2011, 12, 625–632 CrossRef CAS PubMed.
- N. P. Wickramaratne and M. Jaroniec, ACS Appl. Mater. Interfaces, 2013, 5, 1849–1855 CAS.
- M. Kim, H. S. Kim, S. J. Yoo, W. C. Yoo and Y.-E. Sung, J. Mater. Chem. A, 2017, 5, 4199–4206 CAS.
- N. P. Wickramaratne, J. Xu, M. Wang, L. Zhu, L. Dai and M. Jaroniec, Chem. Mater., 2014, 26, 2820–2828 CrossRef CAS.
- D. D. Do, Adsorption Analysis: Equilibria and Kinetics: (With CD Containing Computer Matlab Programs), World Scientific, 1998 Search PubMed.
- S. Loh, K. A. Rahman, A. Chakraborty, B. B. Saha, Y. S. Choo, B. C. Khoo and K. C. Ng, J. Chem. Eng. Data, 2010, 55, 2840–2847 CrossRef.
- D. P. Vargas, L. Giraldo and J. C. Moreno-Pirajan, Int. J. Mol. Sci., 2012, 13, 8388–8397 CrossRef CAS PubMed.
- A. P. Terzyk, J. Chatlas, P. A. Gauden, G. Rychlicki and P. Kowalczyk, J. Colloid Interface Sci., 2003, 266, 473–476 CrossRef CAS PubMed.
- D. Park, Y. Moon, H. Kim, H. Ahn and C. Lee, Adsorption, 2014, 20, 631–647 CrossRef.
- Y. Ying, A. M. Ribeiro, L. Ping, J. G. Yu and A. E. Rodrigues, Ind. Eng. Chem. Res., 2014, 53, 16840–16850 CrossRef.
- K. Kadirvelu and C. Namasivayam, Adv. Environ. Res., 2003, 7, 471–478 CrossRef CAS.
- M. Prasad, S. Saxena and S. Amritphale, Ind. Eng. Chem. Res., 2002, 41, 105–111 CrossRef CAS.
- I. E. M. Carpio, J. D. Mangadlao, H. N. Nguyen, R. C. Advincula and D. F. Rodrigues, Carbon, 2014, 77, 289–301 CrossRef.
- M. Myglovets, O. Poddubnaya, O. Sevastyanova, M. E. Lindström, B. Gawdzik, M. Sobiesiak, M. Tsyba, V. Sapsay, D. Klymchuk and A. Puziy, Carbon, 2014, 80, 771–783 CrossRef CAS.
Footnote |
| † Electronic supplementary information (ESI) available. See DOI: 10.1039/c7ra09360h |
| This journal is © The Royal Society of Chemistry 2017 |


