 Open Access Article
Non-isothermal crystallization kinetics of ramie fiber-reinforced polylactic acid biocomposite
Xing Jina,
Xie Chena,
Qian Chenga,
Naiwen Zhangb,
Shenyang Caia and
Jie Ren *a
*a
aInstitute of Nano and Bio-Polymeric Materials, Key Laboratory of Advanced Civil Engineering Materials (Tongji University), Ministry of Education, School of Material Science and Engineering, Tongji University, Shanghai 201804, China. E-mail: renjie6598@163.com; Fax: +86-21-69580234; Tel: +86-21-69580234
bShanghai Tong-Jie-Liang Biomaterials Co. Ltd., Shanghai 200438, China
First published on 27th September 2017
Abstract
Ramie fiber (RF) reinforced polylactic acid (PLA) laminated biocomposite was prepared by hot-press molding using the non-woven ramie fibers and short PLA fibers. To understand the effect of ramie fibers on the crystallization behaviors of PLA, we study the non-isothermal crystallization kinetics of pure PLA and PLA/RF biocomposite. The crystallization behaviors of pure PLA and PLA/RF biocomposite with 40 wt% non-woven ramie fibers first were determined by differential scanning calorimetry (DSC). The results show that the addition of the RF could propel the crystallization process of PLA, during which the RF played a role in heterogeneous nucleation. Then, we used several models to analyze the crystallization behaviors during cold crystallization of PLA and PLA/RF biocomposite. The Jeziorny model for non-isothermal crystallization kinetics indicated that the crystallization process of PLA and PLA/RF biocomposite could be divided into two stages, and the addition of RF would not change the crystallization mechanism of PLA compared with that of pure PLA, which also was confirmed by the combination model of Ozawa equation and Avrami equation. In addition, the Doyle–Ozawa model's results revealed that when the relative crystallinity increased, the local apparent activation energy of PLA and PLA/RF biocomposite showed a gentle downward trend, and the average local activation energy was consistent with the apparent activation energy. In general, the addition of RF weakened the interaction between PLA chains and reduced the energy barrier of PLA in the crystallization process for the ramie fiber-reinforced PLA biocomposite.
1. Introduction
Polylactic acid (PLA) as an environmentally friendly, renewable, biodegradable polymer with good mechanical properties has been widely used in many fields, such as packaging, in disposable supplies, garments, medical devices, agriculture and automobiles.1–4 However, the large-scale applications of PLA are still limited by its inherent properties, such as lack of toughness, low heat deflection temperature (HDT), and low thermal stability. The weaknesses of PLA are mainly due to the slow crystallization rate of PLA. The presence of a large amount of methyl groups on the PLA backbone reduces the symmetry of polymer chains. In addition, the active oxygen atoms in carbonyl groups are prone to hydrogen bonding, thus limiting the diffusion ability of the polymer chains and leading to poor crystallization ability. Therefore, studies on crystallization mechanism of PLA will be beneficial to improve its crystallization in order to make up for the limits of PLA and broaden the application fields of PLA further. Compared with the isothermal crystallization conditions, the non-isothermal crystallization conditions are much closer to the real industrial processing conditions of PLA, such as extrusion, and molding. During the past years, studies on the PLA crystallization have attracted great interests, particularly in the field of dynamic parameters of PLA in cold crystallization.5,6 However, the study on the non-isothermal crystallization kinetics of PLA in the cold crystallization process is rarely reported.Fiber reinforcement is an effective approach for improving the mechanical properties and thermal stability of polymer materials. Natural fibers, as a type of ideal replacement for the traditional synthetic fibers, possessing outstanding mechanical properties, excellent biodegradability, low density and price, have been increasingly used as reinforcement in composites. Among them, ramie fiber (RF) is particularly prominent because it provides the best heat resistance and superior tensile strength and modulus compared to that of jute, flax, hemp, and sisal.7–9 Our previous studies have indicated that the green biocomposites with natural RF reinforcement and biodegradable PLA resin matrix can be prepared by adding ramie short fibers or fabrics into PLA using the two-roll mill or hot compression molding technique.10–13 The obtained PLA/RF biocomposites show much increased mechanical properties, such as tensile, flexural and impact strength, relative to that of pure PLA.
In addition, the natural fiber was also reported to play a role in heterogeneous nucleation in the PLA crystallization process.14,15 Our recent study reveals that the addition of RF accelerates the crystallization rate of PLA and improves the thermal stability of PLA biocomposites.16 The cold crystallization temperature of PLA/RF biocomposite is slightly lower than that of neat PLA. Thus, the PLA/RF biocomposite has a quicker start of crystallization than that of neat PLA. Furthermore, the heat deflection temperature of PLA/RF biocomposites can be improved remarkably by further heat treatment.
In this study, the crystallization mechanism and crystallization activation energy of pure PLA and PLA/40 wt% non-woven ramie composites (PLA/RF) during cold crystallization were analyzed via Jeziorny, Avrami, Ozawa, Kissinger and other models. The effect of RF on the crystallization behaviors of PLA is discussed, as well.
2. Experimental
2.1. Materials
Ramie fiber was supplied by Jintan Jinlan Ramie Fiber Factory (Jiangsu, China). PLA short fiber (length 51 mm and linear density 6 dtex) was obtained from Shanghai Tong-Jie-Liang Biomaterials Co., Ltd. (China). The needle punched non-woven PLA (surface density 20 g m−2) and needle punched non-woven PLA/RF (surface density 200–300 g m−2) with 40 wt% ramie fiber were provided by the Textile Experiment Center of Donghua University. The preparation of non-woven PLA/RF and PLA both followed certain steps: mixing, opening, carding, cross paving and needle punching. For non-woven PLA, the needle punching thickness was about 0.2–0.5 mm, whereas for non-woven PLA/RF, it was about 1.5–2 mm. In addition, for the non-woven PLA/RF, the RF was cut into 50 mm length short pieces before use, and the weight ratio of PLA short fiber and RF was controlled to 60![[thin space (1/6-em)]](https://www.rsc.org/images/entities/char_2009.gif) :
:![[thin space (1/6-em)]](https://www.rsc.org/images/entities/char_2009.gif) 40 before mixing. The PLA non-woven sheets were cut into desired sizes and shapes for evaluation.
40 before mixing. The PLA non-woven sheets were cut into desired sizes and shapes for evaluation.
2.2. Fabrication of the laminated PLA/RF biocomposite
The non-woven PLA/RF was dried in a vacuum drying oven at 60 °C for 24 h before use to ensure that all the absorbed moisture was removed. Pre-drying was to prevent void formation during the hot-press process. The multilayer non-woven stacking and hot-press molding were applied to prepare the PLA/RF biocomposite, as shown in Scheme 1. The lay-ups were first preheated at 175 °C and 1 MPa for 10 min, hot-pressed into sheets at 5 MPa for 5 min, and then cooled to room temperature at 5 MPa. The obtained composites were cut into desired sizes and shapes for evaluation.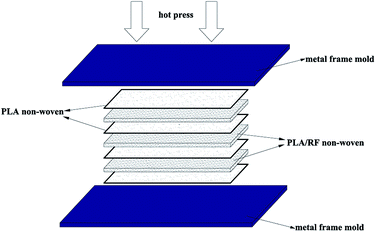 | ||
| Scheme 1 The multilayer non-woven stacking and compression molding procedure of the PLA/RF composites' preparation. | ||
2.3. Differential scanning calorimetry (DSC)
DSC measurements were performed on a Q100 thermal analysis system (Tainstsh, USA). First, the PLA and PLA/RF samples were heated to 200 °C at a rate of 20 °C min−1 and incubated for 3 min. Then, the samples were cooled to room temperature at a rate of 10 °C min−1, followed by incubating for 1 min. After that, the samples were separately heated to 200 °C at a rate of 5 °C min−1, 10 °C min−1, 15 °C min−1 and 20 °C min−1. Experiments were carried out under nitrogen flow (30 mL min−1). The weight of all samples was kept between 5 mg and 10 mg.3. Results and discussion
3.1. Non-isothermal crystallization behaviors of PLA and PLA/RF biocomposites
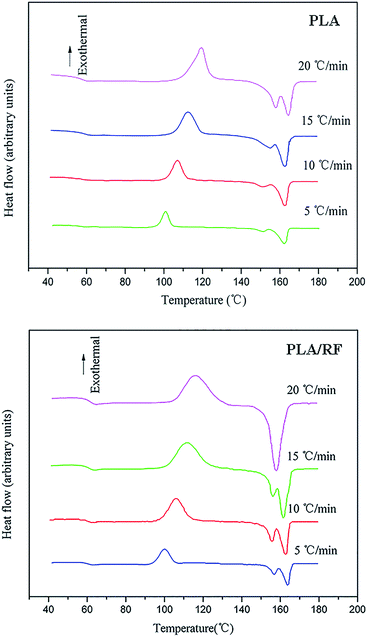
DSC second heating curves of PLA and the PLA/RF biocomposite at different heating rates are shown in Fig. 1. Generally speaking, during non-isothermal crystallization of polymers, the crystallization temperature varies over time due to different heating rates, and the DSC curves fluctuate with the change of heating rates. For pure PLA, the crystallization exothermic peaks drifted toward the high temperature as the heating rate increased. When the heating rates varied from 5 °C min−1 to 20 °C min−1, the values of peak temperature (Tp) corresponding to the crystallization exothermic peaks of PLA were 101.0 °C, 107.1 °C, 112.4 °C and 119.3 °C. In addition, the initial or starting crystallization temperatures (Ts) of PLA were 93.4 °C, 95.6 °C, 97.2 °C and 101.8 °C. The results illustrate that the non-isothermal crystallization behavior of PLA depends significantly on the heating rate, and the increase of the heating rate leads to the retardation of crystallization initiation. The non-isothermal crystallization of the PLA/RF biocomposite was similar to that of PLA, and its Tp values increased with the increase in heating rates from 100.1 °C, to 105.9 °C, 111.8 °C, and 118.2 °C and the Ts were 92.2 °C, 94.0 °C, 96.8 °C and 98.2 °C, respectively.On comparing the values of Tp and Ts of PLA and PLA/RF biocomposites, it can be found that the addition of RF accelerates the crystallization process of PLA, which is related to the interaction between polymer chains. For the pure PLA system, the interaction between the polymer chains is strong, and the energy barrier required to overcome in the formation of ordered lattice is also large. However, the addition of RF destroys the tight contact between the PLA chains and enhances the activity capacity of polymer chain segments, thus making the formation of crystals easier.
3.2. The crystallization mechanism of the PLA and PLA/RF biocomposites
Fig. 2 shows crystallized fraction percentage over time at different heating rates of PLA and PLA/RF biocomposites. In the study of the crystallization mechanism of the materials, the Johnson–Mehl–Avrami (JMA) equation17,18 is usually applied for quantitative analysis. However, the JMA equation is an analytical method in the isothermal crystallization process, and it is not applicable for non-isothermal crystallization. Afterwards, Jeziorny19 successfully modified and applied the JMA equation to the non-isothermal crystallization process.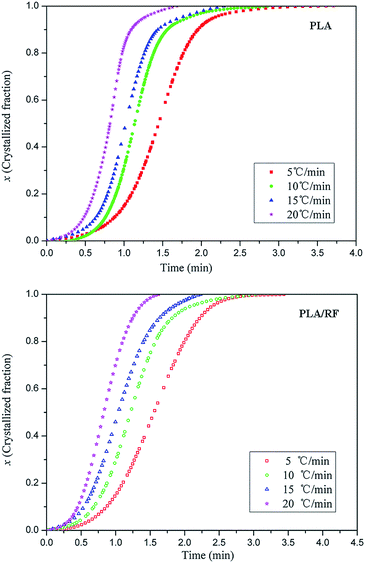 | ||
| Fig. 2 Crystallized fraction percentage of pure PLA and PLA/RF biocomposites as a function of time at different heating rates. | ||
Avrami equation is shown in eqn (1):
| 1 − x = exp(−Zttn) | (1) |
On taking logarithm on both sides of the eqn (1), we get eqn (2):
lg[−ln(1 − x)] = n![[thin space (1/6-em)]](https://www.rsc.org/images/entities/char_2009.gif) lg lg![[thin space (1/6-em)]](https://www.rsc.org/images/entities/char_2009.gif) t + lg t + lg![[thin space (1/6-em)]](https://www.rsc.org/images/entities/char_2009.gif) Zt Zt
| (2) |
The Jeziorny model takes the heating rate as the correction value of the crystallization rate constant, and the modified expression is eqn (3):
 | (3) |
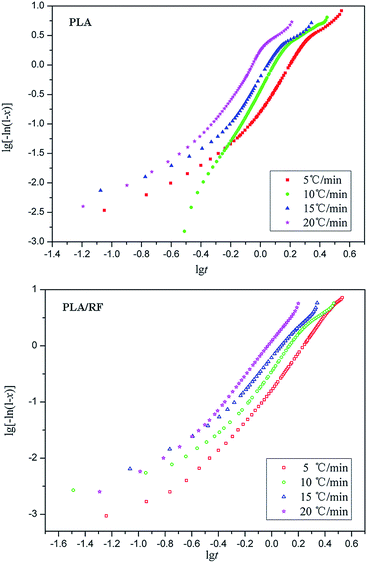
Therefore, the Avrami constant (n) and the crystallization rate constant (Zc) can be obtained via the slope and intercept by the linear fitting method (lg[−ln(1 − x)] vs. lg![[thin space (1/6-em)]](https://www.rsc.org/images/entities/char_2009.gif) t, as shown in Fig. 3) and in conjunction with the curve of relative crystallinity over time of PLA and PLA/RF biocomposites, as displayed in Table 1.
t, as shown in Fig. 3) and in conjunction with the curve of relative crystallinity over time of PLA and PLA/RF biocomposites, as displayed in Table 1.
| β (°C min−1) | Primary stage | Secondary stage | |||
|---|---|---|---|---|---|
| n1 | Zc1 | n2 | Zc2 | ||
| PLA | 5 | 3.55 | 0.713 | 1.89 | 0.928 |
| 10 | 4.31 | 0.908 | 1.66 | 1.009 | |
| 15 | 3.68 | 0.969 | 1.76 | 1.011 | |
| 20 | 3.35 | 1.018 | 1.94 | 1.033 | |
| PLA/RF | 5 | 2.93 | 0.716 | 2.68 | 0.779 |
| 10 | 3.56 | 0.907 | 1.75 | 0.980 | |
| 15 | 2.92 | 0.963 | 2.20 | 0.984 | |
| 20 | 3.43 | 1.009 | 2.92 | 1.010 | |
As shown in Fig. 3, each fitting curve can be roughly divided into two stages with different slopes, which is called an initial stage and subsequent stage. The inflection points of the curves occur when the relative crystallinity of the samples is approximately 80%. The deviation phenomenon of the fitting curve is also reported in other literature.20,21 The fitting lines are roughly parallel with each other at each stage of the curve, and the fitting straight line is shifted to the direction of time decreasing as the heating rate increases, which means that the crystal nucleation mechanism and growth morphology of PLA and PLA/RF are similar at different heating rates.
For PLA, the average Avrami constant of the initial phase (n1) is 3.72, whereas that of the subsequent phase (n2) is 1.8. The Avrami constant is a constant based on the crystallization mechanism.22 The above data indicate that the crystallization mechanisms of PLA in the initial and subsequent stages are different, and the dynamics of the crystal growth mechanism transformation comes from the spherulitic collision.23
During the initial stage, the number of complete spherulites in the material system is small, resulting in a lower nucleation rate. When the relative crystallinity reaches to about 80%, the crystallization enters the subsequent stage, and the Avrami constant decreases significantly. This is because the growth of the crystal at this stage is the diffusion control type that is not conducive to secondary crystallization. Because the nucleation rate of the subsequent stage is low and the crystallization is not sufficient, it is easy for PLA products to continue crystallization in practical use and result in a change in product performance. Therefore, in order to obtain better performance and stable products, an annealing process is often applied in the follow-up process. The heat treatment process can promote secondary crystallization and maximize the degree of crystallization. For the PLA/RF biocomposite, the average Avrami constants n1 and n2 are 3.21 and 2.39 in the initial and subsequent stages, respectively. Therefore, the addition of RF does not change the crystallization mechanism of PLA. As can be seen from Table 1, the increase in the heating rate can enhance the crystallization rate to a certain extent, and the addition of RF has little effect on the crystallization rate.
Ozawa24 proposed another analytical model to describe the crystallization behavior, as eqn (4):
 | (4) |
On taking logarithm of both sides of the eqn (4), we get eqn (5):
lg[−ln(1 − x)] = lg![[thin space (1/6-em)]](https://www.rsc.org/images/entities/char_2009.gif) P(T) − m P(T) − m![[thin space (1/6-em)]](https://www.rsc.org/images/entities/char_2009.gif) lg lg![[thin space (1/6-em)]](https://www.rsc.org/images/entities/char_2009.gif) β β
| (5) |
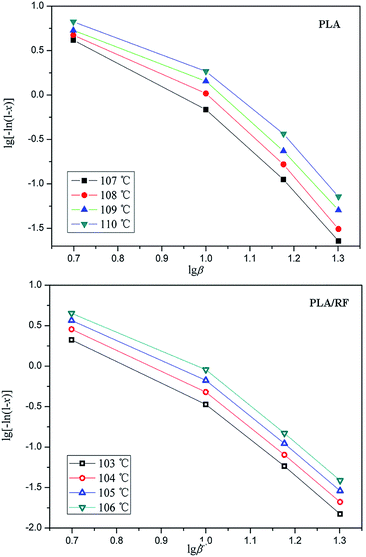
Fig. 4 demonstrates the crystallized fraction percentage trends of PLA and PLA/RF biocomposites changing with temperature at different heating rates. Combined with eqn (5), the relative crystallinity of PLA at four temperature points was selected to make the lg[−ln(1 − x)] vs. lg![[thin space (1/6-em)]](https://www.rsc.org/images/entities/char_2009.gif) β diagram, as shown in Fig. 5. Clearly, the linear fit of the Ozawa model is terrible, which is reported by others25 as well, meaning that the Ozawa model is not accurate in the analysis of non-isothermal crystallization behavior of PLA. This is because the Ozawa model simplifies the crystallization behavior in the material system and ignores the existence of spherulitic collision and secondary crystallization, leading to the diagram of lg[−ln(1 − x)] vs. lg
β diagram, as shown in Fig. 5. Clearly, the linear fit of the Ozawa model is terrible, which is reported by others25 as well, meaning that the Ozawa model is not accurate in the analysis of non-isothermal crystallization behavior of PLA. This is because the Ozawa model simplifies the crystallization behavior in the material system and ignores the existence of spherulitic collision and secondary crystallization, leading to the diagram of lg[−ln(1 − x)] vs. lg![[thin space (1/6-em)]](https://www.rsc.org/images/entities/char_2009.gif) β that deviates from the linear relationship.26,27
β that deviates from the linear relationship.26,27
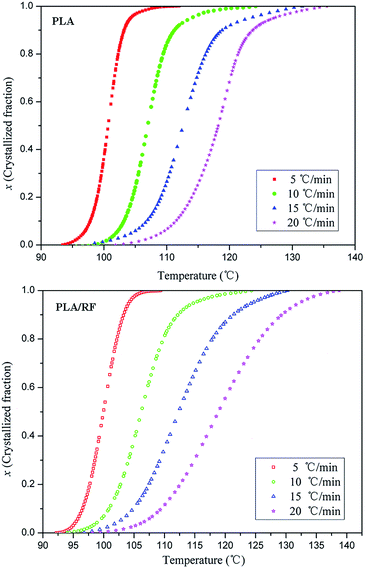 | ||
| Fig. 4 Crystallized fraction percentage of PLA and PLA/RF biocomposites as a function of temperature at different heating rates. | ||
It has been found that the study of non-isothermal crystallization behavior will be more accurate when the Avrami equation is introduced into the Ozawa model, thus we can get a new eqn (6):
lg![[thin space (1/6-em)]](https://www.rsc.org/images/entities/char_2009.gif) β = lg β = lg![[thin space (1/6-em)]](https://www.rsc.org/images/entities/char_2009.gif) F(T) − α F(T) − α![[thin space (1/6-em)]](https://www.rsc.org/images/entities/char_2009.gif) lg lg![[thin space (1/6-em)]](https://www.rsc.org/images/entities/char_2009.gif) t t
| (6) |
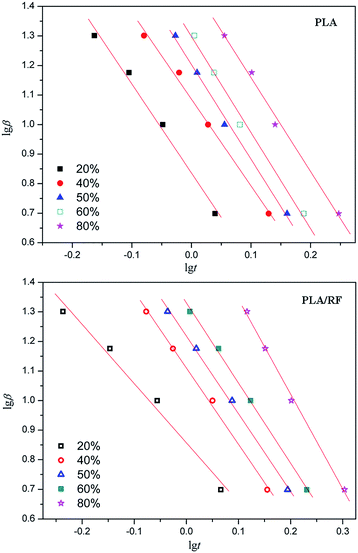
Fig. 6 shows lg![[thin space (1/6-em)]](https://www.rsc.org/images/entities/char_2009.gif) β vs. lg
β vs. lg![[thin space (1/6-em)]](https://www.rsc.org/images/entities/char_2009.gif) t linear fitting relationship for PLA and PLA/RF biocomposites. Compared with Fig. 5, the fitting degree in Fig. 6 is obviously better, and the calculated kinetic parameters are more accurate. Therefore, the combination model of Ozawa equation and Avrami equation can support the crystallization behavior research of PLA and PLA/RF biocomposites. We converted the slope and intercept of the straight line in Fig. 6 into the kinetic parameters F(T) and α, and summarized the values in Table 2. It can be seen that, with the relative crystallinity changing from 20% to 80%, the crystallization rate of the material decreases, and the F(T) and α values of PLA and PLA/RF are relatively close, indicating that the addition of RF has not changed the crystallization mechanism of PLA material, which is consistent with the analysis of the abovementioned Jeziorny model.
t linear fitting relationship for PLA and PLA/RF biocomposites. Compared with Fig. 5, the fitting degree in Fig. 6 is obviously better, and the calculated kinetic parameters are more accurate. Therefore, the combination model of Ozawa equation and Avrami equation can support the crystallization behavior research of PLA and PLA/RF biocomposites. We converted the slope and intercept of the straight line in Fig. 6 into the kinetic parameters F(T) and α, and summarized the values in Table 2. It can be seen that, with the relative crystallinity changing from 20% to 80%, the crystallization rate of the material decreases, and the F(T) and α values of PLA and PLA/RF are relatively close, indicating that the addition of RF has not changed the crystallization mechanism of PLA material, which is consistent with the analysis of the abovementioned Jeziorny model.
| Sample | Relative crystallinity | |||||
|---|---|---|---|---|---|---|
| 20% | 40% | 50% | 60% | 80% | ||
| PLA | F(T) | 6.85 | 12.18 | 15.96 | 19.86 | 29.94 |
| α | 3.01 | 2.94 | 3.21 | 3.25 | 3.17 | |
| PLA/RF | F(T) | 7.20 | 12.89 | 16.52 | 21.41 | 46.00 |
| α | 2.50 | 2.78 | 3.13 | 2.91 | 3.21 | |
3.3. The crystallization activation energy calculation of PLA and PLA/RF biocomposites
The crystallization process of the polymer is a complex reaction process; generally, the apparent activation energy is used to describe the overall characteristics of polymers in crystallization process, and its most commonly utilized formula is the Kissinger equation:28
 | (7) |
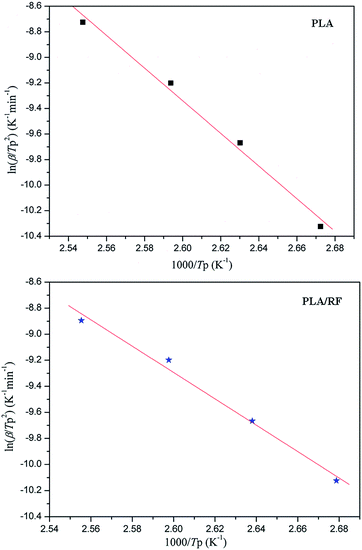
According to the Kissinger equation, combining the data of thermal analysis, we obtained the ln(β/Tp2) vs. 1000/Tp2 relationship of PLA and PLA/RF biocomposites, as shown in Fig. 7. Table 3 shows the data that convert the line fitting to apparent activation energy. We can observe that the addition of RF reduces the apparent crystallization activation energy in the process of PLA crystallization from 106.265 kJ mol−1 to 84.120 kJ mol−1, which indicates that the RF can reduce the energy barrier in the PLA crystallization process and be conducive to crystallization. This is consistent with the results obtained in Fig. 1, the RF, acting as polymer nucleating agent, advances the crystallization initiation time.29
| Sample | Slope | Apparent activation energy (kJ mol−1) |
|---|---|---|
| PLA | −12.7815 | 106.265 |
| PLA/RF | −10.1179 | 84.120 |
However, the apparent activation energy cannot express the crystallization behavior of a certain step in the crystallization process; hence, the Doyle–Ozawa model30,31 is usually used to calculate the local activation energy, as shown in expression (8):
lg![[thin space (1/6-em)]](https://www.rsc.org/images/entities/char_2009.gif) β = −2.315 − 0.4567E(x)(RT)−1 + lg β = −2.315 − 0.4567E(x)(RT)−1 + lg![[thin space (1/6-em)]](https://www.rsc.org/images/entities/char_2009.gif) AE(x)[Rf(x)]−1 AE(x)[Rf(x)]−1
| (8) |
According to the Doyle–Ozawa model, a plot of ln![[thin space (1/6-em)]](https://www.rsc.org/images/entities/char_2009.gif) β vs. 1/T was obtained regarding a given relative crystallinity calculated from PLA and PLA/RF thermal analysis data (as shown in Fig. 8). Moreover, the slope of each line fitting was converted into local activation energy and is summarized in Fig. 9.
β vs. 1/T was obtained regarding a given relative crystallinity calculated from PLA and PLA/RF thermal analysis data (as shown in Fig. 8). Moreover, the slope of each line fitting was converted into local activation energy and is summarized in Fig. 9.
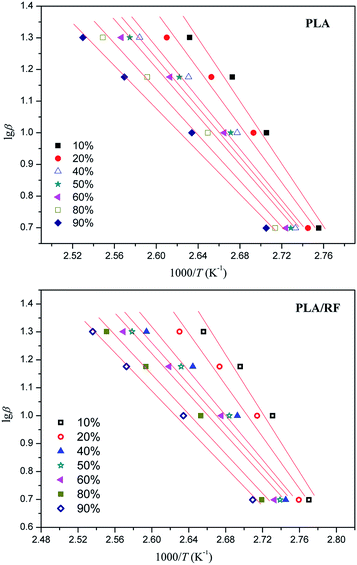 | ||
Fig. 8 The ln![[thin space (1/6-em)]](https://www.rsc.org/images/entities/char_2009.gif) β vs. 1/T diagram for PLA and PLA/RF biocomposites at different relative crystallinity degrees. β vs. 1/T diagram for PLA and PLA/RF biocomposites at different relative crystallinity degrees. | ||
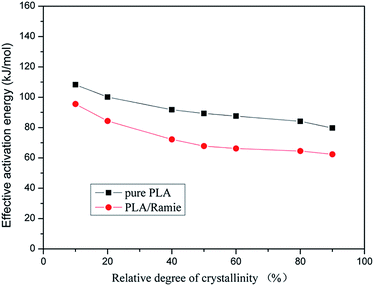 | ||
| Fig. 9 Comparison of the local activation energy of PLA and PLA/RF biocomposites at different relative crystallinity degrees. | ||
Fig. 9 shows that the local activation energy of PLA and PLA/RF is consistent with the variation in crystallinity, and the former has a slowdown trend with the increase of relative crystallinity. The average local activation energy of PLA and PLA/RF is 91.562 kJ mol−1 and 73.292 kJ mol−1, respectively, which is in accordance with the calculated results of apparent activation energy, indicating that the addition of RF could reduce the energy barrier in the crystallization process of PLA.
4. Conclusions
Polylactic acid/ramie fiber laminated biocomposite based on the non-woven RF and PLA short fibers has been successfully prepared through hot-press molding. Differential scanning calorimetry was used to study the non-isothermal crystallization kinetics of pure PLA and PLA/RF biocomposites with 40 wt% ramie fiber. The results determined that the addition of the RF could propel the crystallization process of PLA, during which the RF played a role in heterogeneous nucleation. Furthermore, Jeziorny, Avrami, Ozawa, Kissinger and other models were used to investigate the crystallization mechanism and crystallization kinetics parameters of PLA and PLA/RF biocomposites, respectively. The Jeziorny model indicated that the crystallization process of PLA and PLA/RF biocomposites could be divided into two stages. Moreover, the Jeziorny and Ozawa–Avrami models both confirmed that the addition of RF did not change the crystallization mechanism of PLA compared with that of pure PLA. In addition, the Doyle–Ozawa model's results revealed that the addition of RF weakened the interaction between PLA chains and reduced the energy barrier of PLA in the crystallization process for the ramie fiber-reinforced PLA materials, which could benefit the comprehensive performance of the PLA/RF biocomposite.Conflicts of interest
There are no conflicts to declare.Acknowledgements
This study was financially supported by the Shanghai Automotive Industry Science and Technology Development Foundation (Grant No. 1006), the National High-Tech R&D Program of China (No. 2013AA032202), the National Natural Science Foundation of China (No. 51203118), the Fundamental Research Funds for the Central Universities and the Open Funds for Characterization of Tongji University.Notes and references
- B. Gupta, N. Revagade and J. Hilborn, Prog. Polym. Sci., 2007, 32, 455–482 CrossRef CAS.
- F. F. Lu, H. Yu, C. Yan and J. M. Yao, RSC Adv., 2016, 6, 46008–46018 RSC.
- J. Li, J. Li, D. Feng, J. Zhao, J. Sun and D. Li, RSC Adv., 2017, 7, 28889–28897 RSC.
- Y. Kikkawa, H. Abe, T. Iwata, Y. Inoue and Y. Doi, Biomacromolecules, 2002, 3, 350–356 CrossRef CAS PubMed.
- C. L. Li and Q. Dou, Polym. Adv. Technol., 2015, 26, 376–384 CrossRef CAS.
- H. W. Xiao, L. Peng, X. Ren, J. Tao and J. T. Yeh, J. Appl. Polym. Sci., 2010, 118, 3558–3569 CrossRef CAS.
- Y. Yin, Y. Wang, Y. Liu, G. Zeng, X. Hu and X. Hu, RSC Adv., 2015, 5, 47584–47591 RSC.
- M. T. Zafar, S. N. Maiti and A. K. Ghosh, RSC Adv., 2016, 6, 73373–73382 RSC.
- G. Koronis, A. Silva and M. Fontul, Composites, Part B, 2013, 44, 120–127 CrossRef CAS.
- T. Yu, J. Ren and S. M. Li, Composites, Part A, 2010, 41, 499–505 CrossRef.
- D. K. Chen, J. Li and J. Ren, Polym. Adv. Technol., 2012, 23, 198–207 CrossRef.
- D. K. Chen, J. Li and J. Ren, Mater. Chem. Phys., 2011, 126, 524–531 CrossRef CAS.
- D. K. Chen, J. Li and J. Ren, Composites, Part A, 2010, 41, 1012–1018 CrossRef.
- Y. M. Wang, B. B. Tong, S. J. Hou, M. Li and C. Shen, Composites, Part A, 2011, 42, 66–74 CrossRef.
- M. Y. Hao, H. W. Wu and Z. H. Zhu, RSC Adv., 2017, 7, 32399–32412 RSC.
- X. Chen, J. Ren, N. Zhang, S. Gu and J. Li, J. Reinf. Plast. Compos., 2015, 34, 28–36 CrossRef CAS.
- M. Avrami, J. Chem. Phys., 1940, 8, 212–220 CrossRef CAS.
- M. Avrami, J. Chem. Phys., 1941, 9, 177–184 CrossRef CAS.
- A. Jeziorny, Polymer, 1978, 19, 1142–1144 CrossRef CAS.
- T. Liu, Z. Mo, S. Wang and H. Zhang, J. Appl. Polym. Sci., 2000, 77, 2865–2871 CrossRef.
- Y. F. Liu, L. Wang and Y. He, Polym. Int., 2010, 59, 1616–1621 CrossRef CAS.
- J. Malek, Thermochim. Acta, 1995, 267, 61–73 CrossRef CAS.
- M. S. A. Aziz, H. F. Naguib and G. R. Saad, Thermochim. Acta, 2014, 591, 130–139 CrossRef.
- T. Ozawa, Polymer, 1971, 12, 150–158 CrossRef CAS.
- Z. Z. Su, W. H. Guo, Y. J. Liu, Q. Li and C. Wu, Polym. Bull., 2009, 62, 629–642 CrossRef CAS.
- P. Cebe, Polym. Compos., 1988, 9, 271–279 CrossRef CAS.
- S. Jain, H. Goossens and M. V. Duin, Polymer, 2005, 46, 8805–8818 CrossRef CAS.
- H. E. Kissinger, Anal. Chem., 1957, 29, 1702–1706 CrossRef CAS.
- H. W. Xiao, P. Li, X. M. Ren and J. T. Yeh, J. Appl. Polym. Sci., 2010, 118, 3558–3569 CrossRef CAS.
- C. D. Doyle, J. Appl. Polym. Sci., 1961, 5, 285–292 CrossRef CAS.
- C. D. Doyle, J. Appl. Polym. Sci., 1962, 6, 639–642 CrossRef CAS.
| This journal is © The Royal Society of Chemistry 2017 |

