 Open Access Article
The effects of He clusters on the mechanical properties of Ti3AC2 (A = Ge, Si): first-principles studies
Quan Songab,
Peng Zhangab,
Jun Zhuangc and
Xi-Jing Ning *ab
*ab
aInstitute of Modern Physics, Fudan University, Shanghai 200433, China. E-mail: xjning@fudan.edu.cn
bApplied Ion Beam Physics Laboratory, Fudan University, Shanghai 200433, China
cDepartment of Optical Science and Engineering, Fudan University, Shanghai 200433, China
First published on 16th October 2017
Abstract
Herein, the damage to the mechanical properties of Ti3AC2 (A = Ge, Si) was systematically investigated by first-principles calculations. It is known that the interstitial He atoms homogenously generated in the materials would finally migrate to the A layer and form clusters of no more than 7 He atoms at a mono-vacancy in the A layer, and the cluster of 7 He atoms reduces the ideal tensile strength of Ti3SiC2 (or Ti3GeC2) to about 37.3% (or 35.5%). The strain simulations showed that the fracture would mostly occur around the A layer and enhances with increase in the cluster size, while the Ti3C2 blocks are relatively stable during tension. Although the He damage to the mechanical properties shows the similar trend for Ti3SiC2 and Ti3GeC2, the former displays better properties for applications in nuclear structural devices.
1. Introduction
In general, He atoms are continuously generated in nuclear structural materials from (n, α) transmutation reactions and have a strong tendency to form He bubbles, leading to creep, swelling, embrittlement, or hardening of the materials.1–3 This He damage has been a problem in metals used as nuclear structural materials,1,4,5 recently, MAX phase materials (e.g. Ti3SiC2 and Ti3AlC2) have been considered as better candidates for nuclear structural materials6–9 and some experiments have demonstrated that Ti3AlC2 exhibits high tolerance to the He damage.10–12 For example, Wang et al. reported that Ti3AlC2 irradiated by 50 keV He ions with doses up to 1 × 1018 cm−2 at room temperature displayed severe structural disorder but no evident amorphization.11 Patel et al. demonstrated that the Al layer of Ti3AlC2 at 500 °C irradiated by 200 keV He ions with doses of 2 × 1017 cm−2 was disordered, whereas the Ti3C2 layers remained intact after irradiation.12 The previous theoretical studies of the MAX phase materials particularly focus on the single He atom behaviors, such as the energetically favorable interstitial sites for a single He atom to occupy and relevant effects.8,13–15 It should be noted that previous experimental observations showed that the He atoms implanted in MAX phase materials usually form clusters with sizes of 0.6–1.0 nm.10,11 Recently, we investigated the migration and aggregation of He atoms homogeneously generated in Ti3SiC2 via first-principles calculations16 and showed that the He atoms would migrate to the Si layer and finally form clusters. Clearly, it is very important for the design of structural materials to study the effects of He clusters, instead of the single He atom, on the mechanical properties of Ti3SiC2 as well as other MAX phase materials.In the present study, we mainly focus on the mechanical properties of Ti3AC2 (A = Ge, Si) affected by the He clusters via DFT calculations. First, we investigated the migration and segregation of He atoms homogeneously generated in Ti3GeC2. It showed that interstitial He atoms would diffuse to the Ge layer at high temperature (>500 °C) and form clusters of no more than 7 He atoms by a single Ge vacancy, which is similar to the behavior of helium in Ti3SiC2. Then, we examined the structural changes of Ti3AC2 in the presence of He clusters on stretching the materials and calculated the corresponding tensile stress. The results indicated that the ideal tensile strength of Ti3SiC2 (or Ti3GeC2) containing a cluster of 7 He atoms, which were formed at a vacancy in the A layer, reduces to 37.27% (or 35.47%) of the perfect ones. The structural deformation mainly takes place near the A layer, while the structure of the Ti3C2 block changes slightly.
2. Computational methods
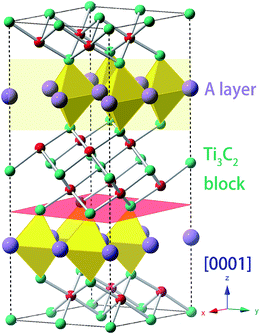
The general chemical formula of MAX phase materials is Mn+1AXn with n = 1, 2, or 3, where M, A and X represent an early transition metal, the elements in group IIIA or IVA, and either carbon or nitrogen, respectively. The atoms are nano-layered arranged, as shown in Fig. 1 for Ti3AC2, which can be regarded as a ‘zigzag’ stacking of hexagonal Ti3C2 blocks and planar A atomic sheets in the [0001] direction (z-axis) sequentially. This nano-laminated structure indicates that cleavage takes place mainly along the z-axis, which has been verified in some experimental observations.17–19 Therefore, our examinations of the mechanical properties are restricted to the strain along the [0001] direction. Specifically, a uniaxial tensile strain ε was applied to the system along the [0001] direction step-by-step with an interval of 0.01. In each step, the system was allowed to be fully relaxed except fixing the z-axis to obtain the total energy E, which was employed to obtain ideal tensile stress:
 | (1) |
The cleavage of Ti3AC2 could take place around the A/TiII, TiII/C, or C/TiI interface, and we calculated the cleavage energy defined as:
| Ecl(d) = (Esep − Ewhole)/2S, | (2) |
To describe the behavior of He in Ti3AC2, the solution energy is defined as follows:
| EsHe = E(per + He) − E(per) − E(Heiso), | (3) |
 | (4) |
A vacancy in Ti3AC2 could trap more than one He atom. In order to estimate the number of He atoms that could be adsorbed by a mono-vacancy, we define trapping energy by the following equation:20,21
| Etrap = E(per + nHe, V) − E(per + (n − 1)He, V) − EsHe, | (5) |
The first-principles calculations were performed using density functional theory (DFT) and the pseudopotential plane-wave method implemented in the VASP codes, where a gradient-corrected form of the exchange correlation functional generalized gradient approximation (GGA-PW91) was employed.22,23 The cutoff energy of the plane-wave basis was set at 500 eV, and a 3 × 3 × 1 supercell containing 108 atoms was adopted to perform the calculations, where 5 × 5 × 2 Monkhorst–Pack k-point sampling for the Brillouin zone was chosen.24 The lattice constants and internal freedom of the unit cell were fully optimized when atomic forces were less than 0.01 eV Å−1. The climbing image NEB method was employed to obtain the minimum energy path of the He atom.25 Five images between the initial and final configurations were constructed by linear interpolation. The forces on all atoms in each image of the CI-NEB chain were converged to 0.05 eV Å−1. The tensile simulations were performed on a 2 × 2 × 1 supercell, where 9 × 9 × 4 k-points were generated, and the convergence of the total energy was 5.0 × 10⁻⁵ eV per atom.
3. Results and discussions
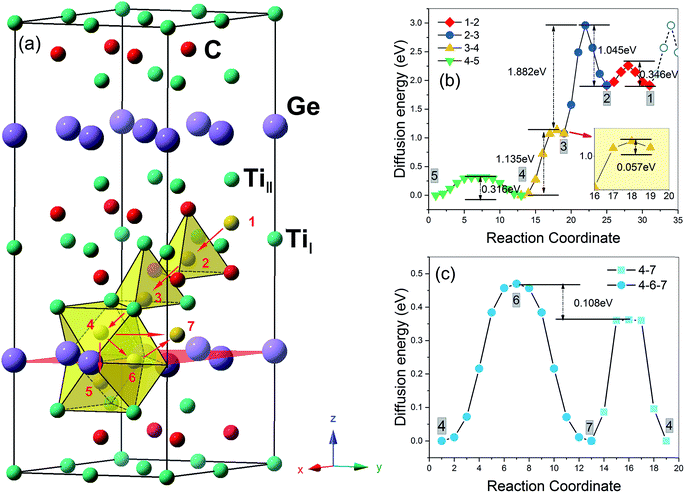
The migration and clustering of He atoms in Ti3SiC2 have been investigated in our recent study.16 It is shown that the He atoms that are homogeneously generated will quickly migrate into the Si layer at high temperature (>500 °C) and form clusters of no more than 7 He atoms at a mono-vacancy. The same procedures were performed to examine the behaviours of He atoms homogeneously generated in Ti3GeC2.According to eqn (3), the solution energy of He in Itetra1, Itetra2, Ioct, and Ihex1 sites labelled by 1 (or 2), 3, 4 (or 5), and 6 in Fig. 2a are 5.07, 4.25, 3.16, and 3.59 eV, respectively, which are very close to the ones for Ti3SiC2.16 The interlayer migration paths (Fig. 2a) and the corresponding energy barriers (Fig. 2b) are also similar to the ones of Ti3SiC2, indicating that a He atom generated in Ti3GeC2 (or Ti3SiC2) at Itetra1 has to overcome an energy barrier of 1.045 eV (or 1.05 eV) jumping into the Ioct site near the Ge (or Si) layer. According to Arrhenius law, the period for the He atoms staying at Itetra1 is about 10 hours for room temperature (∼300 K) and reduces to ∼10−6 s for the temperature of 800 K. The He atoms generated at the Itetra2 site will quickly diffuse into the Ioct site near the Ge (or Si) layer due to the small diffusion barrier. Accordingly, all the interstitial He atoms generated homogeneously in Ti3AC2 at temperatures above 500 °C will diffuse quickly into the A layer instead of staying in the other layers. For the diffusion of an He atom in the A layer, there exist two possible paths, Ioct–Ioct (4–7) and Ioct–Ihex1–Ioct (4–6–7), and the diffusion barrier of 0.36 eV along Ioct–Ioct is lower than Ioct–Ihex1–Ioct by 0.106 eV (Fig. 2c). However, it is significantly larger than the value (0.05 eV) in Ti3SiC2, indicating that the mobility of He atoms in Ti3GeC2 along the A layer is much lower than that of Ti3SiC2.
It should be pointed out that vacancies could be introduced in any layer of MAX phase materials by long-term nuclear irradiation and can trap the interstitial He atoms to form He clusters. For each cluster size, we attempted various possible patterns of He clusters to choose the most energy favorable one. According to eqn (4), the formation energies of a mono-vacancy (V) in the A, C, TiI, TiII layer of Ti3GeC2 (or Ti3SiC2) are 1.98 (or 1.95), 2.33 (or 2.16), 6.85 (or 7.18), and 4.58 (or 4.99) eV, respectively, showing that vacancy most easily forms in the A layer. According to eqn (5), the calculated trapping energy as the function of number of the He atoms trapped in a mono-vacancy in the Ge layer (Fig. 3) shows that the vacancy can trap no more than 7 He atoms, which is the same as that in the Si layer of Ti3SiC2. The lattice constant changes of Ti3GeC2 induced by V-nHe clusters (n = 0, 1…7) are similar to the changes of Ti3SiC. For the vacancy trapping fewer than 4 He atoms, the z-axis contracts, while the x-axis expands by about 0.5%, and with the increase in the He atoms, both the x- and z-axes expand by 0.6% and 0.9%, respectively.
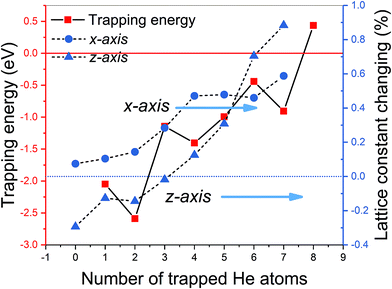 | ||
| Fig. 3 The trapping energy (left y-axis) defined by eqn (5) and the corresponding lattice constant changing (right y-axis) with the number of He atoms trapped by a Ge mono-vacancy. | ||
As shown in Fig. 4, the ideal tensile strengths σM of perfect Ti3SiC2 and Ti3GeC2 are 31.93 GPa and 26.56 GPa, respectively, and the corresponding strains εM are 0.19 and 0.17, suggesting that Ti3SiC2 has better mechanical properties than Ti3GeC2. With presence of the He cluster formed by a mono-vacancy in the A layer, the mechanical strength is significantly degraded as the size of the cluster increases as summarized in Table 1. For example, in the presence of a V-1He cluster, the σM of Ti3SiC2 (or Ti3GeC2) reduces to 23.57 GPa (or 21.19 GPa), which is about 73.8% (or 79.8%) of the values for the perfect materials; meanwhile, the corresponding εM decreases to 0.16 (or 0.15), and in the presence of a V-7He cluster, the σM and εM of Ti3SiC2 (or Ti3GeC2) reduce to 11.90 GPa (or 9.42 GPa) and 0.08 (or 0.07), which are about 37.3% (or 35.5%) and 42.1% (41.2%) of the perfect ones. Clearly, the presence of V-nHe clusters (n = 1, 2…7) strengthens the embrittlement.26–28
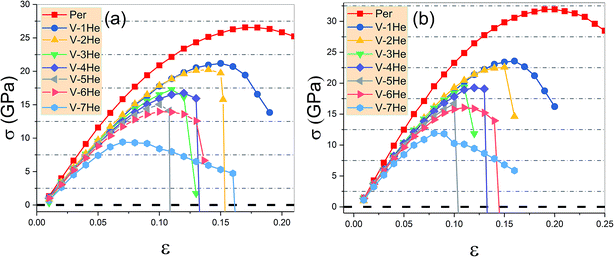 | ||
| Fig. 4 The ideal tensile stress as the function of strain ε in the [0001] direction in the presence of V-nHe (n = 0, 1…7) for Ti3GeC2 (a) and Ti3SiC2 (b). | ||
| σM (GPa) | ||||||||
|---|---|---|---|---|---|---|---|---|
| Per | 1He | 2He | 3He | 4He | 5He | 6He | 7He | |
| Ti3GeC2 | 26.56 | 21.19 | 20.86 | 17.27 | 16.75 | 15.05 | 13.96 | 9.42 |
| Ti3SiC2 | 31.93 | 23.57 | 22.59 | 19.38 | 19.24 | 16.70 | 16.04 | 11.90 |
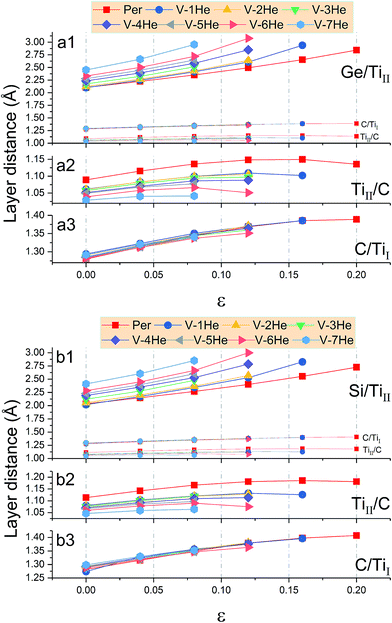
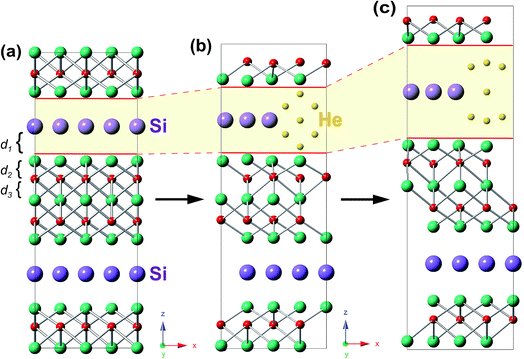
In the presence of He clusters trapped by a mono-vacancy in the A layer, the distances of A/TiII, TiII/C, and C/TiI interlayers denoted by d1, d2 and d3 under strain in the [0001] direction were examined. As shown in Fig. 5, the V-nHe clusters (n = 1, 2…7) result in swelling of the A/TiII interlayer and contracting of the TiII/C interlayer, while the C/TiI interlayer remains nearly unchanged; the swelling is about ten times higher than the contracting (Fig. 5a1 and b1). For the materials without strain, d1 of Ti3SiC2 (or Ti3GeC2) increases from 2.03 to 2.41 Å (or 2.10 to 2.45 Å) as the He atoms increase from 1 to 7; meanwhile, d2 of Ti3SiC2 (or Ti3GeC2) decreases from 1.11 to 1.05 Å (or 1.09 to 1.03 Å). With the increase of the strain, the change in d1 is significantly faster than that in d2. For example, in the presence of a V-7He cluster, when the strain reaches the maximum value εM, 0.08 for Ti3SiC2 (or 0.07 for Ti3GeC2), d1 of Ti3SiC2 (or Ti3GeC2) changes from 2.41 to 2.85 Å (or 2.45 to 2.86 Å), increasing by about 18.35% (or 16.75%), while d2 changes from 1.05 to 1.06 Å (or 1.03 to 1.04 Å), increasing by only 1.69% (or 1.46%). Under the maximum strain εM for V-nHe clusters (n = 1, 2…7) existing in the A layer, the strain of each interlayer is listed in Table 2. The results show that strain of the A/TiII interlayer is much larger than that of the others, and the differences become larger with the increase in cluster size. On further increasing the strain, fracture took place around the A layer. Fig. 6a and b show the structural changes of perfect Ti3SiC2 caused by the presence of a V-7He cluster without strain. When this system was stretched to its maximum strain by 8%, the distance between the A/TiII interlayer containing a V-7He cluster increases by about 18.35%, while the distance between other A/TiII interlayers without the cluster remains nearly unchanged (Fig. 6c). For Ti3GeC2, similar structural changes were also observed, showing heavy damage effects of the cluster on the bond energy.
| Block | Layer | Per | 1He | 2He | 3He | 4He | 5He | 6He | 7He |
|---|---|---|---|---|---|---|---|---|---|
| Ti3GeC2 (ε) | |||||||||
| Bulk | 0.17 | 0.15 | 0.14 | 0.11 | 0.12 | 0.1 | 0.1 | 0.07 | |
| Ti3Ge | Ge/TiII | 0.2832 | 0.3421 | 0.3221 | 0.2374 | 0.2757 | 0.2209 | 0.2417 | 0.1675 |
| Ti3C2 | TiII/C | 0.0536 | 0.0434 | 0.0378 | 0.0407 | 0.0349 | 0.0260 | 0.0204 | 0.0146 |
| C/TiI | 0.0830 | 0.0708 | 0.0700 | 0.0585 | 0.0614 | 0.0509 | 0.0494 | 0.0344 | |
![[thin space (1/6-em)]](https://www.rsc.org/images/entities/char_2009.gif) |
|||||||||
| Ti3SiC2 (ε) | |||||||||
| Bulk | 0.19 | 0.16 | 0.15 | 0.11 | 0.12 | 0.1 | 0.11 | 0.08 | |
| Ti3Si | Si/TiII | 0.3183 | 0.3997 | 0.3531 | 0.3017 | 0.2710 | 0.2306 | 0.2678 | 0.1835 |
| Ti3C2 | TiII/C | 0.0629 | 0.0423 | 0.0380 | 0.0418 | 0.0400 | 0.0298 | 0.0228 | 0.0169 |
![[thin space (1/6-em)]](https://www.rsc.org/images/entities/char_2009.gif) |
C/TiI | 0.0977 | 0.0959 | 0.0804 | 0.0652 | 0.0647 | 0.0525 | 0.0559 | 0.0413 |
It is notable that both the TiII/C and C/TiI interlayers are within the Ti3C2 blocks, so the above simulation results suggest that Ti3C2 blocks contribute more to the mechanical strength and structural stability. These results are consistent with the experimental observations that A layer is easily disordered, while the Ti3C2 structure appeared unperturbed after irradiation.9,12
The above results suggest that the fracture of Ti3AC2 would mostly occur between the A/TiII interlayer, which can be understood as follows. First, the MAX phases have the stacking sequence …/[M–X]/A/[M–X]/… in the [0001] direction with a characteristic ‘zigzag’ mode, and the bonds inside [M–X] blocks are relatively stronger than those between the A layer and [M–X] blocks.29–31 Second, the presence of He clusters in the A layer severely reduces the strength of the Ti-A bonds, which can be seen from the maximum cleavage energy, Gc, which is the saturated value of Ecl(d) when the distance d reaches infinity (cf. eqn (2)). As shown in Fig. 7, for the cleavage energy as the function of the strain ε of the A/TiII interlayer, the calculated Gc for Ti3SiC2 (or Ti3GeC2) without He clusters is 2.79 J m−2 (or 2.40 J m−2), which is in good agreement with the value, 2.82 J m−2, reported in ref. 26. However, the value keeps decreasing with the increase in size of He cluster in the A layer and reduces to 37.22% (or 38.13%) of the perfect materials.
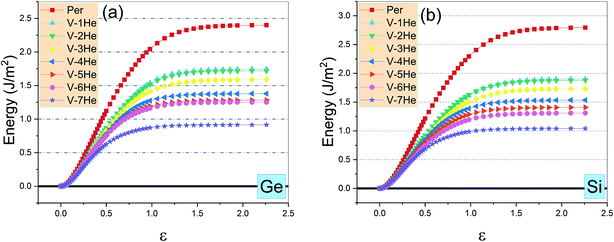 | ||
| Fig. 7 The cleavage energy Ecl as the function of strain ε of the A/TiII interlayer in the presence of V-nHe clusters (n = 1, 2…7) for Ti3GeC2 (a) and (b) Ti3SiC2. | ||
Although the He damage for Ti3GeC2 is similar to that for Ti3SiC2, the latter should be a better candidate as a nuclear structural material because its ideal tensile strength σM and maximum strain εM are always clearly higher than that of the former in the presence (or absence) of the He clusters. In addition, the high mobility of a single He atom in the Si layer with only 0.05 eV diffusion barrier, which is significantly smaller than the value of 0.36 eV in the Ge layer, is beneficial for the He atoms to migrate quickly to the grain boundary.
4. Conclusion
Using DFT calculations, we systematically investigated the effects of He clusters formed in Ti3AC2 (A = Ge, Si) on the mechanical properties and obtained the following conclusions. First, the interstitial He atoms homogenously generated in Ti3AC2 would immediately (∼10−6 s) migrate to the A layer at higher temperature (>500 °C) and form clusters of no more than 7 He atoms at a mono-vacancy in the A layer. Second, the cluster of V-7He atoms severely reduces the ideal tensile strength, 31.93 GPa, of Ti3SiC2 (or 26.56 GPa of Ti3GeC2) to 11.90 GPa (or 9.42 GPa), and the corresponding maximum strain changes from 0.19 (or 0.17) to 0.08 (or 0.07), showing heavy damage effects on the mechanical properties. Third, the strain simulations showed that the fracture of Ti3AC2 would mostly occur around the A layer with the presence (or absence) of the He clusters, whereas Ti3C2 blocks are relatively stable, and the embrittlement was enhanced with the increase in He cluster size. At last, we conclude that as nuclear structural materials, Ti3SiC2 should be better than Ti3GeC2.Conflicts of interest
There are no conflicts to declare.Acknowledgements
This study was supported by the National Natural Science Foundation of China [Grant No. 11274073 and No. 61675045].References
- H. Trinkaus and B. N. Singh, J. Nucl. Mater., 2003, 323, 229–242 CrossRef CAS.
- E. A. Marquis, J. M. Hyde, D. W. Saxey, S. Lozano-Perez, V. de Castro, D. Hudson, C. A. Williams, S. Humphry-Baker and G. D. W. Smith, Mater. Today, 2009, 12, 30–37 CrossRef CAS.
- I. J. Beyerlein, A. Caro, M. J. Demkowicz, N. A. Mara, A. Misra and B. P. Uberuaga, Mater. Today, 2013, 16, 443–449 CrossRef CAS.
- M. J. Caturla, T. D. de la Rubia and M. Fluss, J. Nucl. Mater., 2003, 323, 163–168 CrossRef CAS.
- W. D. Wilson, C. L. Bisson and M. I. Baskes, Phys. Rev. B, 1981, 24, 5616–5624 CrossRef CAS.
- D. W. Clark, S. J. Zinkle, M. K. Patel and C. M. Parish, Acta Mater., 2016, 105, 130–146 CrossRef CAS.
- D. J. Tallman, L. F. He, B. L. Garcia-Diaz, E. N. Hoffman, G. Kohse, R. L. Sindelar and M. W. Barsoum, J. Nucl. Mater., 2016, 468, 194–206 CrossRef CAS.
- H. F. Zhang, B. D. Yao, L. Q. Shi, D. J. O'Connor, J. Huang, J. Y. Zhang, W. Ding and Y. X. Wang, Acta Mater., 2015, 97, 50–57 CrossRef CAS.
- H. H. Shen, F. Z. Li, H. B. Zhang, S. M. Peng, X. T. Zu and K. Sun, J. Eur. Ceram. Soc., 2017, 37, 855–858 CrossRef CAS.
- P. Song, J. Sun, Z. Wang, M. Cui, T. Shen, Y. Li, L. Pang, Y. Zhu, Q. Huang and J. Lü, Nucl. Instrum. Methods Phys. Res., Sect. B, 2014, 326, 332–336 CrossRef CAS.
- C. Wang, T. Yang, S. Kong, J. Xiao, J. Xue, Q. Wang, C. Hu, Q. Huang and Y. Wang, J. Nucl. Mater., 2013, 440, 606–611 CrossRef CAS.
- M. K. Patel, D. J. Tallman, J. A. Valdez, J. Aguiar, O. Anderoglu, M. Tang, J. Griggs, E. G. Fu, Y. Q. Wang and M. W. Barsoum, Scr. Mater., 2014, 77, 1–4 CrossRef CAS.
- J. R. Xiao, C. X. Wang, T. F. Yang, S. Y. Kong, J. M. Xue and Y. G. Wang, Nucl. Instrum. Methods Phys. Res., Sect. B, 2013, 304, 27–31 CrossRef CAS.
- L. X. Jia, Y. X. Wang, X. D. Ou, L. Q. Shi and W. Ding, Mater. Lett., 2012, 83, 23–26 CrossRef CAS.
- S. Yang, N. Hu, X. Gou, C. Wang, X. Zhu, W. Duan and L. Yang, RSC Adv., 2016, 6, 59875–59881 RSC.
- Q. Song, P. Zhang, J. Zhuang and X.-J. Ning, Comput. Mater. Sci., 2017, 137, 327–331 CrossRef CAS.
- Z. F. Zhang, Z. M. Sun and H. Hashimoto, Mater. Lett., 2003, 57, 1295–1299 CrossRef CAS.
- B. J. Kooi, R. J. Poppen, N. J. M. Carvalho, J. T. M. De Hosson and M. W. Barsoum, Acta Mater., 2003, 51, 2859–2872 CrossRef CAS.
- T. Zhen, M. W. Barsoum, S. R. Kalidindi, M. Radovic, Z. M. Sun and T. El-Raghy, Acta Mater., 2005, 53, 4963–4973 CrossRef CAS.
- K. Morishita, R. Sugano and B. D. Wirth, J. Nucl. Mater., 2003, 323, 243–250 CrossRef CAS.
- L. Yang, X. T. Zu and F. Gao, Phys. B, 2008, 403, 2719–2724 CrossRef CAS.
- P. E. Blochl, Phys. Rev. B, 1994, 50, 17953–17979 CrossRef.
- J. P. Perdew, J. A. Chevary, S. H. Vosko, K. A. Jackson, M. R. Pederson, D. J. Singh and C. Fiolhais, Phys. Rev. B, 1992, 46, 6671–6687 CrossRef CAS.
- H. J. Monkhorst and J. D. Pack, Phys. Rev. B, 1976, 13, 5188–5192 CrossRef.
- G. Henkelman, B. P. Uberuaga and H. Jónsson, J. Chem. Phys., 2000, 113, 9901–9904 CrossRef CAS.
- N. I. Medvedeva and A. J. Freeman, Scr. Mater., 2008, 58, 671–674 CrossRef CAS.
- A. Ganguly, T. Zhen and M. W. Barsoum, J. Alloys Compd., 2004, 376, 287–295 CrossRef CAS.
- C. Hartsuijker and J. W. Welleman, Engineering Mechanics, Springer, Netherlands, 2007 Search PubMed.
- Z. M. Sun, Int. Mater. Rev., 2011, 56, 143–166 CrossRef CAS.
- M. W. Barsoum, Prog. Solid State Chem., 2000, 28, 201–281 CrossRef CAS.
- H. Z. Zhang and S. Q. Wang, Acta Mater., 2007, 55, 4645–4655 CrossRef CAS.
| This journal is © The Royal Society of Chemistry 2017 |

