 Open Access Article
Creative Commons Attribution 3.0 Unported Licence
Antiviral and anti-inflammatory meroterpenoids: stachybonoids A–F from the crinoid-derived fungus Stachybotrys chartarum 952†
Panpan Zhang‡
 a,
Yongfang Li‡a,
Chunxiu Jiac,
Jiajia Langc,
Shah-Iram Niaza,
Jing Lia,
Jie Yuand,
Jianchen Yud,
Senhua Chen
 *ab and
Lan Liu*ab
aSchool of Marine Sciences, Sun Yat-Sen University, Guangzhou 510006, China. E-mail: chensh65@mail2.sysu.edu.cn; cesllan@mail.sysu.edu.cn; Tel: +86-20-84725459
bKey Laboratory of Functional Molecules from Oceanic Microorganisms, Department of Education of Guangdong Province, Sun Yat-Sen University, Guangzhou 510006, China
cSchool of Chemistry, Sun Yat-Sen University, Guangzhou 510275, China
dZhongshan School of Medicine, Sun Yat-Sen University, Guangzhou, P. R. China
First published on 26th October 2017
Abstract
Six new meroterpenoids, which have been named as stachybonoids A–F (1–3 and 5–7), and three known phenylspirodrimanes (4, 8 and 9) were isolated from the crinoid-derived fungus Stachybotrys chartarum 952. Their structures were established on the basis of extensive spectroscopic data (1D and 2D NMR, MS, and ECD), as well as the modified Mosher's method and single-crystal X-ray structural analysis. Compound 1 exhibited inhibitory activity against the replication of dengue virus. Compounds 4, 7, and 8 exhibited moderate anti-inflammatory activity by inhibiting the production of nitric oxide (NO) in RAW264.7 cells activated by lipopolysaccharide, with IC50 values of 27.2, 52.5, and 17.9 μM, respectively.
Introduction
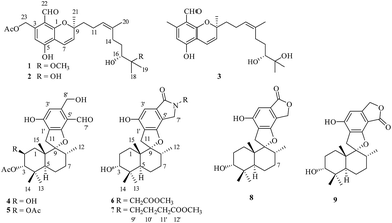
Stachybotrys chartarum is a species of filamentous fungus that is widespread in soil and plants, as well as marine sponges.1–3 The fungus S. chartarum is known to produce a variety of secondary metabolites with diverse novel structures and interesting biological activities,1 such as toxic macrocyclic trichothecenes,4 anti-inflammatory atranones,5 and antiviral phenylspirodrimanes.3,6 Phenylspirodrimanes belong to the class of polyketide–terpenoid hybrid meroterpenoids, possess a common sesquiterpene unit containing a drimane skeleton to which a benzene ring is attached through a spirofuran ring, and have only previously been isolated from the genus Stachybotrys.1,7 They display a wide range of bioactivities including antiviral activity (HIV-1 and IAV),3,6 antihyperlipidemic activity,2 inhibition of tyrosine kinase,8 and cytotoxicity.9Stachybotrys chartarum 952 was isolated from a crinoid (Himerometra magnipinna) from Xuwen Coral Reef Nature Reserve, Zhanjiang city, Guangdong Province, China. An EtOAc extract of a fermentation broth of the fungus S. chartarum 952 displayed moderate anti-inflammatory activity by inhibiting the production of nitric oxide (NO) in RAW264.7 cells activated by lipopolysaccharide, with IC50 values of 36 ± 2.1 μM. Subsequent chemical investigation led to the isolation of three new meroterpenoids, namely, stachybonoids A–C (1–3) and one new phenylspirodrimane, namely, stachybonoid D (5) from a rice medium and two new phenylspirodrimanes, namely, stachybonoids E and F (6 and 7), as well as three known phenylspirodrimanes (4, 8, and 9) from PDB medium. In this paper, we describe the isolation, structural elucidation, plausible biosynthetic pathways, and bioactivities of the isolates from the fungus.
Results and discussion
The crinoid-derived fungus Stachybotrys chartarum 952 was cultured on solid rice and PDB medium for four weeks, respectively. The fermentation extract was fractionated by repeated silica gel chromatography, Sephadex LH-20 column chromatography, and HPLC to afford compounds 1–9 (Fig. 1).Stachybonoid A (1) was obtained as a yellow gum and possessed a molecular formula of C26H36O7 according to HRESIMS data in combination with 1H and 13C NMR data (Table 1). The 1H NMR data showed the presence of an aldehyde proton [δH 10.34 (1H, s)], an aromatic proton [δH 6.69 (1H, s)], a pair of cis-coupled olefinic protons [δH 5.63 (1H, d, J = 10.3 Hz) and 6.91 (1H, d, J = 10.3 Hz)], and five methyl groups [δH 2.03 (3H, s), 1.66 (3H, s), 1.42 (3H, s), 1.34 (3H, s), and 1.27 (3H, s)]. The 13C and DEPT NMR spectra of 1 exhibited 26 carbon signals, namely, one aldehyde carbon (δC 194.3), one ester carbonyl carbon (δC 170.6), six aromatic carbons (δC 161.1, 161.1, 141.8, 113.3, 111.0, and 109.6), four olefinic carbons, two oxygen-linked quaternary carbons, two oxygen-linked methine groups, five methylene groups, and five methyl groups. All the above information suggested that compound 1 has a chromene skeleton similar to anthopogochromene A,10 in addition to the different substituents on the aromatic ring and alkyl chain. In the HMBC spectrum (Fig. 2), the correlations of the aldehyde proton H-22 (δH 10.34) with C-1 and C-2 and the oxygen-linked methylene proton H-23 (δH 5.54) with C-2, C-3, and C-4 indicated that the aldehyde group and oxygen-linked methylene group were located at C-2 and C-3 of the chromene unit, respectively. The acetyl group was substituted on the C-23 methylene group, as supported by the HMBC correlation of H-23 with the ester carbonyl carbon (δC 170.6). The key COSY correlations of H-9/H-10/H-11 and H-14/H-15/H-16, as well as the HMBC correlations of H-20 with C-12, C-13 and C-14, H-18 with C-16 and C-17, H-19 with C-17 and C-18, and 17-OCH3 with C-17, indicated a 2-methoxy-2,6-dimethylnon-6-en-3-ol unit. This unit and the remaining methyl group were both linked to C-9 of the chromene unit on the basis of the HMBC correlations from H-10 to C-8 and C-9 and H-21 to C-8 and C-10.
| No. | 1 | 2 | 3 | |||
|---|---|---|---|---|---|---|
| δH (J in Hz) | δC | δH (J in Hz) | δC | δH (J in Hz) | δC | |
| 1 | 161.1, C | 161.0, C | 161.5, C | |||
| 2 | 113.3, C | 113.3, C | 114.2, C | |||
| 3 | 141.8, C | 141.8, C | 145.1, C | |||
| 4 | 6.69, s | 111.0, CH | 6.70, s | 111.0, CH | 6.32, s | 111.7, CH |
| 5 | 161.1, C | 161.0, C | 161.2, C | |||
| 6 | 109.6, C | 109.5, C | 107.7, C | |||
| 7 | 6.91, d (10.3) | 116.3, CH | 6.91, d (10.3) | 116.2, CH | 6.91, d (10.3) | 116.6, CH |
| 8 | 5.63, d (10.3) | 128.4, CH | 5.63, d (10.3) | 128.4, CH | 5.58, d (10.3) | 127.4, CH |
| 9 | 81.6, C | 81.6, C | 81.4, C | |||
| 10 | 1.81, m; 1.68, m | 42.3, CH2 | 1.82, m; 1.71, m | 42.3, CH2 | 1.81, m; 1.70, m | 42.4, CH2 |
| 11 | 2.24, m | 23.4, CH2 | 2.24, m | 23.3, CH2 | 2.24, m | 23.5, CH2 |
| 12 | 5.31, t (7.6) | 124.1, CH | 5.32, t (7.6) | 124.0, CH | 5.34, t (7.6) | 124.1, CH |
| 13 | 136.7, C | 136.7, C | 136.8, C | |||
| 14 | 2.30, m; 2.62, m | 37.8, CH2 | 2.33, m; 2.66, m | 37.9, CH2 | 2.66, m; 2.33, m | 38.0, CH2 |
| 15 | 1.97, m; 1.68, m | 30.7, CH2 | 2.08, m; 1.81, m | 31.0, CH2 | 2.09, m; 1.81, m | 31.2, CH2 |
| 16 | 3.70, d (10.2) | 76.6, CH | 3.77, d (10.2) | 78.7, CH | 3.77, d (10.2) | 78.8, CH |
| 17 | 78.2, C | 73.0, C | 73.1, C | |||
| 18 | 1.34, s | 21.8, CH3 | 1.54, s | 26.4, CH3 | 1.54, s | 26.5, CH3 |
| 19 | 1.27, s | 20.4, CH3 | 1.50, s | 26.3, CH3 | 1.50, s | 26.4, CH3 |
| 20 | 1.65, s | 16.6, CH3 | 1.66, s | 16.6, CH3 | 1.67, s | 16.6, CH3 |
| 21 | 1.42, s | 27.6, CH3 | 1.42, s | 27.6, CH3 | 1.42, s | 27.7, CH3 |
| 22 | 10.36, s | 194.3, CH | 10.36, s | 194.3, CH | 10.13, s | 194.5, CH |
| 23 | 5.54, s | 63.2, CH2 | 5.54, s | 63.2, CH2 | 2.38, s | 18.5, CH3 |
| 23-OAc | 170.6, C | 170.6, C | ||||
| 23-OAc | 2.03, s | 21.0, CH3 | 2.03, s | 21.0, CH3 | ||
| 17-OCH3 | 3.24, s | 49.6, CH3 | ||||
| 5-OH | 13.19, br s | 13.16, br s | 13.26, br s | |||
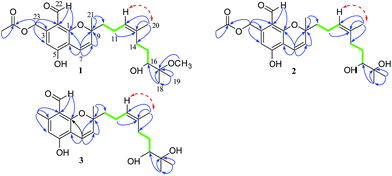 | ||
| Fig. 2 Key HMBC (blue arrows), 1H–1H COSY (bold green lines), and NOESY (red arrows) correlations in 1–3. | ||
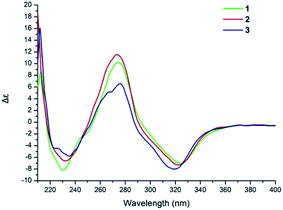
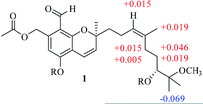
The NOESY correlation of H-12 (δH 5.32) with H-20 (δH 1.64) established that the C-12/C-13 double bond had the Z configuration. The absolute configuration of C-9 was established as S by a comparison of its CD spectrum (a positive cotton effect: λ = 274 nm, Δε = 10.20) with analogues in the literature (Fig. 3).10,11 The assignment of the absolute configuration of C-16 was performed by the modified Mosher ester method.12 The differences in the 1H NMR chemical shifts between (S)- and (R)-MTPA esters (Δδ = δS − δR) around the C-16 position were analyzed to determine the absolute configuration of this position, which was found to be R (Fig. 4). Thus, compound 1 was revealed to be ((S)-8-formyl-5-hydroxy-2-((S,Z)-7-hydroxy-8-methoxy-4,8-dimethylnon-3-en-1-yl)-2-methyl-2H-chromen-7-yl)methyl acetate and was named as stachybonoid A.
Compound 2 was obtained as a yellow oil. The molecular formula of C25H34O7 was confirmed from the molecular ion peak at m/z 445.2229 [M − H]− observed in the HRESIMS spectrum. The 1H and 13C NMR data (Table 1) showed that compound 2 lacked a carbon signal (δH/C 3.24/49.6) in comparison with 1. It was deduced that the 17-OCH3 group in 1 was replaced by a hydroxyl group in compound 2. The positive cotton effect (λ = 273 nm, Δε = 11.53) observed in the ECD spectrum enabled the definition of the absolute configuration at C-9 (S) in 2 (Fig. 3). Therefore, the structure of 2 was determined to be demethoxystachybonoid A, and 2 was named as stachybonoid B.
Compound 3 gave a molecular formula of C23H32O5, which was confirmed by the HRESIMS peak at m/z 387.2168 [M − H]−. The NMR spectroscopic data of 3 (Table 1) were very similar to those of compound 2 but lacked two carbon signals (δC 170.6 and 63.2). This suggested that in compound 3 the ester group on the side chain at C-23 (δC 18.5) was absent, which was confirmed by the HMBC correlation from H-23 (δH 2.37) to C-1 (δC 161.1) and C-2 (δC 113.3). The absolute configuration of C-9 was also assigned as S by a comparison of its CD spectrum with analogues in the literature (Fig. 3).10,11 Consequently, the structure of 3 was determined to be (E)-2-(7,8-dihydroxy-4,8-dimethylnon-3-en-1-yl)-6-hydroxy-2,7-dimethyl-2H-chromene-8-carbaldehyde, and 3 was named as stachybonoid C.
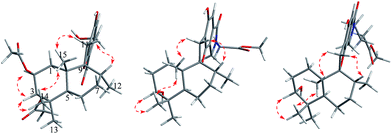
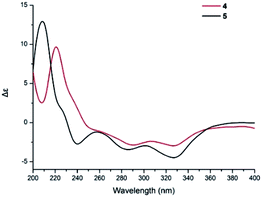
Compound 5 was obtained as a yellow oil, and its molecular formula was determined to be C27H36O8 from the HRESIMS negative ion at m/z 487.2339 [M − H]− (calcd for C27H35O8: 487.2339), which indicated nine degrees of unsaturation. The IR spectrum displayed absorption bands for phenolic hydroxyl (3408 cm−1), carbonyl (1740 cm−1), and aromatic groups (1650 and 1455 cm−1). The 1H NMR spectrum (Table 2) revealed the presence of one aldehyde proton [δH 10.85 (1H, s)], one pentasubstituted aromatic proton [δH 7.53 (1H, s)], and six methyl groups [δH 2.05 (3H, s), 1.92 (3H, s), 1.05 (3H, s), 0.94 (3H, s), 0.91 (3H, s), and 0.87 (3H, d, J = 6.4 Hz)]. The 13C NMR and DEPT spectra exhibited 27 carbon signals, which comprised six methyl groups, five methylene groups, five methine groups, eight quaternary carbons, and three carbonyl groups. The 1H and 13C NMR (Table 2) data of compound 5 were similar to those of stachybotrysin C (4) with its phenylspirodrimane skeleton,6 except for the presence of an additional acetyl group and a variation in the chemical shift of C-2 (δH/C 5.46/68.9) in 5. It was shown that the 2-OH group in 4 was replaced by an acetoxy group in compound 5, which was further supported by the HMBC correlation from H-17 to C-16 and C-2 in 5 (Fig. 5). The NOE correlations from H-15 to H-14 and H-11b, H-8 to H-11a, and H-3 to H-14 indicated that H-3, H-8, H-11, H-14, and H-15 were syn-oriented, whereas H-5 and H-12 had the opposite orientation. The NOE correlation between H-2 and H-3 suggested that the corresponding bonds were both equatorial in association with the small coupling constant of J2,3. The ECD spectrum of 5 exhibited a strong positive cotton effect (CE) at 210 nm and two weak negative CEs at 286 and 327 nm, which were similar to those of 4 (Fig. 7). This indicated that they have the same absolute configurations, namely, 2S, 3S, 8S, and 10S. Therefore, the structure of 5 was identified as shown in Fig. 1, and 5 was named as stachybonoid D.
| No. | 5 | 6 | 7 | |||
|---|---|---|---|---|---|---|
| δH (J in Hz) | δC | δH (J in Hz) | δC | δH (J in Hz) | δC | |
| 1 | 2.29, m; 1.63, dd (3.5, 11.9) | 31.7, CH2 | 1.98, t (14.0); 1.75, m | 26.6, CH2 | 1.73, m; 1.99, m | 26.6, CH2 |
| 2 | 5.45, m | 68.9, CH | 2.33, td (12.8, 3.5); 1.14, dt (12.8, 6.1) | 25.2, CH2 | 2.38, m; 1.20, m | 25.1, CH2 |
| 3 | 5.30, br s | 77.5, CH | 3.63, m | 75.3, CH | 3.62, m | 75.3, CH |
| 4 | 38.7, C | 38.7, C | 38.7, C | |||
| 5 | 2.29, m | 41.5, CH | 2.62, dd (12.8, 2.5) | 40.9, CH | 2.65, dd (12.8, 2.5) | 40.9, CH |
| 6 | 1.48, m; 1.33, m | 21.1, CH2 | 1.45, dd (12.8, 3.5); 1.63, m | 21.8, CH2 | 1.66, m; 1.47, m | 21.8, CH2 |
| 7 | 1.58, m | 31.2, CH2 | 1.75, m; 1.60, m | 32.1, CH2 | 1.78, m; 1.62, m | 32.1, CH2 |
| 8 | 1.74, m | 37.2, CH | 1.75, m | 37.8, CH | 1.78, m | 37.8, CH |
| 9 | 99.5, C | 99.4, C | 99.3, C | |||
| 10 | 44.4, C | 43.2, C | 43.3, C | |||
| 11 | 3.46, d (16.7); 3.08, d (16.7) | 32.0, CH2 | 3.13, d (16.9); 3.54, d (16.9) | 33.3, CH2 | 3.16, d (16.9); 3.62, m | 33.4, CH2 |
| 12 | 0.87, d (6.4) | 16.2, CH3 | 0.83, d (5.8) | 16.4, CH3 | 0.89, s | 16.4, CH3 |
| 13 | 0.94, s | 21.9, CH3 | 1.25, s | 29.7, CH3 | 1.26, s | 29.7, CH3 |
| 14 | 0.91, s | 28.4, CH3 | 0.92, s | 23.2, CH3 | 0.93, s | 23.2, CH3 |
| 15 | 1.05, s | 17.3, CH3 | 0.99, s | 16.7, CH3 | 1.01, s | 16.7, CH3 |
| 16 | 170.9, C | |||||
| 17 | 2.05, s | 21.1, CH3 | ||||
| 18 | 170.8, C | |||||
| 19 | 1.92, s | 21.5, CH3 | ||||
| 1′ | 112.2, C | 118.7, C | 118.2, C | |||
| 2′ | 169.1, C | 156.1, C | 156.0, C | |||
| 3′ | 7.53, s | 108.2, CH | 7.34, s | 102.5, CH | 7.36, s | 102.3, CH |
| 4′ | 148.9, C | 113.7, C | 113.4, C | |||
| 5′ | 110.0, C | 134.9, C | 135.8, C | |||
| 6′ | 161.6, C | 157.5, C | 157.5, C | |||
| 7′ | 10.86, s | 188.1, CH | 169.6, C | 169.2, C | ||
| 8′ | 5.56, m | 63.7, CH2 | 4.04, d (16.0); 4.32, d (16.0) | 48.4, CH2 | 3.83, d (16.5); 4.07, d (16.5) | 47.8, CH2 |
| 9′ | 4.57, d (17.7); 4.32, d (17.7) | 44.6, CH2 | 3.62, m; 3.40, m | 42.3, CH2 | ||
| 10′ | 170.5, C | 1.83, m | 24.5, CH2 | |||
| 11′ | 3.54, s | 52.4, CH3 | 2.32, t (7.4) | 31.8, CH2 | ||
| 12′ | 173.7, C | |||||
| 13′ | 3.55, s | 51.8, CH3 | ||||
| 2-OH | 5.73, d (3.5) | 5.76, d (3.7) | ||||
| 2′-OH | 12.23, s | 12.20, s | ||||
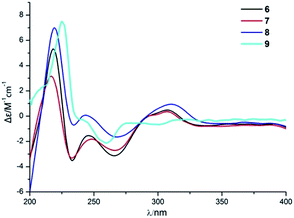
Compound 6 was obtained as a yellow powder. The molecular formula of 6 was established as C26H35O6N on the basis of the [M + H]+ ion signal at m/z 458.2537. The 1H and 13C NMR data for the phenylspirodrimane framework of 6 were quite similar to those of stachybotrylactam.4 The HMBC correlations of H-9′ and H-11′ with C-10 and H-7′ with C-9′ revealed that a methyl acetate moiety was connected to the nitrogen atom. The relative configuration of the phenylspirodrimane moiety in 6 was further established by its NOESY correlations (Fig. 6). The absolute configuration of 6 was assigned to be 2S, 3S, 8S, 10S on the basis of its ECD spectrum, which exhibited a strong cotton effect (CE) at 218 nm and two weak negative CEs at 222 and 266 nm, which were similar to those of 8. Hence, compound 6 was identified as shown in Fig. 1 and was named as stachybonoid E.
Compound 7 was obtained as a faint yellow powder. The HRESIMS data indicated a molecular formula of C28H39O6N on the basis of the [M + H]+ ion signal at m/z 486.2850. The 1H and 13C NMR data showed that 7 had two additional methylene signals (δC 49.6) in comparison with 6. The 1H–1H COSY correlation of H-10′ with H-9′ and H-11′, as well as the HMBC correlations from H-11′ and H-13′ to C-12′ and H-7′ to C-9′ indicated that a methyl butyrate moiety was linked to the nitrogen atom. Its relative configuration was identified to be the same as that of 6 from NOESY data (Fig. 6). At the same time, compounds 6 and 7 shared the same absolute configuration of 2S, 3S, 8S, 10S according to their similar ECD spectra (Fig. 8). Thus, compound 7 was identified and named as stachybonoid F.
The known compounds were identified as stachybotrylactone (8)13 and stachartin B (9)13,14 on the basis of NMR data and mass spectrometric analysis and a comparison of their spectroscopic data with published values. The absolute configuration of compound 8 was further established by a single-crystal X-ray diffraction experiment using Cu Kα radiation (ESI†).
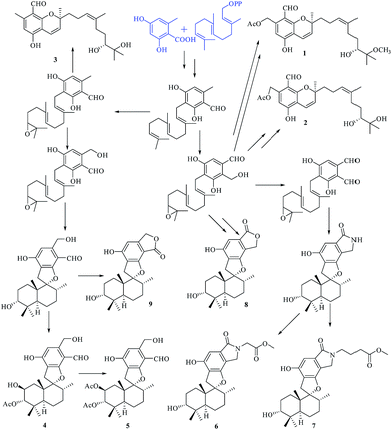
Compounds 1–9 belong to the class of polyketide–terpenoid hybrid meroterpenoids, which are derived from orsellinic acid and farnesyl diphosphate.7 A plausible biosynthetic pathway for 1–9 was proposed, as shown in Fig. 9. Initially, orsellinic acid and farnesyl diphosphate underwent addition to form the intermediate ilicicolin B. Then, the terminal olefin bond in the prenyl group of ilicicolin B was epoxidized to yield another intermediate. When an aromatic hydroxyl group reacted with C-2 of the prenyl group, the series of phenylspirodrimane derivates 4–9 were generated by cyclization, oxidation, addition, and acetylation. When the aromatic hydroxyl group was linked to C-3 of the prenyl group by electrophilic addition, a series of chromene derivatives (1–3) were yielded.
Compounds 1–3 were tested for their antiviral activities against dengue virus proteins using α-tubulin as a standard. The results of the anti-dengue virus assay indicated that compound 1 displayed inhibitory activity against the replication of dengue virus. A western blot showed that compound 1 reduced the expression of the dengue virus protein prM in a dose-dependent manner (Fig. 10). It is noteworthy that compound 1 inhibited the replication of dengue virus whereas compound 2 increased the formation of dengue protein, when the only difference between their structures was whether or not 17-OH was methylated. Compounds 4–9 were investigated for their inhibitory activities against the LPS-activated production of NO in RAW264.7 cells using the Griess assay with indomethacin as a positive control (IC50 = 37.5 ± 1.6 μM). Compounds 4, 7, and 8 displayed moderate inhibitory effects on the production of NO, with IC50 values of 27.2 ± 1.2, 52.5 ± 1.8, and 17.9 ± 0.9 μM, respectively (ESI†). However, compounds 5, 6 and 9 were inactive (<50% inhibition at 100 μM, which was the highest concentration tested). In order to investigate whether the inhibitory activities of the active compounds were due to their cytotoxicity, the effects of compounds 4, 7 and 8 on cell proliferation/viability were determined using the MTT method. After treatment with LPS for 24 h, compounds 4 and 7 (up to 50 μM) did not exhibit any significant cytotoxicity. However, 8 displayed cytotoxicity at 50 μM, and the cell survival rate was 9.50%.
Experimental
General experimental procedures
Optical rotations were measured using an Abbemat 300 reflectometer with a 100 mm cell. IR spectra were recorded with an FT-Raman spectrometer (Nicolet NXR 9650). NMR spectra were recorded using a Bruker Avance 400 MHz spectrometer with tetramethylsilane as an internal standard. The semipreparative HPLC apparatus was an Essentia LC-16. ESIMS spectra were acquired using an LCQ Deca XP LC-MS spectrometer, and HRESIMS spectra were recorded with an LTQ Orbitrap LC-MS spectrometer (Thermo Corporation, USA). ECD and UV spectra were recorded with an Applied Photophysics Ltd spectrometer using MeOH as a solvent. Sephadex LH-20 and silica gel (100–200 mesh and 200–300 mesh, Qingdao Marine Chemical Factory, Qingdao, People's Republic of China) were used for column chromatography. Analytical thin-layer chromatography (TLC) was performed with GF254 plates (Qingdao Marine Chemical Factory). The reagents used in the research process were of analytical grade (Guangzhou Chemical Reagent Factory).Fungal material
Crinoids (Himerometra magnipinna) were collected in Zhanjiang Mangrove National Nature Reserve in Guangdong Province, China, in August 2014. A strain, which was designated as 952, was isolated from the crinoids. On the basis of its morphological characteristics and the ITS region, the strain was identified to be Stachybotrys chartarum. The sequence data of the fungal strain have been deposited in the GenBank database under the accession number KC427079.1. The voucher specimen was preserved on potato dextrose agar slants at 4 °C at the School of Marine Science, Sun Yat-Sen University (HM001).Fermentation, extraction and isolation
The fungus S. chartarum 952 was cultivated on rice culture medium (70 mL rice and 90 mL 3% artificial sea salt water per flask) and PDB medium (300 g potato and 20 g dextrose in 1 L 3% artificial sea salt water), respectively, in 1 L Erlenmeyer flasks for 35 days at 25 °C. After fermentation, the fungal culture in the rice medium was extracted exhaustively with MeOH three times to obtain crude extracts. The extracts were suspended in MeOH/H2O (8![[thin space (1/6-em)]](https://www.rsc.org/images/entities/char_2009.gif) :
:![[thin space (1/6-em)]](https://www.rsc.org/images/entities/char_2009.gif) 2) and extracted three times with n-hexane, CHCl3, and EtOAc successively. The chloroform extract (98 g) was subjected to CC on silica gel (200–300 mesh) and was eluted with PE–EtOAc of increasing polarity (from 1
2) and extracted three times with n-hexane, CHCl3, and EtOAc successively. The chloroform extract (98 g) was subjected to CC on silica gel (200–300 mesh) and was eluted with PE–EtOAc of increasing polarity (from 1![[thin space (1/6-em)]](https://www.rsc.org/images/entities/char_2009.gif) :
:![[thin space (1/6-em)]](https://www.rsc.org/images/entities/char_2009.gif) 0 to 0
0 to 0![[thin space (1/6-em)]](https://www.rsc.org/images/entities/char_2009.gif) :
:![[thin space (1/6-em)]](https://www.rsc.org/images/entities/char_2009.gif) 1) to afford five fractions (A–E). Fr. C was subjected to chromatography on Sephadex LH-20 (MeOH
1) to afford five fractions (A–E). Fr. C was subjected to chromatography on Sephadex LH-20 (MeOH![[thin space (1/6-em)]](https://www.rsc.org/images/entities/char_2009.gif) :
:![[thin space (1/6-em)]](https://www.rsc.org/images/entities/char_2009.gif) CH2Cl2 = 1
CH2Cl2 = 1![[thin space (1/6-em)]](https://www.rsc.org/images/entities/char_2009.gif) :
:![[thin space (1/6-em)]](https://www.rsc.org/images/entities/char_2009.gif) 1) to afford two fractions, which were denoted as Fr. C1 and Fr. C2. Fr. C1 was repurified by HPLC with isocratic elution with MeOH–H2O (80
1) to afford two fractions, which were denoted as Fr. C1 and Fr. C2. Fr. C1 was repurified by HPLC with isocratic elution with MeOH–H2O (80![[thin space (1/6-em)]](https://www.rsc.org/images/entities/char_2009.gif) :
:![[thin space (1/6-em)]](https://www.rsc.org/images/entities/char_2009.gif) 20) to obtain compound 2 (6 mg). Fr. C2 was subjected to chromatography on Sephadex LH-20 (MeOH
20) to obtain compound 2 (6 mg). Fr. C2 was subjected to chromatography on Sephadex LH-20 (MeOH![[thin space (1/6-em)]](https://www.rsc.org/images/entities/char_2009.gif) :
:![[thin space (1/6-em)]](https://www.rsc.org/images/entities/char_2009.gif) CH2Cl2 = 1
CH2Cl2 = 1![[thin space (1/6-em)]](https://www.rsc.org/images/entities/char_2009.gif) :
:![[thin space (1/6-em)]](https://www.rsc.org/images/entities/char_2009.gif) 1) and was further purified by HPLC elution with MeOH–H2O (80
1) and was further purified by HPLC elution with MeOH–H2O (80![[thin space (1/6-em)]](https://www.rsc.org/images/entities/char_2009.gif) :
:![[thin space (1/6-em)]](https://www.rsc.org/images/entities/char_2009.gif) 20) to obtain compounds 1 (4 mg), 3 (7 mg), and 5 (7 mg).
20) to obtain compounds 1 (4 mg), 3 (7 mg), and 5 (7 mg).
The cultures in the PDB medium were filtered to remove mycelia. The filtrate was concentrated under reduced pressure and then extracted three times with n-hexane, CHCl3, and EtOAc successively. The EtOAc extract (16 g) was subjected to CC on silica gel (200–300 mesh) and eluted with PE–EtOAc of increasing polarity (from 1![[thin space (1/6-em)]](https://www.rsc.org/images/entities/char_2009.gif) :
:![[thin space (1/6-em)]](https://www.rsc.org/images/entities/char_2009.gif) 0 to 0
0 to 0![[thin space (1/6-em)]](https://www.rsc.org/images/entities/char_2009.gif) :
:![[thin space (1/6-em)]](https://www.rsc.org/images/entities/char_2009.gif) 1) to afford five fractions (A–E). Fr. B was separated on Sephadex LH-20 (MeOH) and was then purified by HPLC (80% MeOH; flow rate 1.0 mL min−1; C18 10 × 250 mm, 5 μm) to give 8 (8.0 mg). Fr. C was subjected to RP-18 gel CC (MeOH/H2O, from 6
1) to afford five fractions (A–E). Fr. B was separated on Sephadex LH-20 (MeOH) and was then purified by HPLC (80% MeOH; flow rate 1.0 mL min−1; C18 10 × 250 mm, 5 μm) to give 8 (8.0 mg). Fr. C was subjected to RP-18 gel CC (MeOH/H2O, from 6![[thin space (1/6-em)]](https://www.rsc.org/images/entities/char_2009.gif) :
:![[thin space (1/6-em)]](https://www.rsc.org/images/entities/char_2009.gif) 4 to 1
4 to 1![[thin space (1/6-em)]](https://www.rsc.org/images/entities/char_2009.gif) :
:![[thin space (1/6-em)]](https://www.rsc.org/images/entities/char_2009.gif) 0) and was further purified by HPLC (80% MeOH; flow rate 1.0 mL min−1; C18 10 × 250 mm, 5 μm) to yield 9 (8.9 mg). The CHCl3 extract (80 g) was subjected to CC on silica gel (200–300 mesh) and eluted with PE–EtOAc of increasing polarity (from 1
0) and was further purified by HPLC (80% MeOH; flow rate 1.0 mL min−1; C18 10 × 250 mm, 5 μm) to yield 9 (8.9 mg). The CHCl3 extract (80 g) was subjected to CC on silica gel (200–300 mesh) and eluted with PE–EtOAc of increasing polarity (from 1![[thin space (1/6-em)]](https://www.rsc.org/images/entities/char_2009.gif) :
:![[thin space (1/6-em)]](https://www.rsc.org/images/entities/char_2009.gif) 0 to 0
0 to 0![[thin space (1/6-em)]](https://www.rsc.org/images/entities/char_2009.gif) :
:![[thin space (1/6-em)]](https://www.rsc.org/images/entities/char_2009.gif) 1) to afford five fractions (A–E). Fr. D was separated on Sephadex LH-20 (MeOH) and was then purified by HPLC (80% MeOH; flow rate 1.0 mL min−1; C18 10 × 250 mm, 5 μm) to give 4 (4.3 mg) and 6 (1.7 mg). Fr. E was subjected to CC on silica gel (200–300 mesh), eluted with PE–EtOAc and then purified by HPLC (80% MeOH; flow rate 1.0 mL min−1; C18 10 × 250 mm, 5 μm) to give 7 (2.4 mg).
1) to afford five fractions (A–E). Fr. D was separated on Sephadex LH-20 (MeOH) and was then purified by HPLC (80% MeOH; flow rate 1.0 mL min−1; C18 10 × 250 mm, 5 μm) to give 4 (4.3 mg) and 6 (1.7 mg). Fr. E was subjected to CC on silica gel (200–300 mesh), eluted with PE–EtOAc and then purified by HPLC (80% MeOH; flow rate 1.0 mL min−1; C18 10 × 250 mm, 5 μm) to give 7 (2.4 mg).
![[thin space (1/6-em)]](https://www.rsc.org/images/entities/char_2009.gif) ε) 277 (3.28), 320 (3.18) nm; ECD (MeOH) λmax (Δε) 230 (−8.17), 274 (10.20), 325 (−7.01) nm; IR (neat) νmax 3467, 2935, 1747, 1619, 1376, 1225 cm−1; HRESIMS m/z 459.2386 [M − H]− (calcd for C26H35O7, 459.2388); 1H and 13C NMR, see Table 1.
ε) 277 (3.28), 320 (3.18) nm; ECD (MeOH) λmax (Δε) 230 (−8.17), 274 (10.20), 325 (−7.01) nm; IR (neat) νmax 3467, 2935, 1747, 1619, 1376, 1225 cm−1; HRESIMS m/z 459.2386 [M − H]− (calcd for C26H35O7, 459.2388); 1H and 13C NMR, see Table 1.![[thin space (1/6-em)]](https://www.rsc.org/images/entities/char_2009.gif) ε) 277 (3.26), 324 (3.16) nm; ECD (MeOH) λmax (Δε) 232 (−6.60), 273 (11.53), 321 (−7.29) nm; IR (neat) νmax 3471, 2926, 1741, 1622, 1382, 1232 cm−1; HRESIMS m/z 445.2229 [M − H]− (calcd for C25H33O7, 445.2232); 1H and 13C NMR, see Table 1.
ε) 277 (3.26), 324 (3.16) nm; ECD (MeOH) λmax (Δε) 232 (−6.60), 273 (11.53), 321 (−7.29) nm; IR (neat) νmax 3471, 2926, 1741, 1622, 1382, 1232 cm−1; HRESIMS m/z 445.2229 [M − H]− (calcd for C25H33O7, 445.2232); 1H and 13C NMR, see Table 1.![[thin space (1/6-em)]](https://www.rsc.org/images/entities/char_2009.gif) ε) 276 (3.30), 319 (3.20) nm; ECD (MeOH) λmax (Δε) 234 (−5.65), 276 (6.57), 319 (−8.00) nm; IR (neat) νmax 3456, 2917, 1660, 1206 cm−1; HRESIMS m/z 387.2168 [M − H]− (calcd for C23H31O5, 387.2174); 1H and 13C NMR, see Table 1.
ε) 276 (3.30), 319 (3.20) nm; ECD (MeOH) λmax (Δε) 234 (−5.65), 276 (6.57), 319 (−8.00) nm; IR (neat) νmax 3456, 2917, 1660, 1206 cm−1; HRESIMS m/z 387.2168 [M − H]− (calcd for C23H31O5, 387.2174); 1H and 13C NMR, see Table 1.![[thin space (1/6-em)]](https://www.rsc.org/images/entities/char_2009.gif) ε) 212 (4.43), 284 (3.84), 329 (3.52) nm; ECD (MeOH) λmax (Δε) 218 (12.24), 271 (−5.23), 324 (−2.80) nm; IR (neat) νmax 3394, 2941, 2833, 1645, 1460, 1024 cm−1; ESIMS m/z 444.9 [M − H]−.
ε) 212 (4.43), 284 (3.84), 329 (3.52) nm; ECD (MeOH) λmax (Δε) 218 (12.24), 271 (−5.23), 324 (−2.80) nm; IR (neat) νmax 3394, 2941, 2833, 1645, 1460, 1024 cm−1; ESIMS m/z 444.9 [M − H]−.![[thin space (1/6-em)]](https://www.rsc.org/images/entities/char_2009.gif) ε) 211 (4.37), 285 (3.81), 330 (3.67) nm; ECD (MeOH) λmax (Δε) 210 (13.82), 286 (−3.51), 327 (−4.50) nm; IR (neat) νmax 3408, 2964, 2938, 1740, 1609 cm−1; HRESIMS m/z 487.2339 [M − H]− (calcd for C27H35O8, 487.2337); 1H and 13C NMR, see Table 2.
ε) 211 (4.37), 285 (3.81), 330 (3.67) nm; ECD (MeOH) λmax (Δε) 210 (13.82), 286 (−3.51), 327 (−4.50) nm; IR (neat) νmax 3408, 2964, 2938, 1740, 1609 cm−1; HRESIMS m/z 487.2339 [M − H]− (calcd for C27H35O8, 487.2337); 1H and 13C NMR, see Table 2.![[thin space (1/6-em)]](https://www.rsc.org/images/entities/char_2009.gif) ε) 217 (4.28), 266 (3.52), 308 (3.06) nm; ECD (MeOH) λmax (Δε) 218 (5.33), 233 (−3.52), 266 (−3.14) nm; IR (neat) νmax 3362, 2943, 2839, 1649, 1456, 1032, 663 cm−1; HRESIMS m/z 458.2531 [M + H]+ (calcd for C26H36O6N, 458.2537); 1H and 13C NMR, see Table 2.
ε) 217 (4.28), 266 (3.52), 308 (3.06) nm; ECD (MeOH) λmax (Δε) 218 (5.33), 233 (−3.52), 266 (−3.14) nm; IR (neat) νmax 3362, 2943, 2839, 1649, 1456, 1032, 663 cm−1; HRESIMS m/z 458.2531 [M + H]+ (calcd for C26H36O6N, 458.2537); 1H and 13C NMR, see Table 2.![[thin space (1/6-em)]](https://www.rsc.org/images/entities/char_2009.gif) ε) 217 (4.36), 266 (3.65), 306 (3.23) nm; ECD (MeOH) λmax (Δε) 217 (3.16), 233 (−3.33), 268 (−2.69) nm; IR (neat) νmax 3364, 2943, 2839, 1649, 1456, 1032, 663 cm−1; HRESIMS m/z 486.2842 [M + H]+ (calcd for C28H40O6N, 486.2850); 1H and 13C NMR, see Table 2.
ε) 217 (4.36), 266 (3.65), 306 (3.23) nm; ECD (MeOH) λmax (Δε) 217 (3.16), 233 (−3.33), 268 (−2.69) nm; IR (neat) νmax 3364, 2943, 2839, 1649, 1456, 1032, 663 cm−1; HRESIMS m/z 486.2842 [M + H]+ (calcd for C28H40O6N, 486.2850); 1H and 13C NMR, see Table 2.![[thin space (1/6-em)]](https://www.rsc.org/images/entities/char_2009.gif) ε) 219 (4.58), 269 (3.74), 310 (3.44) nm; ECD (MeOH) λmax (Δε) 219 (7.00), 234 (−0.70), 268 (−1.65) nm; IR (neat) νmax 3394, 2952, 2839, 1645, 1448, 1022 cm−1; ESIMS m/z 387 [M + H]+.
ε) 219 (4.58), 269 (3.74), 310 (3.44) nm; ECD (MeOH) λmax (Δε) 219 (7.00), 234 (−0.70), 268 (−1.65) nm; IR (neat) νmax 3394, 2952, 2839, 1645, 1448, 1022 cm−1; ESIMS m/z 387 [M + H]+.![[thin space (1/6-em)]](https://www.rsc.org/images/entities/char_2009.gif) ε) 226 (4.43), 259 (3.92), 300 (3.59) nm; ECD (MeOH) λmax (Δε) 224 (13.87), 240 (−0.95), 259 (−4.19) nm; IR (neat) νmax 3378, 2943, 2837, 1660, 1410, 1448, 1119, 1024, 658 cm−1; ESIMS m/z 387 [M + H]+.
ε) 226 (4.43), 259 (3.92), 300 (3.59) nm; ECD (MeOH) λmax (Δε) 224 (13.87), 240 (−0.95), 259 (−4.19) nm; IR (neat) νmax 3378, 2943, 2837, 1660, 1410, 1448, 1119, 1024, 658 cm−1; ESIMS m/z 387 [M + H]+.Preparation of the (R)- and (S)-MTPA esters of 1
A sample of 1 (1.0 mg), (R)-MTPACl (10.0 μL), and pyridine (0.5 mL) were allowed to react in an NMR tube at ambient temperature for 30 min to yield the (S)-MTPA ester 1a (0.8 mg). By the same procedure, the (R)-MTPA ester 1b (0.7 mg) was obtained from the reaction of 1 (1 mg) with (R)-MTPACl (10.0 mL).Bioactivity assay
The effectiveness against dengue virus of compounds 1–3 was determined by detecting the expression of the dengue virus protein prM using a western blot via a previously described method.15 RAW264.7 cells were purchased from the cell bank of the Chinese Academy of Sciences (Shanghai, People's Republic of China). Cell maintenance, experimental procedures, the determination of data for the inhibition of the production of NO, and the viability assay were performed according to a modified literature procedure.16,17 RAW 264.7 cells were seeded in 96-well plates (Nunc) at a density of 1 × 10⁵ cells per well and incubated overnight. Then the cells were treated with LPS (1 μg mL−1) and various concentrations of the compounds for 24 h. Subsequently, 50 μL cell culture supernatant solution was removed to a new 96-well plate (Nunc), and 50 μL nitric oxide detection reagent I and 50 μL nitric oxide detection reagent II were added to each well, respectively. The absorbance was measured at 540 nm with an Infinite M200 PRO microplate reader (TECAN). The IC50 values were determined using Origin 8Pro software from experiments performed in triplicate. Indomethacin (IC50 value of 37.5 ± 1.6 μM) was used as a positive control. All the tested compounds were prepared as stock solutions in DMSO, and the final solvent concentration was less than 0.2% in all assays.Conclusions
In summary, nine meroterpenoids, including six new compounds, were isolated from the crinoid-derived fungus Stachybotrys chartarum 952. To the best of our knowledge, the nine meroterpenoids 1–9 were the first secondary metabolites to be reported from this crinoid-derived fungus. Chromenes 1–3 and phenylspirodrimanes 4–9 were isolated from the fungus S. chartarum 952. In addition, it was suggested that both kinds of compounds were derived from orsellinic acid and farnesyl diphosphate. Compound 1 exhibited inhibitory activity against the replication of dengue virus and would be a promising compound for the development of agents for the inhibition of dengue virus.Conflicts of interest
There are no conflicts to declare.Acknowledgements
This work was supported by the National Natural Science Foundation of China under Grant No. 21272286 and 41606167 and China's Marine Commonwealth Research Project under Grant No. 201305017.Notes and references
- A. Wang, Y. Xu and Y. Gao, Phytochem. Rev., 2015, 14, 623–655 CrossRef CAS.
- Y. Li, C. Wu, D. Liu, P. Proksch, P. Guo and W. Lin, J. Nat. Prod., 2014, 77, 138–147 CrossRef CAS PubMed.
- X. Ma, L. Li, T. Zhu, M. Ba, G. Li, Q. Gu, Y. Guo and D. Li, J. Nat. Prod., 2013, 76, 2298–2306 CrossRef CAS PubMed.
- B. B. Jarvis, J. Salemme and A. Morais, Nat. Toxins, 1995, 16, 1–7 Search PubMed.
- T. G. Rand, J. Flemming, J. D. Miller and O. Taiwo, J. Toxicol. Environ. Health, Part A, 2006, 13, 1239–1251 CrossRef PubMed.
- J. Zhao, J. Feng, Z. Tan, J. Liu, J. Zhao, R. Chen, K. Xie, D. Zhang, Y. Li, L. Yu, X. Chen and J. Dai, J. Nat. Prod., 2017, 80, 1819–1826 CrossRef CAS PubMed.
- R. Geris and T. J. Simpson, Nat. Prod. Rep., 2009, 26, 1063–1094 RSC.
- M. J. Vázquez, A. Vega, A. Rivera-Sagredo, M. D. Jiménez-Alfaro, E. Díez and J. A. Hueso-Rodríguez, Tetrahedron, 2004, 60, 2379–2385 CrossRef.
- D. Liu, Y. Li, X. Li, Z. Cheng, J. Huang, P. Proksch and W. Lin, Tetrahedron Lett., 2017, 58, 1826–1829 CrossRef CAS.
- N. Iwata and S. Kitanaka, J. Nat. Prod., 2010, 73, 1203–1206 CrossRef CAS PubMed.
- Y. Kashiwada, K. Yamazaki, Y. Ikeshiro, T. Yamagishi, T. Fujioka, K. Mihashi, K. Mizuki, L. M. Cosentino, K. Fowke, S. L. Morris-Natschke and K. H. Lee, Tetrahedron, 2001, 57, 1559–1563 CrossRef CAS.
- T. R. Hoye, C. S. Jeffrey and F. Shao, Nat. Protoc., 2007, 2, 2451–2458 CrossRef CAS PubMed.
- W. X. Chunyu, Z. G. Ding, M. G. Li, J. Y. Zhao, S. J. Gu, Y. Gao, F. Wang, J. H. Ding and M. L. Wen, Helv. Chim. Acta, 2016, 99, 583–587 CrossRef CAS.
- J. W. Kim, S. K. Ko, H. M. Kim, G. H. Kim, S. Son, G. S. Kim, G. J. Hwang, E. S. Jeon, K. S. Shin, I. J. Ryoo, Y. S. Hong, H. Oh, K. H. Lee, N. K. Soung, D. Hashizume, T. Nogawa, S. Takahashi, B. Y. Kim, H. Osada, J. H. Jang and J. S. Ahn, J. Nat. Prod., 2016, 79, 2703–2708 CrossRef CAS PubMed.
- W. Wen, Z. He, Q. Jing, Y. Hu, C. Lin, R. Zhou, X. Wang, Y. Su, J. Yuan, Z. Chen, J. Yuan, J. Wu, J. Li, X. Zhu and M. Li, J. Infect., 2015, 70, 631–640 CrossRef PubMed.
- T. Etoh, Y. P. Kim, H. Tanaka and M. Hayashi, Eur. J. Pharmacol., 2013, 698, 435–443 CrossRef CAS PubMed.
- S. Chen, Z. Liu, H. Liu, Y. Long, D. Chen, Y. Lu and Z. She, Org. Biomol. Chem., 2017, 15, 6338–6341 CAS.
Footnotes |
| † Electronic supplementary information (ESI) available: Spectra of all new compounds (1H NMR, 13C NMR, 2D NMR, HRESIMS). CCDC 1563788. For ESI and crystallographic data in CIF or other electronic format see DOI: 10.1039/c7ra09859f |
| ‡ These authors contributed equally to this work. |
| This journal is © The Royal Society of Chemistry 2017 |

